
The Gilkey Glacier is a 32 km long outlet glacier flowing west from the Juneau Icefield. From 1948 to 1967 the Gilkey Glacier retreated 600 m and in 1961 a proglacial began to form. By 2005 Gilkey Glacier has retreated 3900 m from the 1948 terminus location.
 The glacier is currently terminating in this still growing lake, notice the new bergs and rifting at the glacier terminus.
  The retreat has been resulted from and in a thinning of in the lower reach of the glacier and the separation from Battle and Thiel Glacier. A major tributary to Gilkey Glacier, is Vaughan Lewis Glacier. At the base of the Vaughan Lewis Icefall where the Vaughan Lewis Glacier joins the larger Gilkey Glacier ogives form, as seen from above and below the icefall (Scott McGee).
 The ogives form annually and provide a means to assess annual velocity in this section of the glacier. Aerial photography of the ogives from the 1950’s combined with current satellite image provide the opportunity to assess ogive wavelength over a 50 year period, providing a long term velocity record for Gilkey Glacier. An ogive is a bulge-wave that forms annually due to a seasonal acceleration of the glacier through an icefall. The acceleration is enhanced in icefalls that are horizontally restricted. In most cases we do not have specific measurements of velocity through all season to ascertain the timing of the accelerated period, though typically spring would be the fastest. After formation the bulges move down glacier and a new bulge is formed the following year. The resulting train of ogives extending down glacier can be used to estimate the ice velocity by measuring the peak to peak separation between adjacent waves. Ogives can be visually identified as a series of arcuate wave crests and troughs pointing down glacier. Downglacier from this formation point the crests and troughs gradually flatten until the ogives are merely arcuate light and dark bands on the surface of the glacier. The dark bands are dense, blue and dusty ice that is compressed during summer, whereas the light bands are bubbly, white, air-filled ice that is compressed during winter.
In 1981 one of my tasks was to ski out through the top of the icefall inserting stakes in the crazily crevassed region to track summer velocity for the Juneau Icefield Research Program (JIRP). This has been completed often but not most years by JIRP. What we discovered was that velocity in 1981 had not changed from the 1960’s and 1970’s. Today we have frequent satellite imagery of the ogives to ascertain annual velocity that can be compared to the few aerial photographic records, in this case from 1056 and 1977. In several recent years Scott McGee of JIRP has specifically surveyed the distance between the first 11 ogive crest below the icefield. A comparison of the the ogives in 1956, 1977 and 2005 is possible by overlaying the images below. 

 . The distance from the first to the 40th ogive has gone from 6.8 km in 1956 to 6.75 km in 1977 to 6.2 km in 2005. In 1956 and 1977 the first ten ogives spanned 1500 meters indicating an annual glacier velocity of 150 meters. From 2003-2007 the distance of the first ten ogives averaged 1440 m, or 144 meters per year. The change in velocity is quite small, compared to the large retreat of the glacier. One other key measure of the ogive surveying program is the surface elevation. A longitudinal profile containing 179 survey points was established at the base of the Icefall in 2001-2007. This profile begins in the trough immediately upglacier of the crest of the first wave ogive and continues downglacier nearly 1.8 kilometers to a point where the amplitude of the ogives becomes zero (Graphs and data from JIRP) During this six year time period, the surface has lowered an average of 17 meters – nearly 3 meters per year – along the longitudinal survey profile, with a maximum of 22 meters. This substantial thinning at the base of the icefall indicates reduced discharge through the icefall from the accumulation zone above. This will lead to further retreat and velocity reduction of Gilkey Glacier.
Month: May 2011
Skeiðarárjökull Glacier,Vatnajökull retreat Grímsvötn eruption and Jökulhlaup May 2011-updated 5/26
Skeiðarárjökull Glacier is a large outlet glacier draining south from Iceland’s largest ice cap Vatnajökull. This glacier is well known for the massive glacier outburst floods, jökulhlaup, that are generated by Iceland’s most active volcano, Grímsvötn. This volcano is near the summit of the ice cap, the geothermal heat generates a subglacial lake in the Grímsvötn crater, that particularly during volcanic eruptions releases a large volume of meltwater. The volcano is 50 km from the terminus of the glacier where the meltwater emerges. The volcano erupted generating a jökulhlaup in 1998 and 2004. A view from the terminus which has retreated 3 km in the last 150 years and 500 m in the last decade, indicates the Volcano (G), ash layers of previous eruptions (a) on the glacier surface and the outlet streams J.  In the fall of 2010 a glacier outburst flood was recorded without an eruption. The Icelandic Met Office observed that on Oct. 31 a discharge of 143 m3/s was being released and the water was confined to a narrow part of the channel. Between 9 and 10 AM on November 1, the discharge tripled to 455 m3/s, filling most of the river channel underneath the bridge. By the next week flow had subsided, a view of the outlet river going under the highway indicates the size, normal melt is not occurring at this point, from the Met Office
 . The cloudy conditions have prevented the Icelandic Met Office from obtaining clear photographs of the eruption that began on May 21, 2011 to date. A ground view illustrating the issue from May 22 is available. If we go back to the Met Office photographs of the 2004 eruption we can see in the top image the volcano erupting through the accumulation zone of the ice cap. In the bottom image the jökulhlaup is draining from the west side of the glacier.
 . A survey by the Icelandic Met Office on 5/25 notes that “a group walked towards the eruptive site. Surveillance revealed much ash west and south of Grímsvötn. A few measurements, at locations where the ice was completely covered, gave ash thicknesses varying from 10 to 130 cm. According to satellite images very little ice has melted during the eruption. No signs of flooding is detected”. To generate a jökulhlaup you need considerable meltwater production and a means to trap a significant amount of this water for a period before releasing it abruptly. It appears the subglacial drainage system that was opened last fall by a jökulhlaup is still open enough to prevent any significant storage.Photo by Vilhjálmur Kjartansson
 The current eruption was heralded by a sharp increase in seismicity recorded by the Met Office monitoring stations beginning on May 18th top image. The most interesting point is that seismic activity in the entire Vatnajökull has been increasing in the last five years and that this can be seen in the time series below from the Met Office completed before the eruption. Further this activity is not confined to just the Grímsvötn as seen in the bottom image map.

 . To date there is no sign of a jökulhlaup, which typically appears within the first 24 hours after the eruption. The eruption was noted by the Met Service as ending on May 28th and thus no jökulhlaup is expected. This could reflect the fact that the subglacial lake was partially emptied in 2010 and would have to fill more than usual before it can float the glacier and release the meltwater underneath the ice cap. A map of a 1996 jökulhlaupfrom Jóhannesson (1998) indicates the span in tan of the terrain that was flooded by the jökulhlaup. The recent glacier retreat has been more rapid on the western and center portion of the terminus. In the eastern section the proglacial lake at the terminus has many numerous icebergs. This retreat is similar to that of draining the Tungnaarjökull west side of Vatnajokulland Bruarjokull on the north side.
  . The impact of this subglacial river discharge on the glacier will be minor compared to that on Gigjokull last year. The ash when it is more than 3 cm thick will insulate the glacier, less will tend to increase melting. The thickness distribution will not be known for sometime. Another observation is that the Icelandic Met Office has an excellent monitoring system in place to help forecast and respond to such events.
Hopper Glacier Retreat, will not survive
The Hopper Glacier is in the Beartooth Range of southwest Montana. The glacier is on the east side of Medicine Mountain and Sky Pilot Mountain. In 1966 the glacier in the USGS map ended at a lake marked simply as 10183 feet. The red line marks the mapped glacier boundary.  The glacier comprise two parts, one from beneath Medicine Mountain that was smaller, and the larger section below Sky Pilot. By 1998 (top image) in this aerial image from the USGS the two parts are separate and the glacier has retreated 200 meters from the shores of the lake, the terminus is marked by the green line. By 2004 the northern section is gone. The southern section of the glacier remains thin and the lack of snow cover anywhere on the glacier in 1998 indicates the lack of a persistent accumulation zone (Pelto, 2010). glacier cannot survive without a persistent accumulation zone. This is similar to the nearby and similarly named Grasshopper Glacier. In 2004 (middle image) the glacier has undergone an additional 180 meters of retreat and considerable thinning exposing new areas of rock and moraine that had been beneath the glacier. The blue line is the 2004 terminus. The 2009 image is from early in the summer and snow remains on the glacier, but not much for June (bottom image). By the end of summer this glacier will lose all of its snowcover. A comparison with 1998 indicates a number of locations of moraine that are showing indicating the thinning and disappearance of glacier ice in the basin. The blue placemarks point such locations.

 The southern section has an area of 0.18 km2. The glacier has retreated 420 m since 1966 and has lost 70% of its total area. This pattern of disappearing glaciers is also evident in the Wind River Range, Wyoming for example Minor Glacier. The winter of 2011 has lots of snowpack even in late May and the Hopper Glacier will not experience much if any loss in area this summer. The nearby Monument Peak Snotel site at 8850 feet maintained by the USDA, on May 20th 2011 had 79 inches of snow depth with 29 inches of water content (snow water equivalent). This compares to snow water equivalent of 16 inches in 1998, 11 inches in 2004 and 24 inches in 2009 on that same date.
Kuussuup Sermia, southern Greenland Retrea
Kuussuup Sermia is an outlet glacier in southern Greenland, 61.3 N 45.3 W. It actually a distributary glacier, with three different termini all ending in proglacial lakes, of the Qooqup (Qoorup) Sermia. The latter glacier calves into a fjord. Kuussuup Sermia separates at 700 meters from Qooqqup and terminates at 100 meters. The glacier’s equilibrium line where accumulation equals snow melt approximately is visible both in a Landsat Image from the summer of 2010. This annotated image indicates the main proglacial lake terminus (green arrow), secondary lake termins (pink), Qooqqup calving termini (purple), where the two seaprate (yellow) and the snowline (orange).
 . The snowline is at 1800 meters in this Sept. 10 image, the typical snowline is at 1700 meters. There are a large number of nunataks in the area of the snowline. If the high summer melt rates of the last decade continue these nunataks should expand. The snowline here is higher than in southeast Alaska, for example on Taku Glacier snowline (1000 meters), Pelto (2011). A comparison of the Landsat and Google Earth Imagery only span five years and show no significant changes. In Google Earth the terminus the green arrow area from the Landsat image is the focus, it is evident from 2005 (top) and 2009 (middle) during this period that the terminus has retreated 150 meters. What is more apparent bottom is that the lower 100 meters of the glacier is shattered and will be quickly lost (bottom)

 . The snowline in southern Greenland was exceptionally high in 2007 and 2010, as noted by Mernild et al (2011) on Mittivakkat Glacier and by Tedesco et al (2011) and Box et al (2011) in terms of the temperatures and melting observed.
Ptarmigan Ridge Glacier Retreat and Separation, North Cascades
Ptarmigan Ridge Glacier is nestled on the north side of Ptarmigan Ridge in the North Cascades of Washington. This is a small glacier that has been retreating and has separated into several smaller glaciers over the last 20 years. From 1984-2010 we have visited this glacier every year assessing the terminus in half of those years, in others it has still been buried by snowpack. The main terminus has retreated 120 meters. Given the total maximum glacier length is 360 m in 2010, this is a substantial loss. The sequence of images below indicate the retreat from the top a map based extent 1979, to a 1993 USGS aerial photograph middle, and the 2009 satellite image from Google Earth. The glacier boundary from the map is in magenta. 

 . The glacier retreat has been associated with an earlier melt out of this alpine region in general. This has been beneficial to the local mountain goats with a sharp population rise after 2002. We do a mountain goat census here every year at the request of the United States Forest Service.
  Despite the population increase along the ridge there is no sign of overgrazing. A closeup look at the terminus region illustrates not just retreat, but thinning as well when comparing the 1993 and 2009 imagery. The locations of thinning are shown by M thumbtacks in the bottom image.

 The terminus remains thin even on the steep slope as seen in the 2005 image of the terminus below. Above the terminus the steep slopes are typically well snowcovered into August as in 2007 second image.
 In 2011 a La Nina winter was predicted to lead to substantial snowfall and a cool winter inn the Pacific Northwest. The first half of the winter did not live up to the forecast, but the second half right through April did. The result is extensive snowpack. A comparison of the snowpack at Lyman Lake the best high altitude site that the USDA Snotel system has in the North Cascades indicates that as of May 10 the snowpack is quite high in 2011 (bottom image). It is not unusual at this site to have snowpack not decline significantly before May 20. This suggests that summer will not feature a substantial melt out of the Ptarmigan Ridge Glacier. This is my daughter Jill’s favorite field area and this year maybe we will not have to paint on a positive mass balance.

Freshfield Glacier Retreat New Lake Forms
The Freshfield Glacier in the Canadian Rockies retreat over the last five years has exposed a new glacier lake.  . Today the glacier is 10.1 km long beginning at 3070 meters and ending at 1970 m near the shore of the less than 5 year old lake. This glacier during the Little Ice Age stretched 14.3 km, one of the longest in the entire range. By 1964 the glacier had retreated 1900 meters exposing Freshfield Lake. From 1964-1994 the glacier retreated up this lake basin losing another 1500 meters of length. A comparison of a 1964 photograph from Austin Post and as close to the same view as I could get in Google Earth illustrates the 45 years of retreat. The red line halfway up the lake is the 1964 terminus and the red line at the edge of the lake the terminus location in the topographic map.
 By the mid-1990’s the glacier no longer reached the shores of Freshfield Lake, as seen in the Canadian Topographic map, top image. In 2004 a satellite image (middle) indicates the glacier has retreated 400 meters from the lake but there is no sign of a second lake yet. In the current Google Earth Imagery a new lake has developed that is 370 meters across (bottom image), the new lake is marked N and Freshfield Lake (F). A 2012 Landsat image indicates that the glacier has retreated rapidly from the second lake, has continued and now terminates 1100 meters from the shore of Freshfield Lake.


 The glacier currently ends at 1970 m. Above the terminus there are two concentric depressions that typically indicate a depression beneath the glacier that would tend to at least seasonally fill with water. Such a depression cannot form except with a stagnating and rapidly retreating glacier tongue. This indicates that at least the next kilometer of the glacier will be lost quicly. In the terminus picture below the depressions are indicated by the letter B, and a nunatak poking out of the ice by the letter N. The map terminus is in red.
 . This glacier remains large and is not in danger of disappearing with present climate. Its behavior mirrors that of the Waputlik Icefield, but is less dramatic in terms of area loss than Warren Glacier or the disappearing Helm Glacier. Glaciers in Alberta as a whole are losing a much greater percentage of their area than Freshfield Glacier as reported by Bolch et al (2010)
Oberaar Glacier Retreat and Hydropower
The Oberaar Glacier at the headwaters of the Aare River is one of the key glaciers whose runoff feeds the complex hydropower system built by Kraftwerke Oberhasli (KWO) from the 1930’s thorugh 1979. The Glacier ended in the artificial lake Oberaarsee created by damming the glacier outflow in 1932. Oberaarsee (O) is dominantly a glacier fed reservoir, which is evident in this 2002 image from Jürg Alean  This dam is close to two other largely glacier fed reservoirs Grimselsee (G) and Raterichsbodensee (R).
  The upper watershed of the Aare provides ideal natural conditions for hydropower generation, abundant water, deep broad glacial valleys for water storage and a 1700 m elevation drop from the Oberaarsee down to Innertkirchen. KWO’s constellation of power plants, seven hydro dams, a natural lake and around 130km of water carrying pipes was completed only in 1979. The total output of the KWO system is 1100MW, equivalent of a large nuclear plant. The network that supplies 7% of the hydropower for Switzerland is fascinating as seen in the schematic below from KWO.
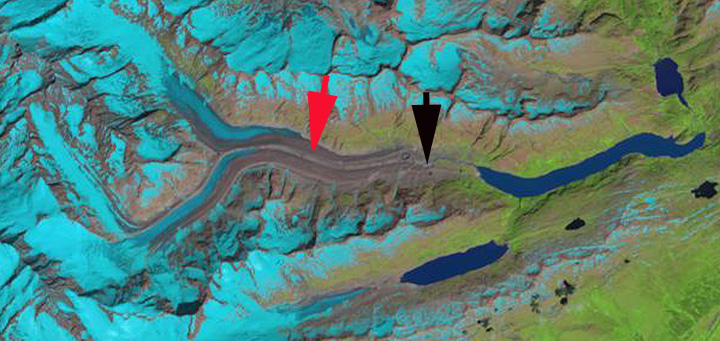
Oberaar Glacier has retreated 1500 meters since the building of the dam and now no longer reaches the shores of Oberaarsee. The glacier from 1953-1967 retreated at a rate of 42 meters per year, calving into the lake with the average depth of 17 meters. The presence of the lake enhanced retreat, the glacier velocity was 8 meters per year, while calving retreat was 42 meters per year. The lake did not cause the retreat though, as Gauligletscher the next glacier to the north has experienced a large retreat since 2000. The Swiss Glacier Commission’s retreat history indicate that by the 1970’s the glacier was in shallow water near the edge of the lake and retreat was minor. More recently though the lake is no longer enhancing retreat, the retreat rate has again risen to more than 20 meters per year from 1998-2010. The glacier has retreated 460 meters from the edge of Oberaarsee. By 2013 Landsat imagery indicates the glacier has retreated approximately 1 km from the lake, black arrow indicates terminus and red arrow the end of the stagnant zone.  .
.  The Swiss Glacier Commission monitored the glacier surface and found the lower section of the glacier below 2700 meters, thinned by 7.3 meters from 2001-2005 representing a volume loss of 13.5 million cubic meters. Given that lower glacier thickness averages somewhere close to 75-100 meters, this was 7-10% of the glacier lost in four years. Compared to the 1960’s the glacier near the terminus has slowed from 8 to 4 meters per year. It is evident that terminus tongue is thin nearly stagnant moving at 2 meters per year in 2005. The glacier thinning is rapid which is also indicated by the degree to which the lateral margin of the glacier is higher due to the higher debris cover. This occurs only during periods of rapid retreat. The retreat will continue due to the recent snow line rise that has reduced the area of the accumulation zone. The glacier has an icefall at 2800 meters and and above this at 3050 meters is a significant consistent accumulation zone; however not large enough to maintain the large lower elevation glacier tongue. This is similar to all Swiss Glaciers, the average mass balance from 2000-2010 has been consistently and substantially negative as reported to the WGMS, -0.8 meters per year. This has led to retreat of 98% of all glaciers in the Alps such as Maladeta, Italyand Ochsentaler in Austria. The Swiss have the best annual terminus survey system and the graph at bottom indicates the percent retreating in red, advancing in blue, and stationary in green. It is clearly a red tide.
 With glacier area loss the summer melt will decline and summer inflow to Oberaarsee will decline. The total annual inflow is determined by annual precipitation and is not changed by loss of glacier area. This decline in natural glacier storage is one reason KWO is contemplating expanding the reservoir storage of Grimselsee.
