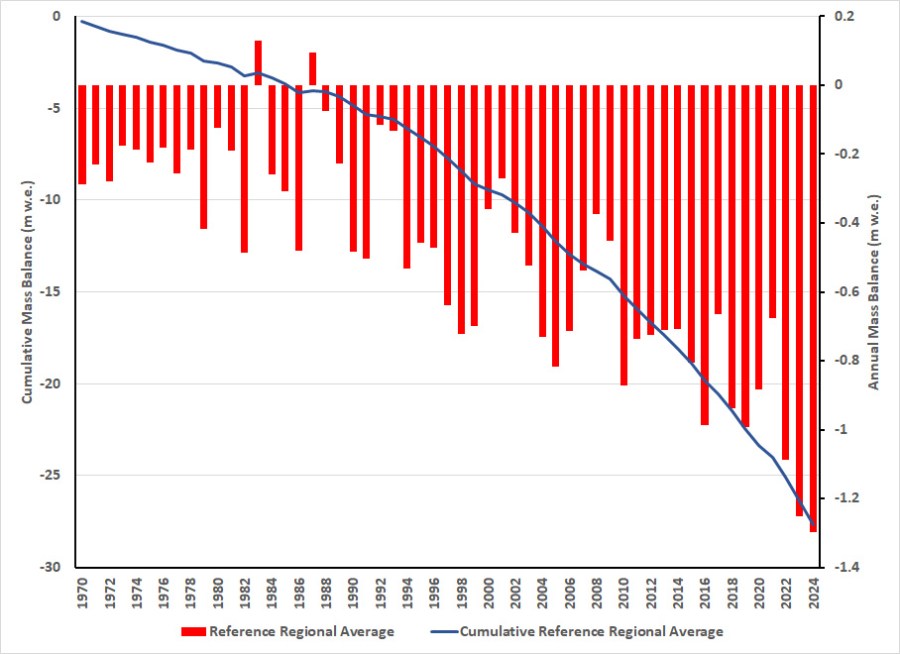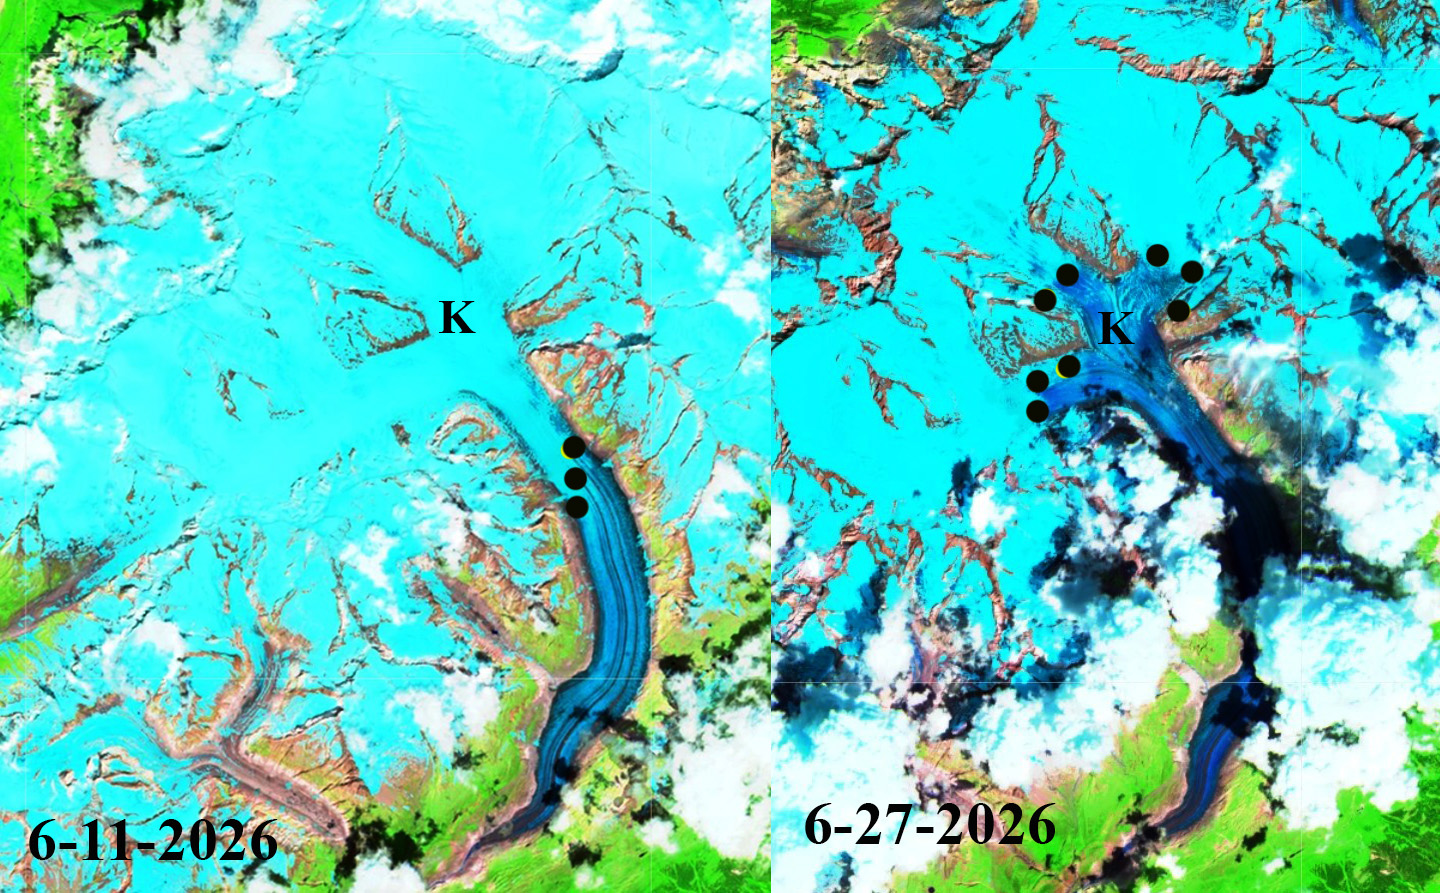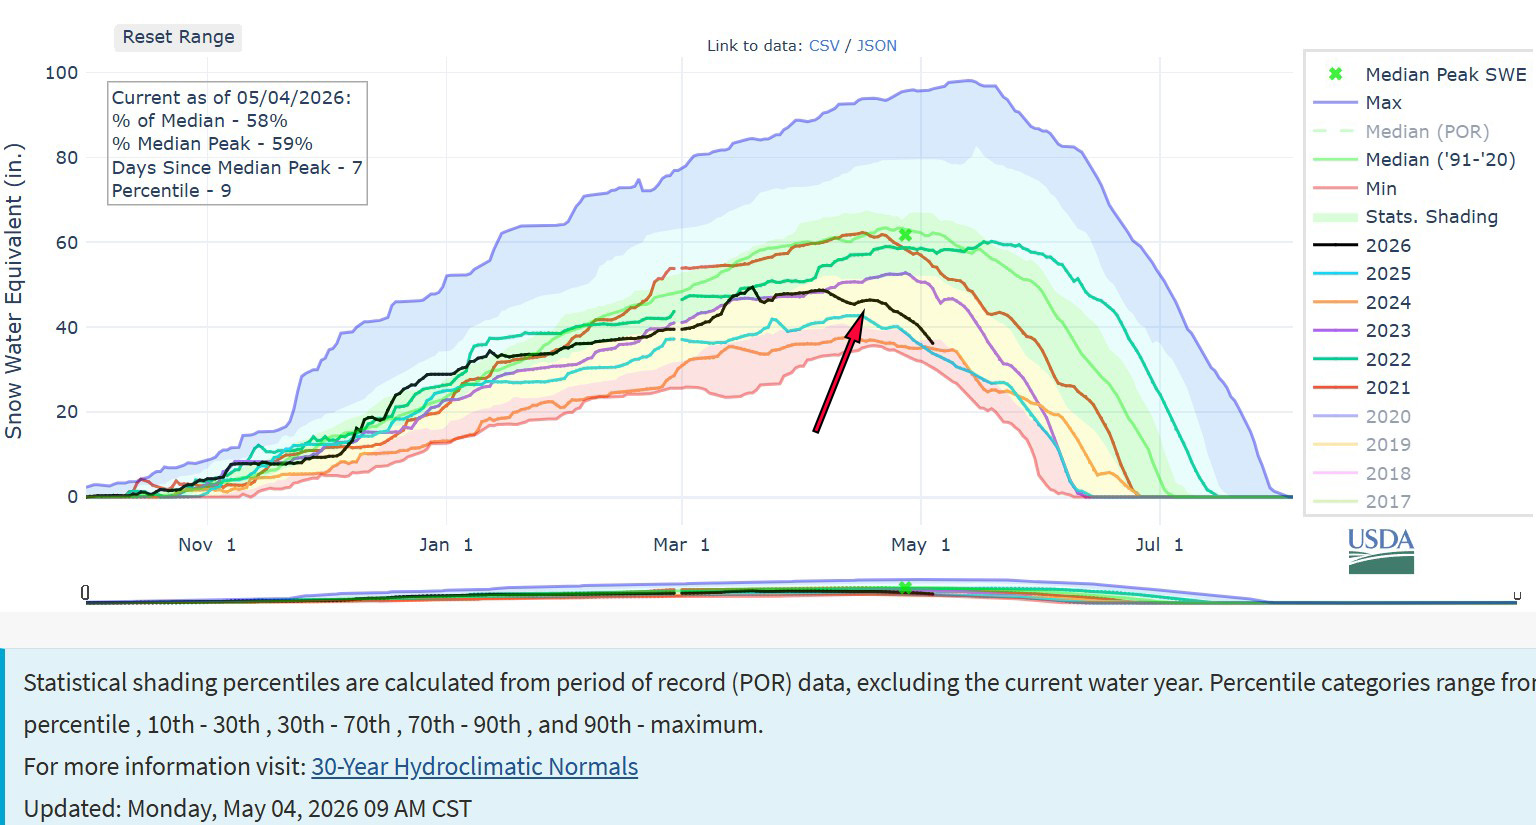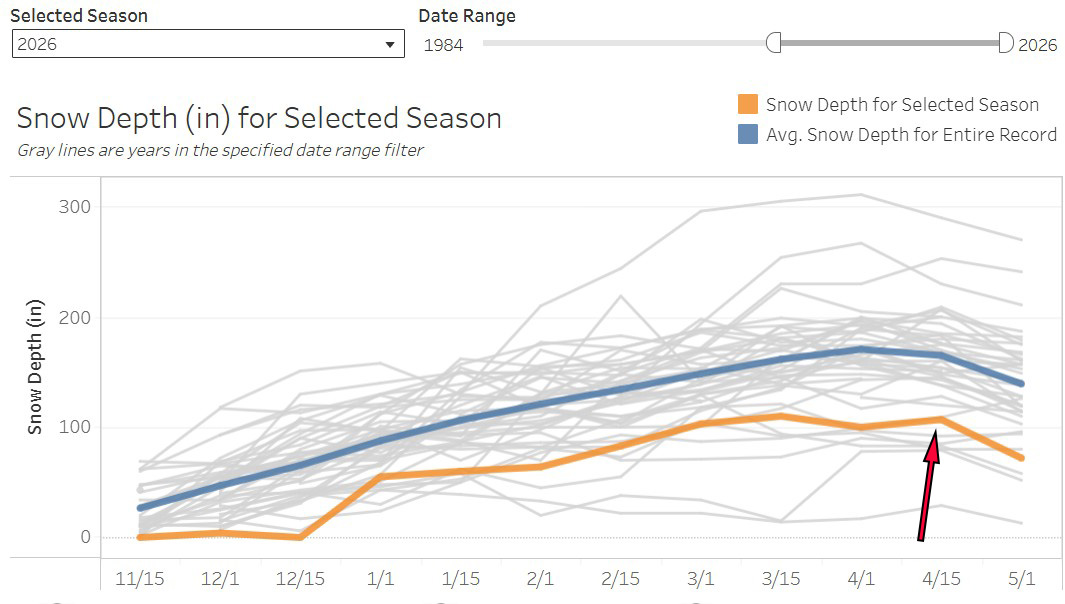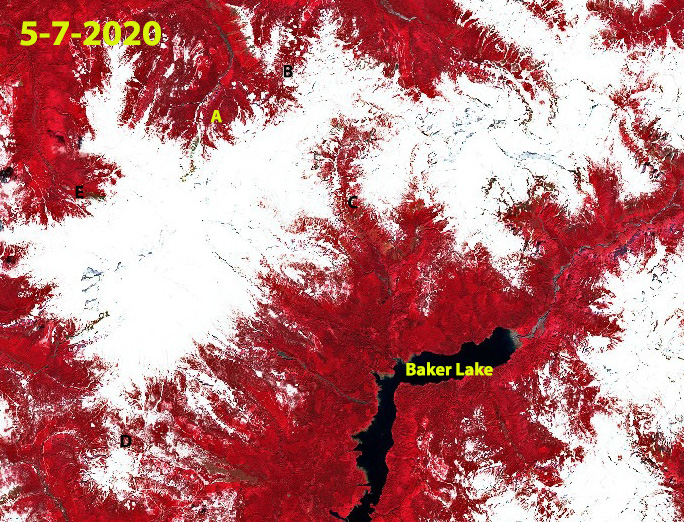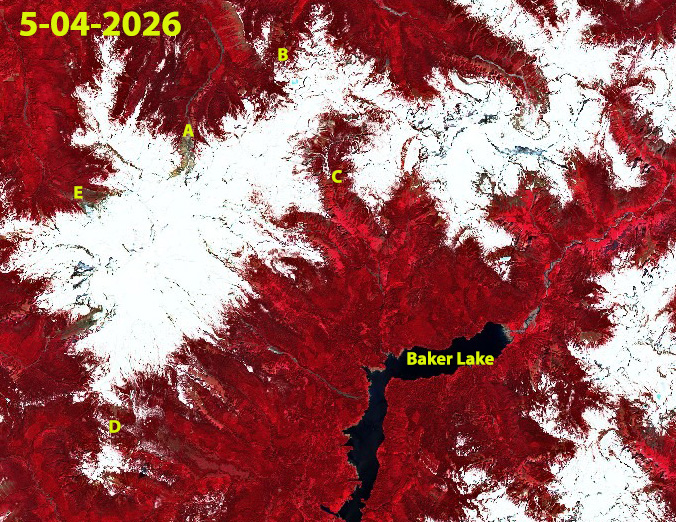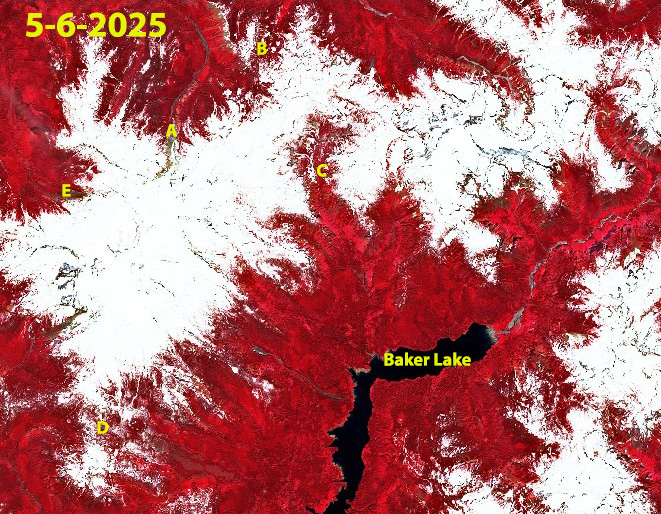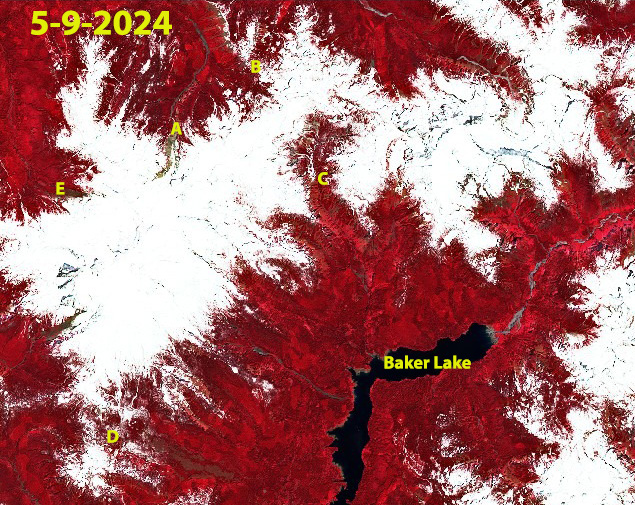
2026 Field Season: For the 43rd consecutive summer we are heading into the field to measure and communicate the impact of climate change on North Cascade glaciers. This field season follows the 2021-2025 seasons that featured either historic heat waves and/or periods of extended warm weather. The heat led to a greater exposure of bare ice on glaciers with a higher albedo and greater density. The observed melt rates are 7-9 cm/day water equivalent during warm weather events vs 4-6 cm/day for snow surfaces. This led to substantial mass losses on North Cascade glacier for the five years of ~8m. This winter was poor and the summer will be hard on glaciers. This year we have provided support from Alpine Start, Marmot, Protect our Winters and Smartwool.
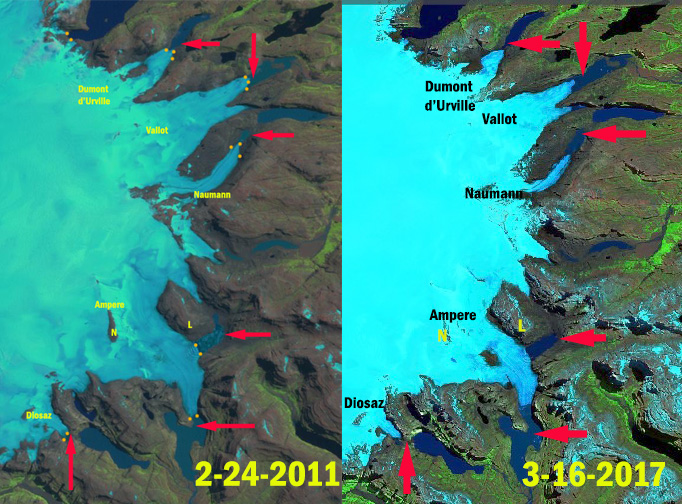
Science objectives: We will complete detailed measurements on 10 glaciers, three of which are part of the World Glacier Monitoring Service reference glacier network (48 glaciers globally), which have 30+ consecutive years of mass balance observations. This summer we will have an opportunity to assess the long-term ramifications of the 2021-2025 period of unprecedented mass balance losses and associated glacier changes, with detailed mass balance, crevasse depths and glacier surface elevation profiling. We also focus on the impact of diminishing glacier size on downstream runoff.
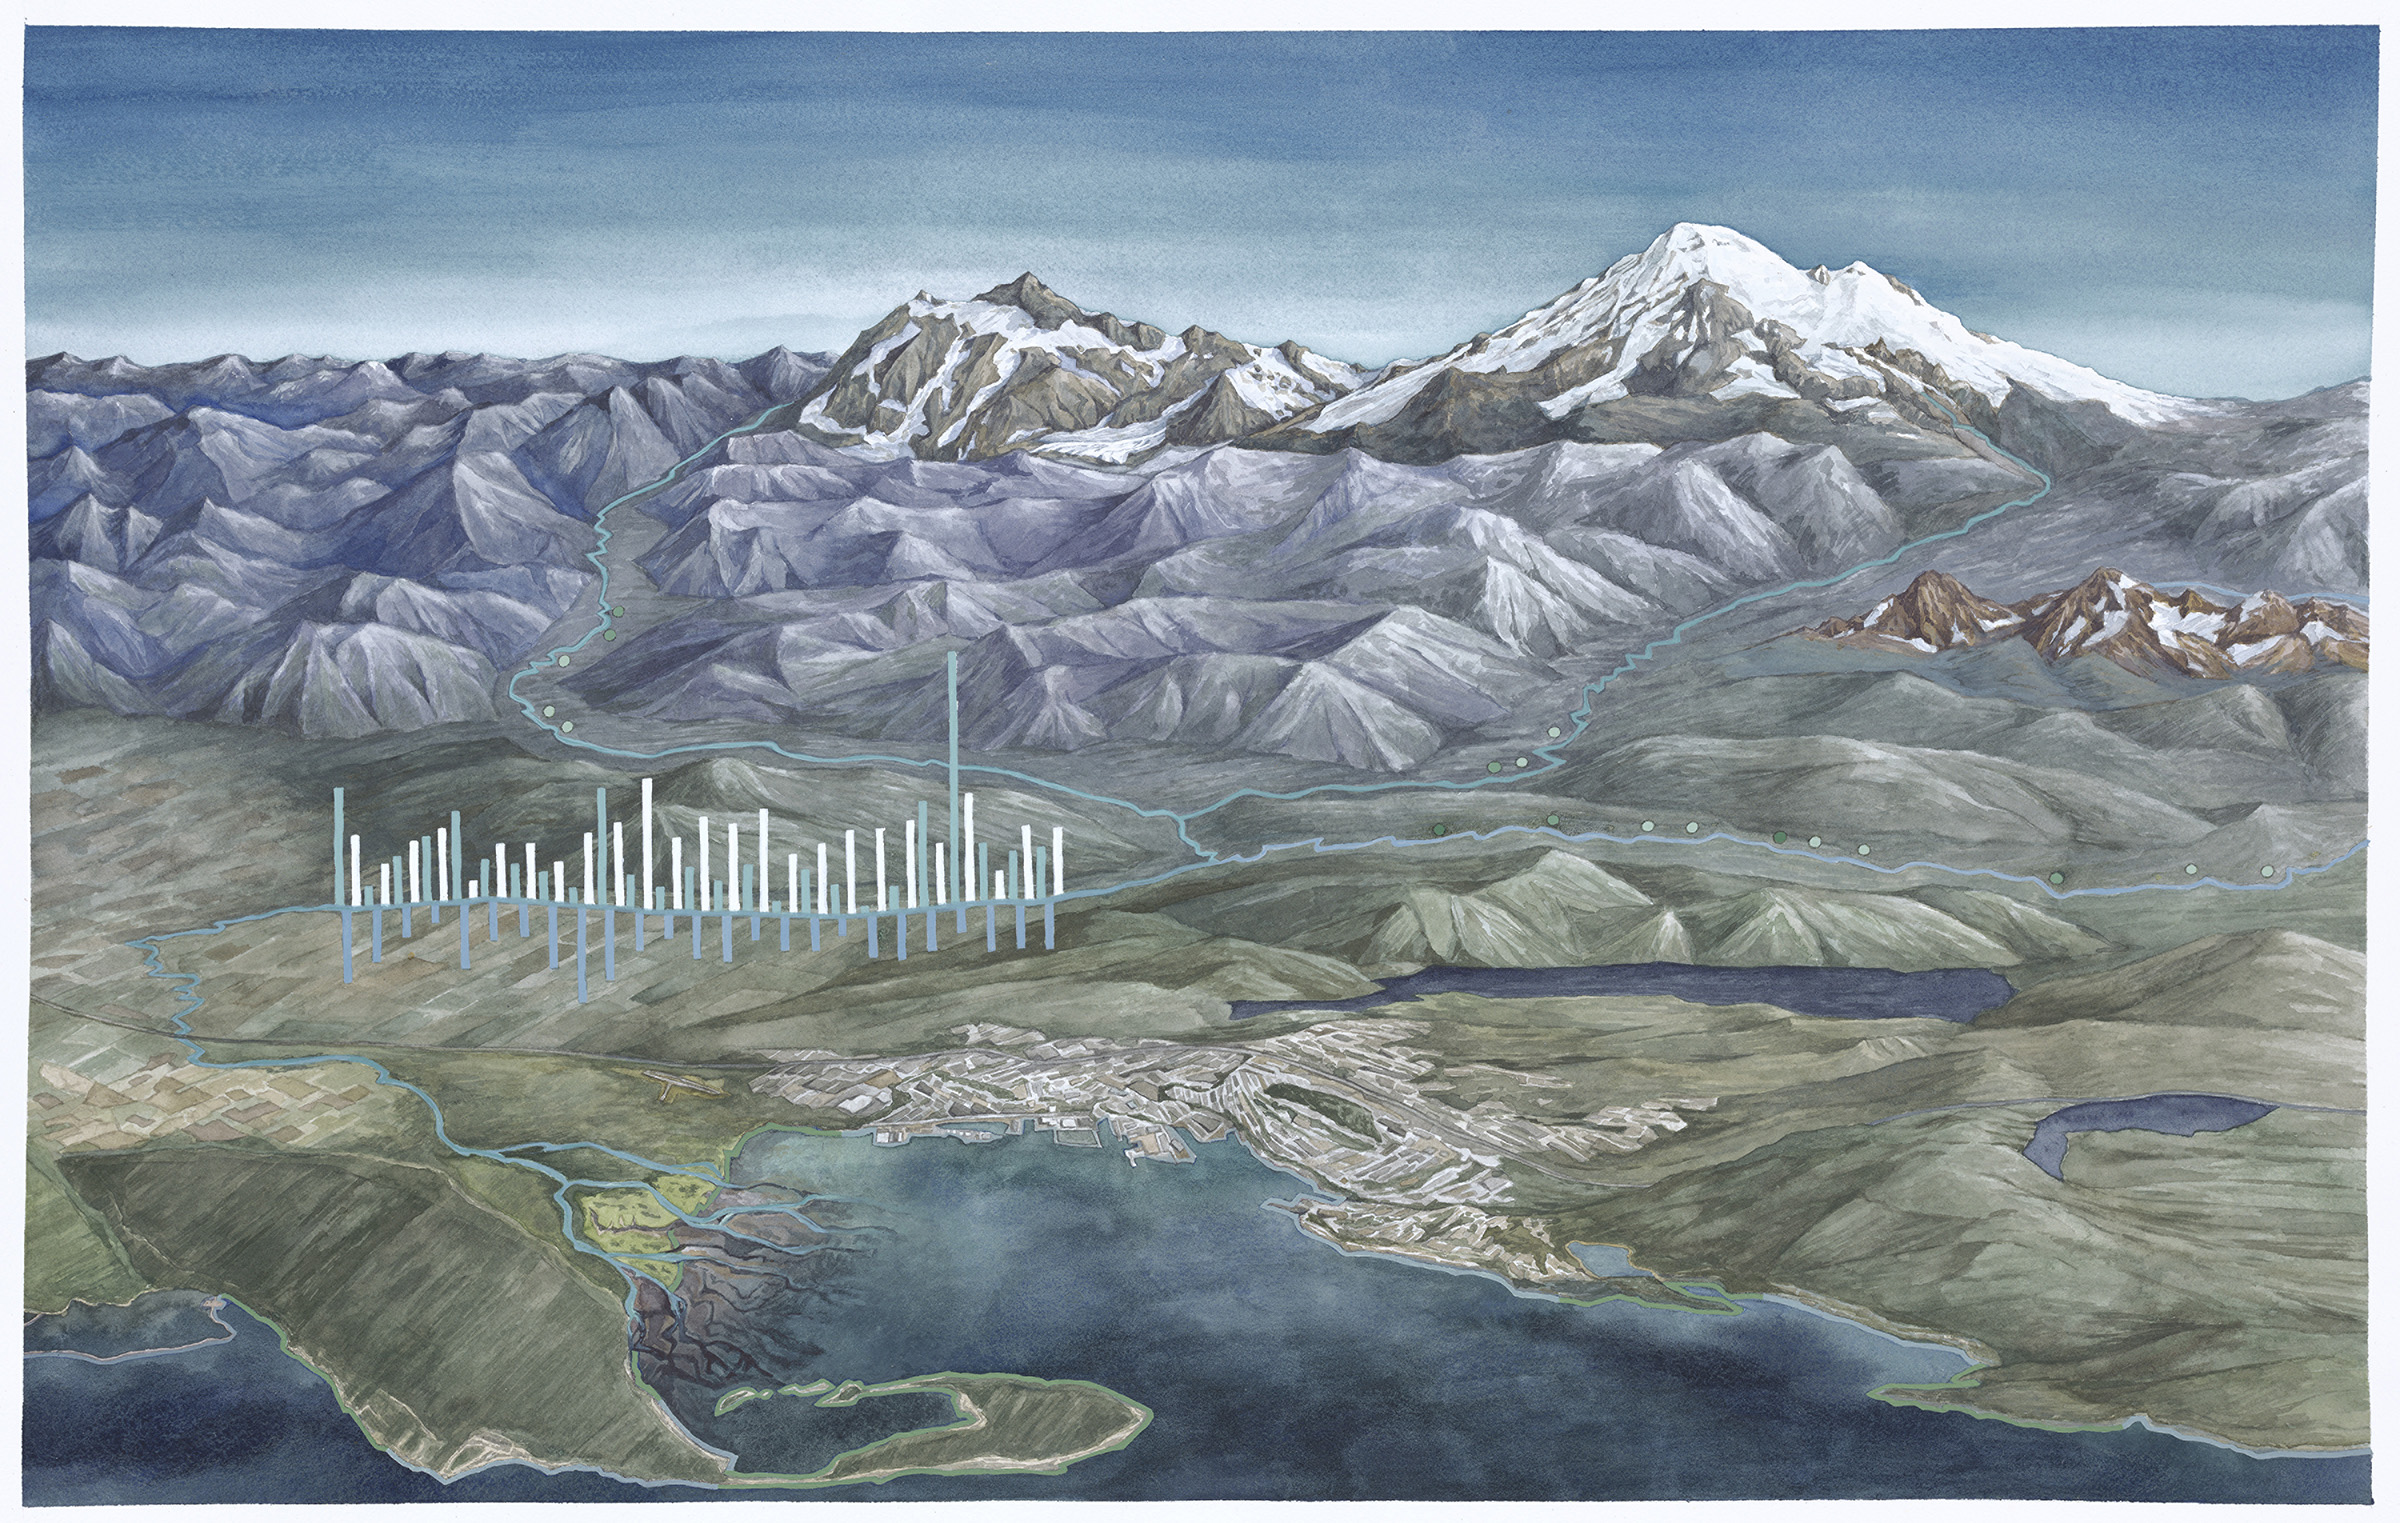
Art Objectives: We will collaborate with several artists who will join us for a portion of the field season. They will be able to create their own work about the landscape and the science or may join us for fieldwork and make plans for future artwork. We hope to use this art to share our research with a broader audience and highlight the beauty and importance of these places.
Communication Objectives: We will leverage the brands of our expedition sponsors and local organizations that we are building collaborations to focus on continued rapid glacier loss and the downstream effects. We will utilize a combination of artists and scientists to tell the story.
Bios
Jill Pelto (she/her) is an artist and scientist from New England who grew up loving winter sports and trips to the mountains. She incorporates scientific research and data into paintings and prints to communicate environmental changes. 2025 was Jill’s 17th field season. She has coordinated an art gallery exhibit “Shaped by Ice” in Seattle in 2025 and in Winthrop, WA in 2026. She is excited about continuing to document the change in North Cascade glaciers that she has witnessed each of the last ten years —through science and art.
Mauri Pelto (he/him) has directed the project since its founding in 1984, spending more than 800 nights camped out adjacent to these glaciers. He is the United States representative to the World Glacier Monitoring Service. For 16years he has been author of the blog “From a Glacier’s Perspective”, and associate editor for three science journals. He is on the Science Advisory Board for NASA’s Earth Observatory. His primary position is Associate Provost at Nichols College, where he has been a professor since 1989. He either runs on trails or skis on alpine and cross country trails every day.
Ava Reynolds is a printmaker examining the relationship between environmental beauty and climate change in her work. Ava holds a B.A. in Global Sustainability and a B.A. in Studio Art from the University of Virginia (2020), and is in her first year at the Rhode Island School of Design, pursuing an MFA in Printmaking. She finds inspiration for her prints from organic forms, natural landscapes, and climate change data and seeks to use art as a medium to engage with a large audience about the impacts of climate change.
Shaina Dotson is a Seattle-based creative with a BFA in Metalsmithing whose hobbies include metal arts, fiber arts, and printmaking. She serves on the board of the Washington Alpine Club and instructs for their Basic Climbing Class, sharing her love of the mountains with new climbers. Shaina is an avid mountaineer who finds joy in exploring the forests, peaks, and wild places of Washington State. Her deep connection to the landscape, combined with a love of learning and giving back to her community, naturally drew her to this project. She looks forward to creating new work inspired by the glaciers of Washington and the research this project brings to light.
Rikki Held is an early-career scientist passionate about understanding Earth and climate systems and communicating science through film. Growing up on her family’s ranch in southeastern Montana and studying the adjacent river with USGS scientists sparked her interest in investigating the complex Earth systems in which we live. She earned her B.A. in Environmental Science at Colorado College and has conducted interdisciplinary research, taught high school biology and chemistry through the Peace Corps in Kenya, and communicated climate impacts through her climate advocacy work in Montana. In graduate school, Rikki aims to study glaciology and climate variability to better predict future change. She looks forward to learning from the scientists and artists involved in NCGCP and creating a short documentary on their inspiring work.
Abby Conner (she/her) is a water resources professional with a passion for connecting people to their local watersheds. She earned her M.S. in Civil Engineering from the University of Colorado and returned to the PNW, where she serves on the board of the Carkeek Watershed Community Action Project and volunteers with the Mountaineers. She looks forward to bringing her background in water resources to the NCGP and exploring the connections between North Cascade glaciers and the communities downstream.
Nina Adjanin (she/her) is an associate professor at Northwest Missouri State University. Her work integrates technology and immersive experiences to explore the intersection of education, extreme environments, and the impact of climate change on high mountains and polar regions. Beyond her academic work, Nina is an experienced high-altitude mountain guide and adventurer, with expeditions that have taken her to extreme environments around the world and shaped her interdisciplinary approach to research. Nina is thrilled to be joining this project documenting the changes in the North Cascade glaciers, bringing her background in extreme environments and climate change research.
Danielle Schlunegger-Warner is a multi-disciplinary artist working in sculpture, installation, and experimental digital photography, to celebrate the wonder of the natural world. After graduating from California College of Art with a BFA in Sculpture, she has fabricated and designed museum exhibits for over ten years and maintained an independent art practice including science communication projects. For NCGCP, Danielle plans to continue combining her art, science, and museum exhibit background. She will investigate how the rapidly changing glacial landscape of the Cascades can be seen through the lens of a microscope, intertwining field microscopy, image projection, and artistic observations illustrating impact of smallest forms of life the greater environment.
2026 Schedule
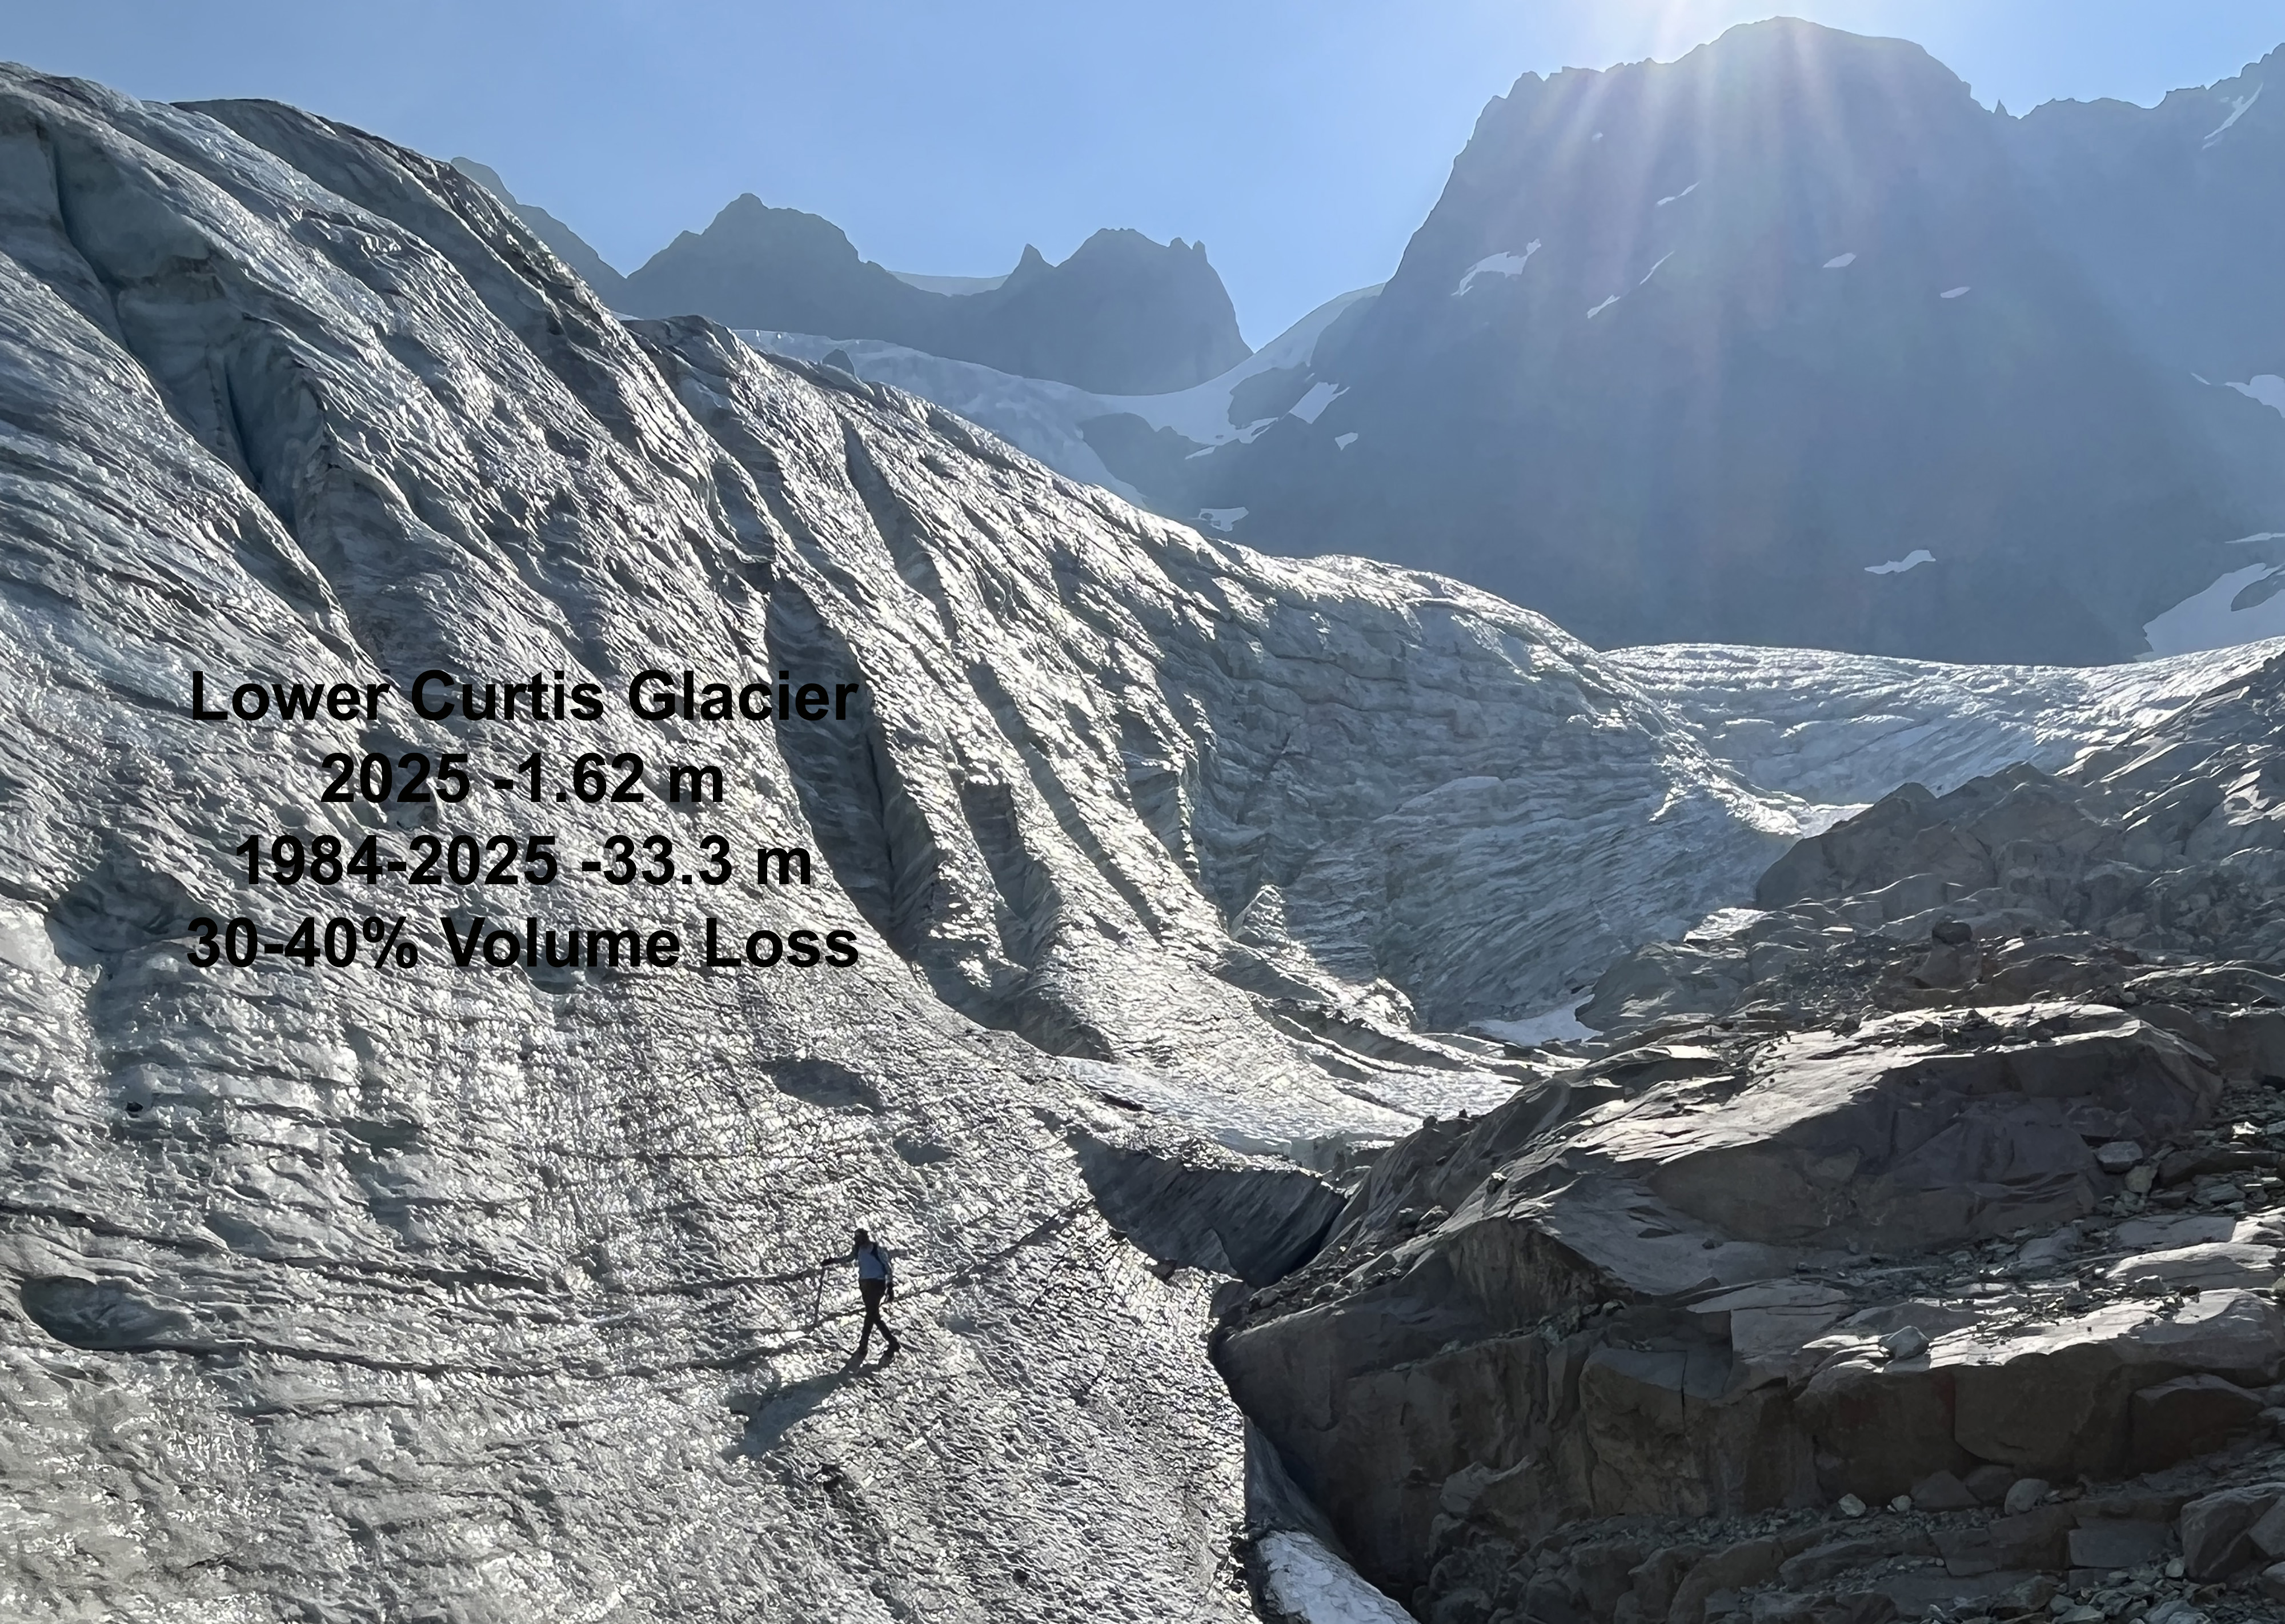
- July 28: Hike In Lower Curtis Glacier
- July 29: Lower Curtis Glacier survey
- July 30: Hike Out Lower Curtis/Hike in Ptarmigan Ridge
- July 31: Sholes Glacier
- Aug. 1: Rainbow Glacier
- Aug. 2: Rainbow Glacier
- Aug. 3: Hike out. Hike in Easton Glacier (Resupply in Bellingham WA)
- Aug. 4: Easton Glacier
- Aug. 5: Easton Glacier
- Aug. 6: Squak Glacier
- Aug. 7: Talum Glacier
- Aug. 8: Hike out Hike in Columbia Glacier (resupply in Monroe WA)
- Aug. 9: Columbia Glacier
- Aug. 10: Hike out Columbia-Hike in Daniels
- Aug. 11: Mount Daniels Survey
- Aug. 12: Ice Worm-Hike out