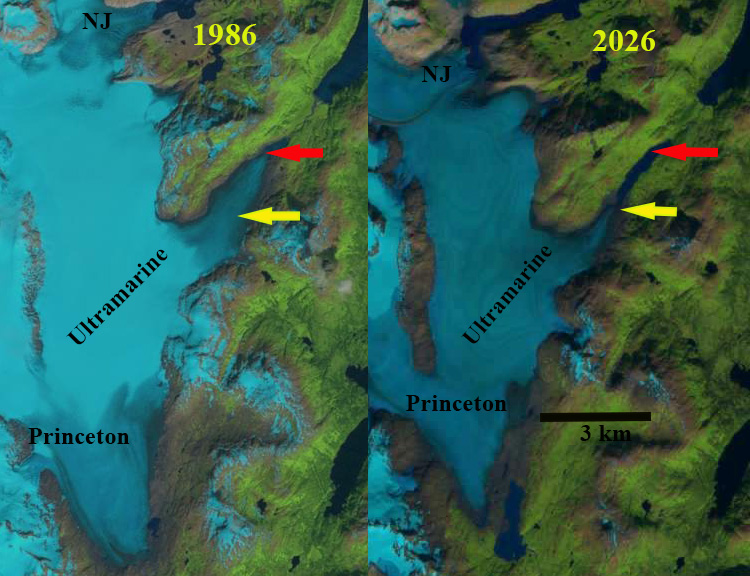
Ultramarine Glacier in 1986 and 2026 Landsat image, red arrow 1986 terminus and yellow arrow 2026 terminus. The glacier has retreated 2.2 km and in 2026 has no retaied snow cover. (NJ=Nellie Juan Glacier)
Ultramarine Glacier is an outlet glacier of the Sargent Icefield. The terminus extends northwest from the glacier and icefield. To the south is Princeton Glacier and the north is Nellie Juan Glacier. The glacier terminus has been in an expanding proglacial lake, but appers to be retreating from this lake. The glacier has a low elevation accumulaiton between 300 and 525 m, with a terminus tongue extending down to 100 m.
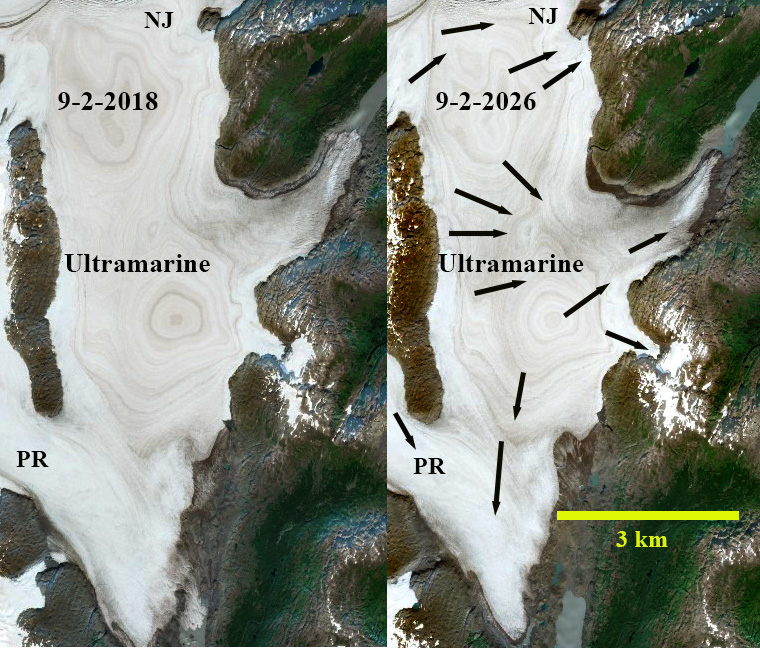
The glacier has retreated 2.2 km since 1986, similar to the 2.8 km retreat of Nellie Juan Glacier. In 2018, 2019, 2020, 2021, 2022, 2024 and 2026 the glacier lost all of its snow cover. The firn layers are evident in the Landsat image above and the Sentinel images below, these layers are not visible when snow cover exists. The ring pattern marks the ice divides where ice flows either to the Nellie Juan, Ultramarine or Princeton Glacier. A glacier without a persistent accumulation zone cannot survive. This is the situation for Ultramarine Glacier, with an area of 17 km2 it will endure for several decades. The Contact Glacier to the north that was connected to the Nellie Juan Glacier as well, is in the same situation, but with an area of 2.5 km2 will disappear sooner. The glacier fits well the regional pattern including in Kenai Fjords National Park (Black and Kurtz, 2021) and Excelsior Glacier on the south side of the icefield.
Ultramarine Glacier with no snow cover in 2018 and 2026. The firn layers are evident which also highlight the flow divides of the glacier. (NJ=Nellie Juan Glacier, PR+=Princeton Glacier)
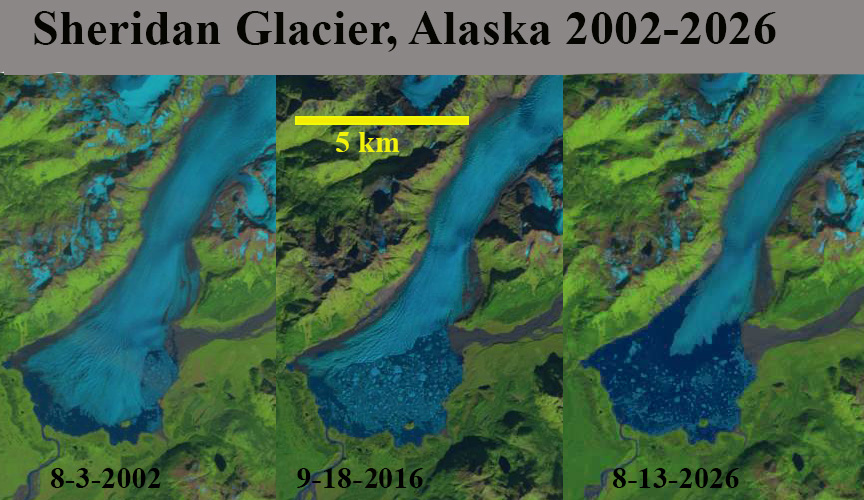
Retreat of Sheridan Glacier and expansion of Sheridan Lake from 2002-2026 in Landsat images. Lake has expanded from 3.8 to 13.5 km2, due to 2.25 km retreat.
.Sheridan Glacier in the Chugach Mountains of Alaska flows southwest out of the mountains onto a terminus plain where it has gouged out a lake basin that expands as the glacier retreats. Sheridan Lake is a proglacial lake at the terminus that drains into the Sheridan River that 12 km later reaches tidewater. From 1950 to 2000 Sheridan Glacier experienced modest retreat, with a fringing proglacial Sheridan Lake persisting. Then a rapid retreat accompanied a terminus disintegration from 2000-2016. (Shugar et al 2018). This led to lake expansion that is ongoing in 2026.
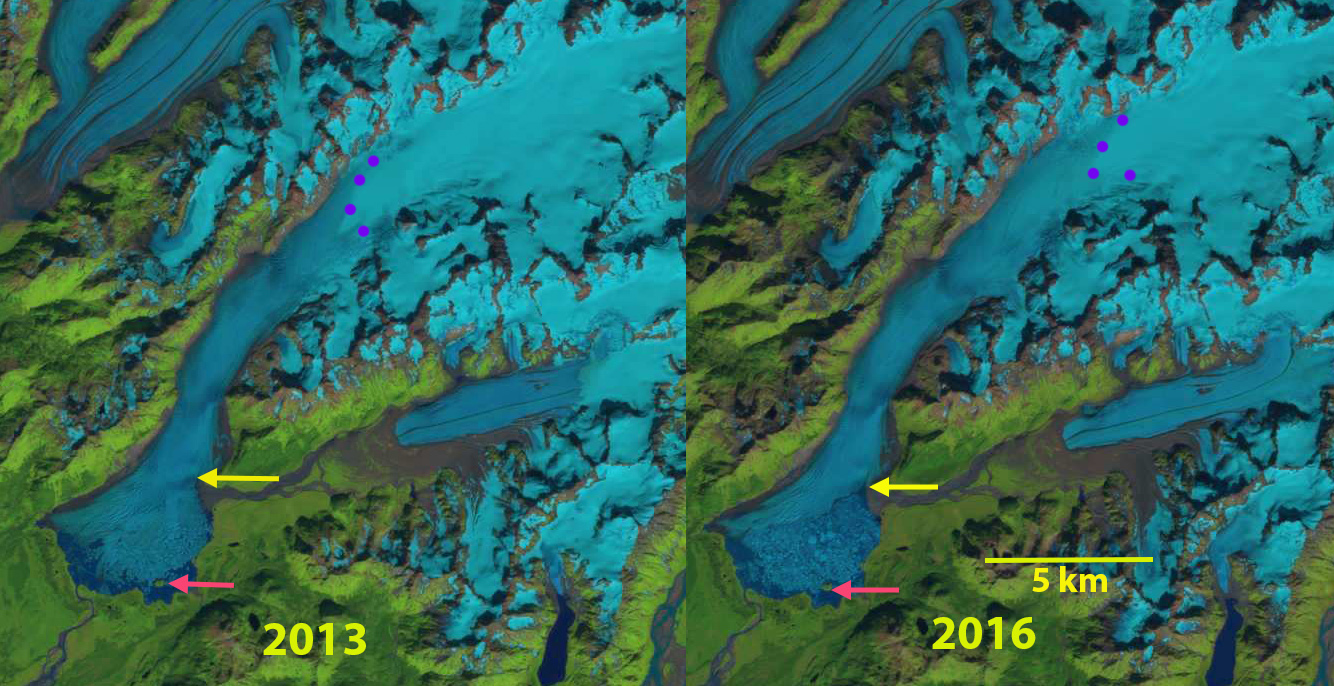
In 2002 the proglacial lake had an area of 3.8 km2, with the terminus crossing one small island in the lake. The snowline was at 750 m. In 2013 there is a 4 km2 terminus area that has disintegrated, the terminus has retreated off of the island. By 2016 the terminus has retreated north of the glacier stream from Sherman Glacier entering from the east, though much of the lake is still filled with an iceberg melange. The snowline is at 925 m. In 2020 the Sheridan Lake area has expanded to 11.2 km2, with the snowline at 970 m. In 2026 the lake has expanded to an area of 13.5 km2,.epresenting a retreat of 9.7 km2 since 2002. In 2026 the terminus tongue is not stable, unbuttressed on its lateral margins for 2 km, and retreat will continue.
Sheridan Glacier retreat and lake expansion 2002-2020. Snowline indicated by blue dots on these Landsat images.Sheridan Glacier retreat and lake expansion 2013-2016. Snowline indicated by blue dots on these Landsat images.
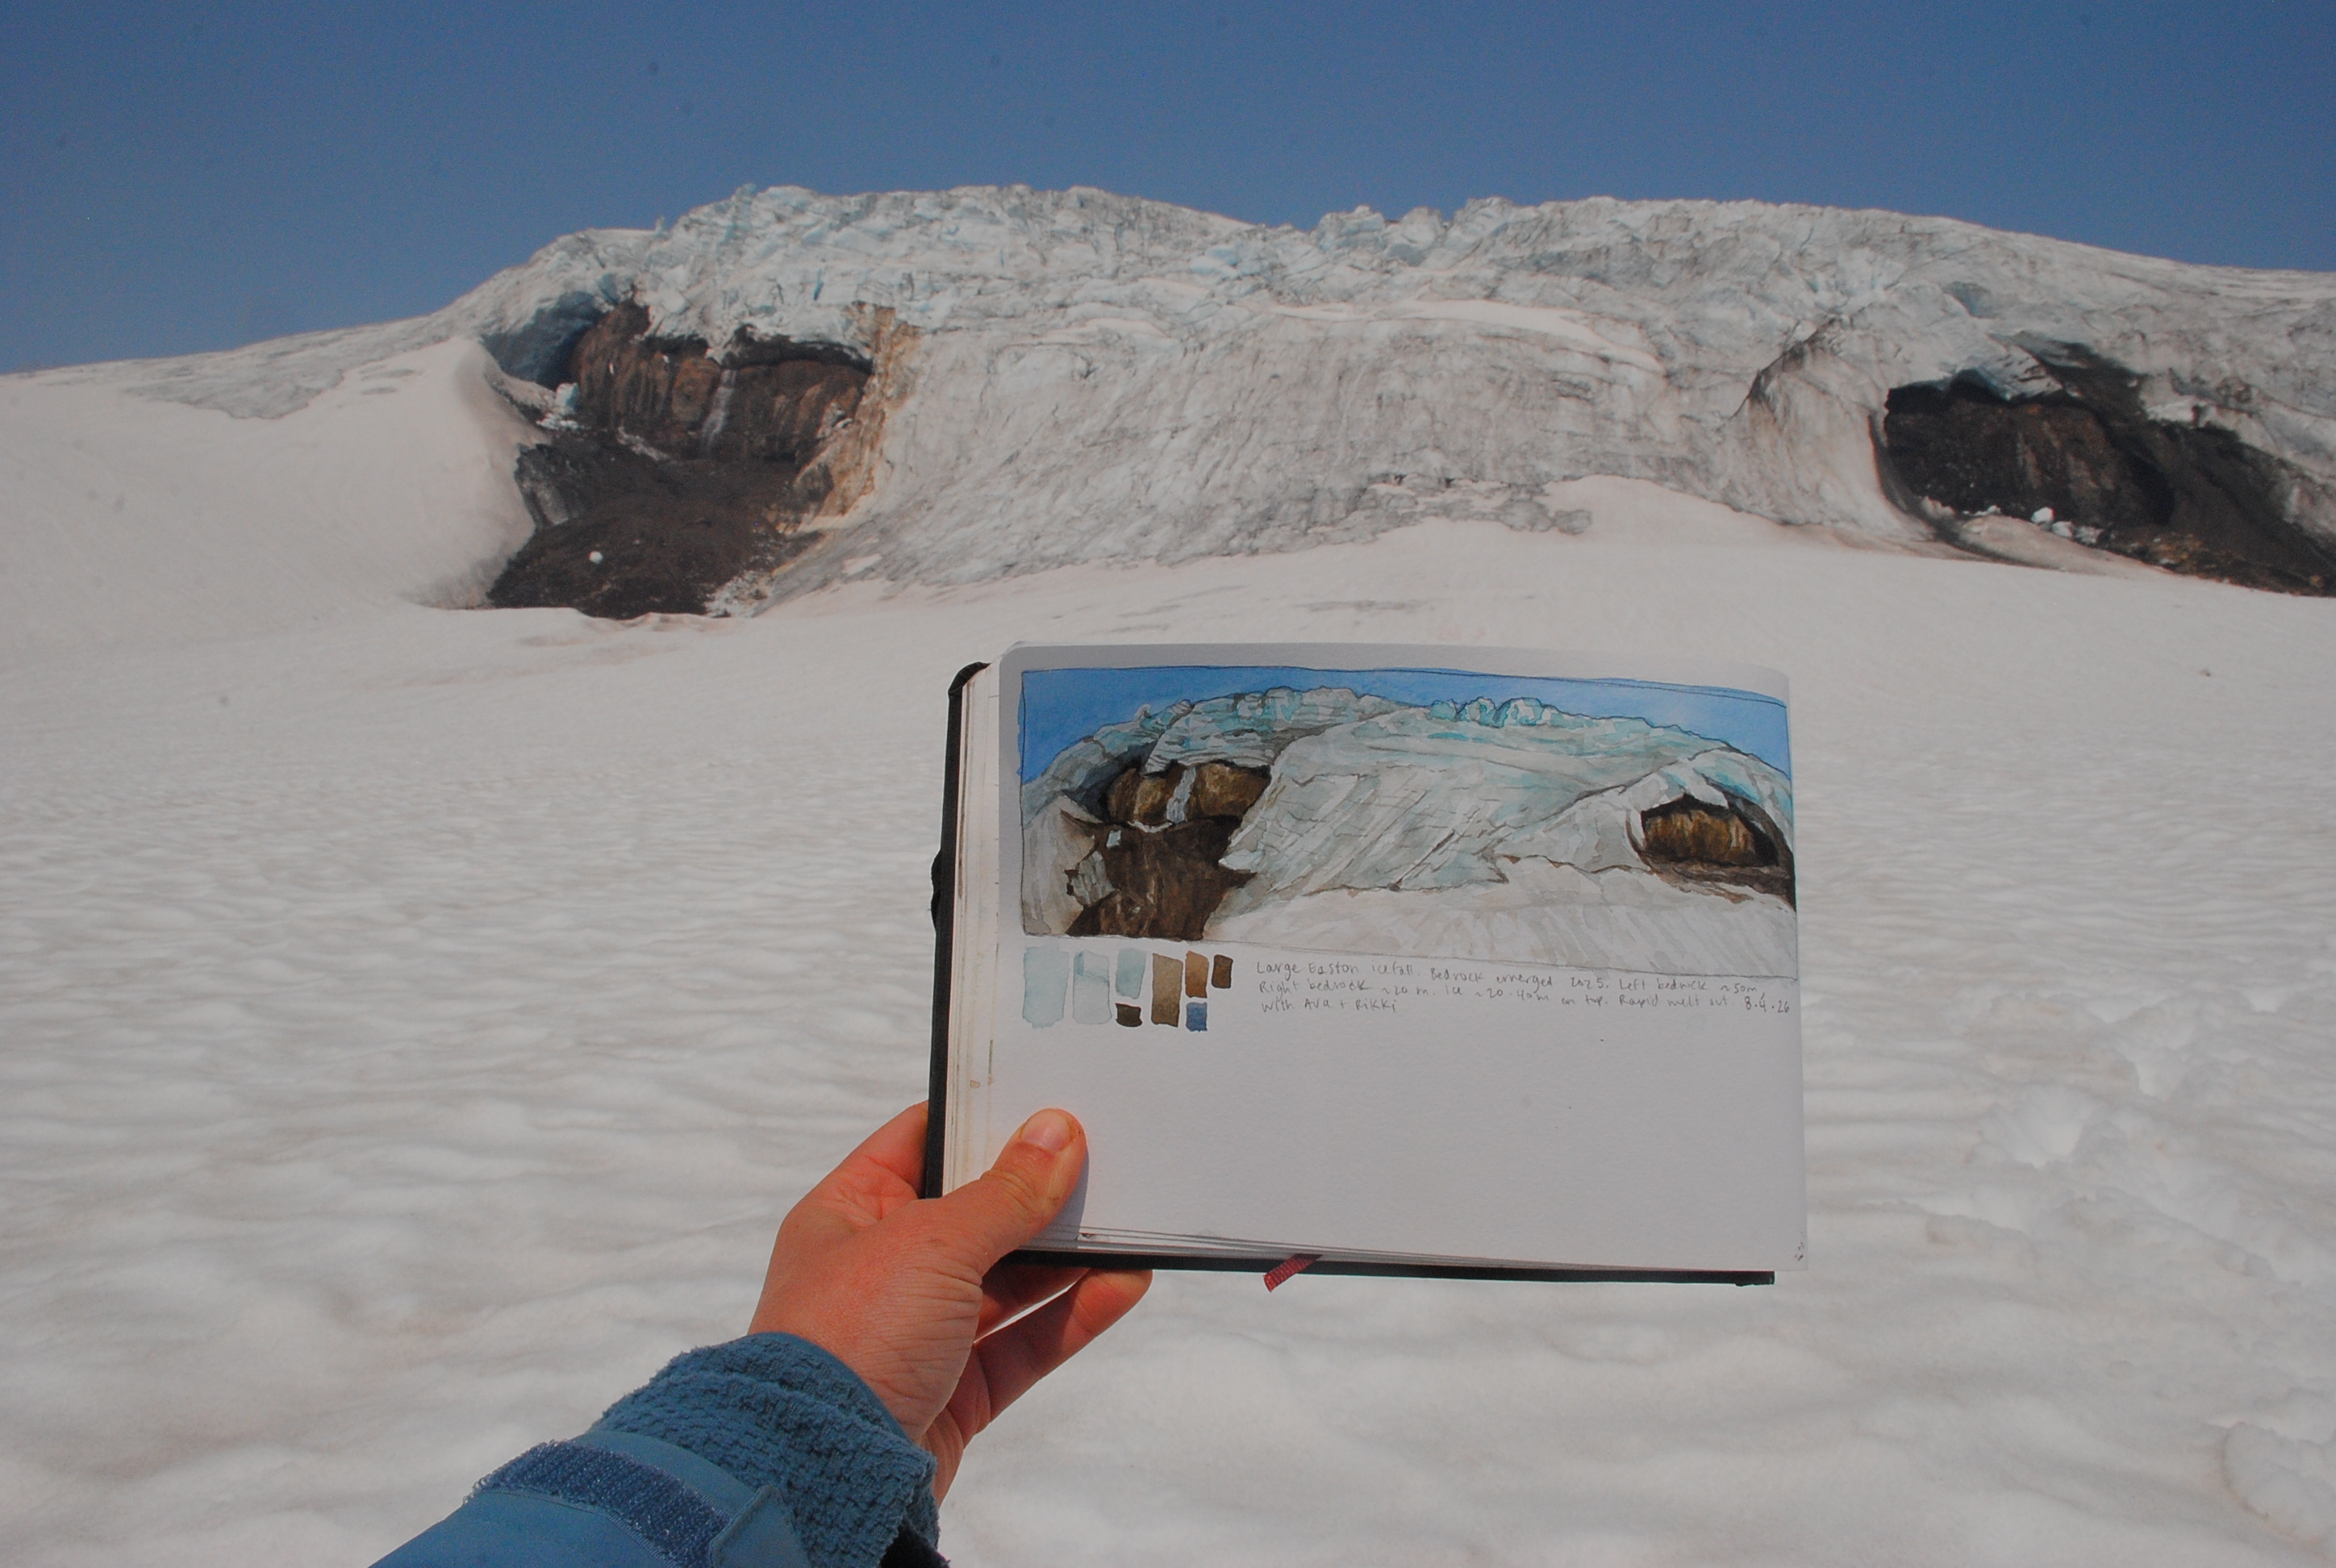
Jill Pelto: Field painting of new large bedrock exposures in the big icefall on Easton Glacier, Mt. Baker. The 2026 field season of the NCGCP brought dramatic changes. While we expected most of these, it doesn’t make them any easier to physically navigate or emotionally experience. Even at 9,000 ft, the glaciers of Mt. Baker are thinning, with new bedrock emerging. Above about 7,000 ft, the snowpack was decent, which will slightly help to mitigate the losses from lack of snowpack at lower elevations. The atmospheric river carved a story across our field sites. From this big shift in snowpack up high, to washed out roads, and altered riverbeds. It was a year of fascinating, sad, and occasionally hopeful shifts.
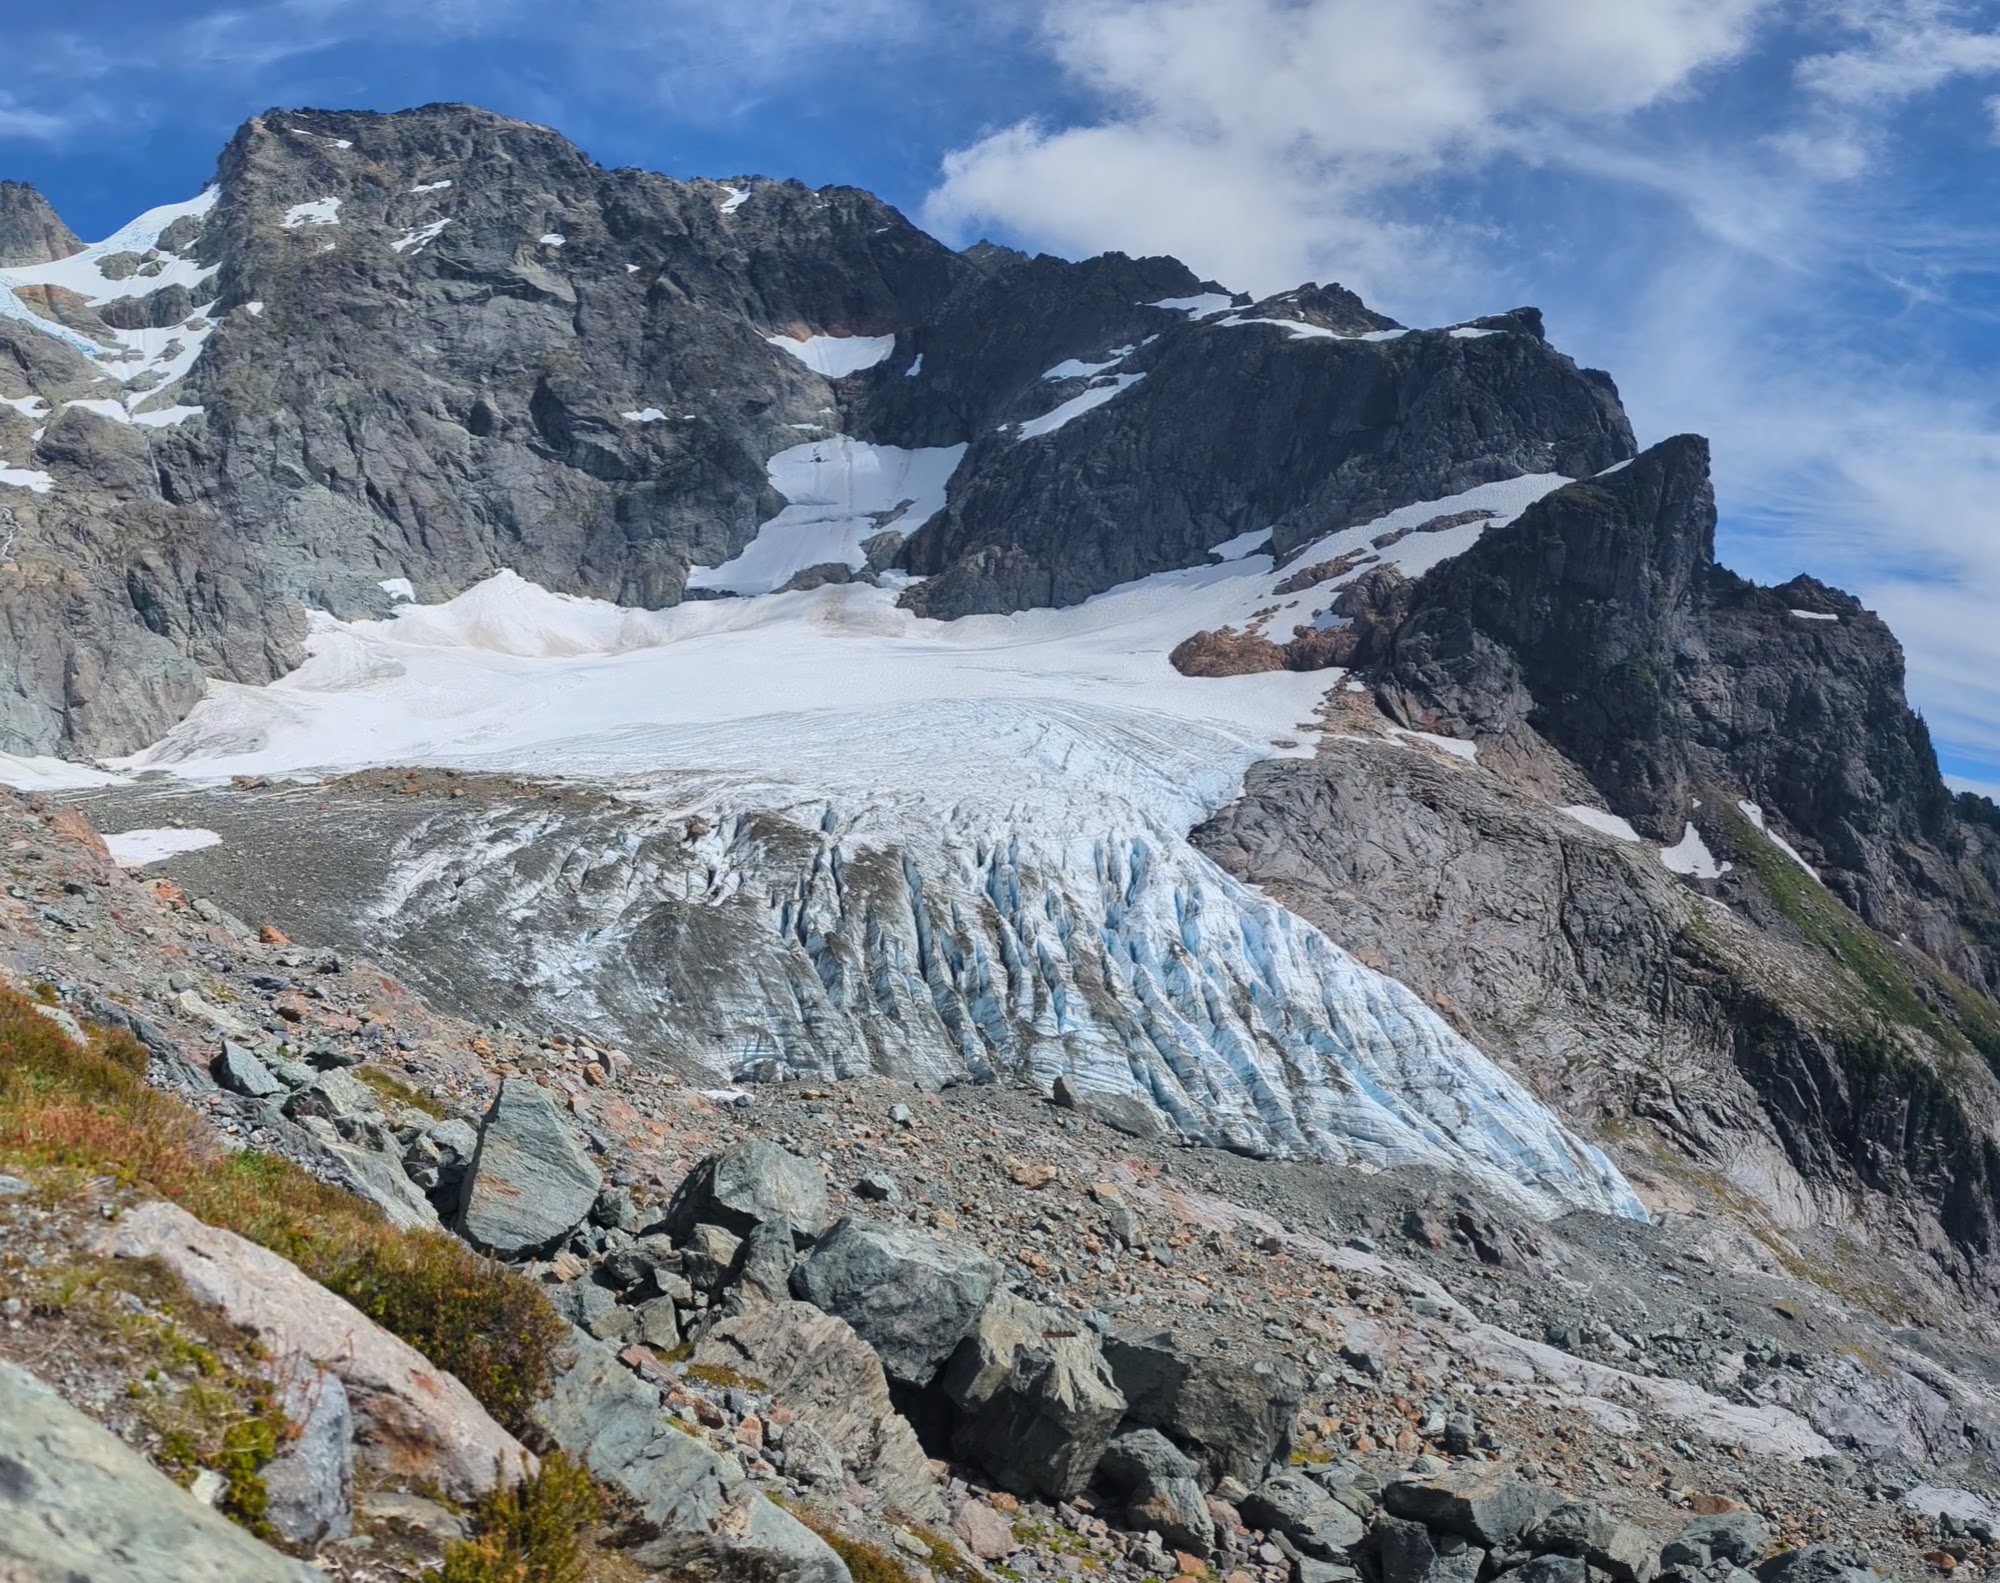
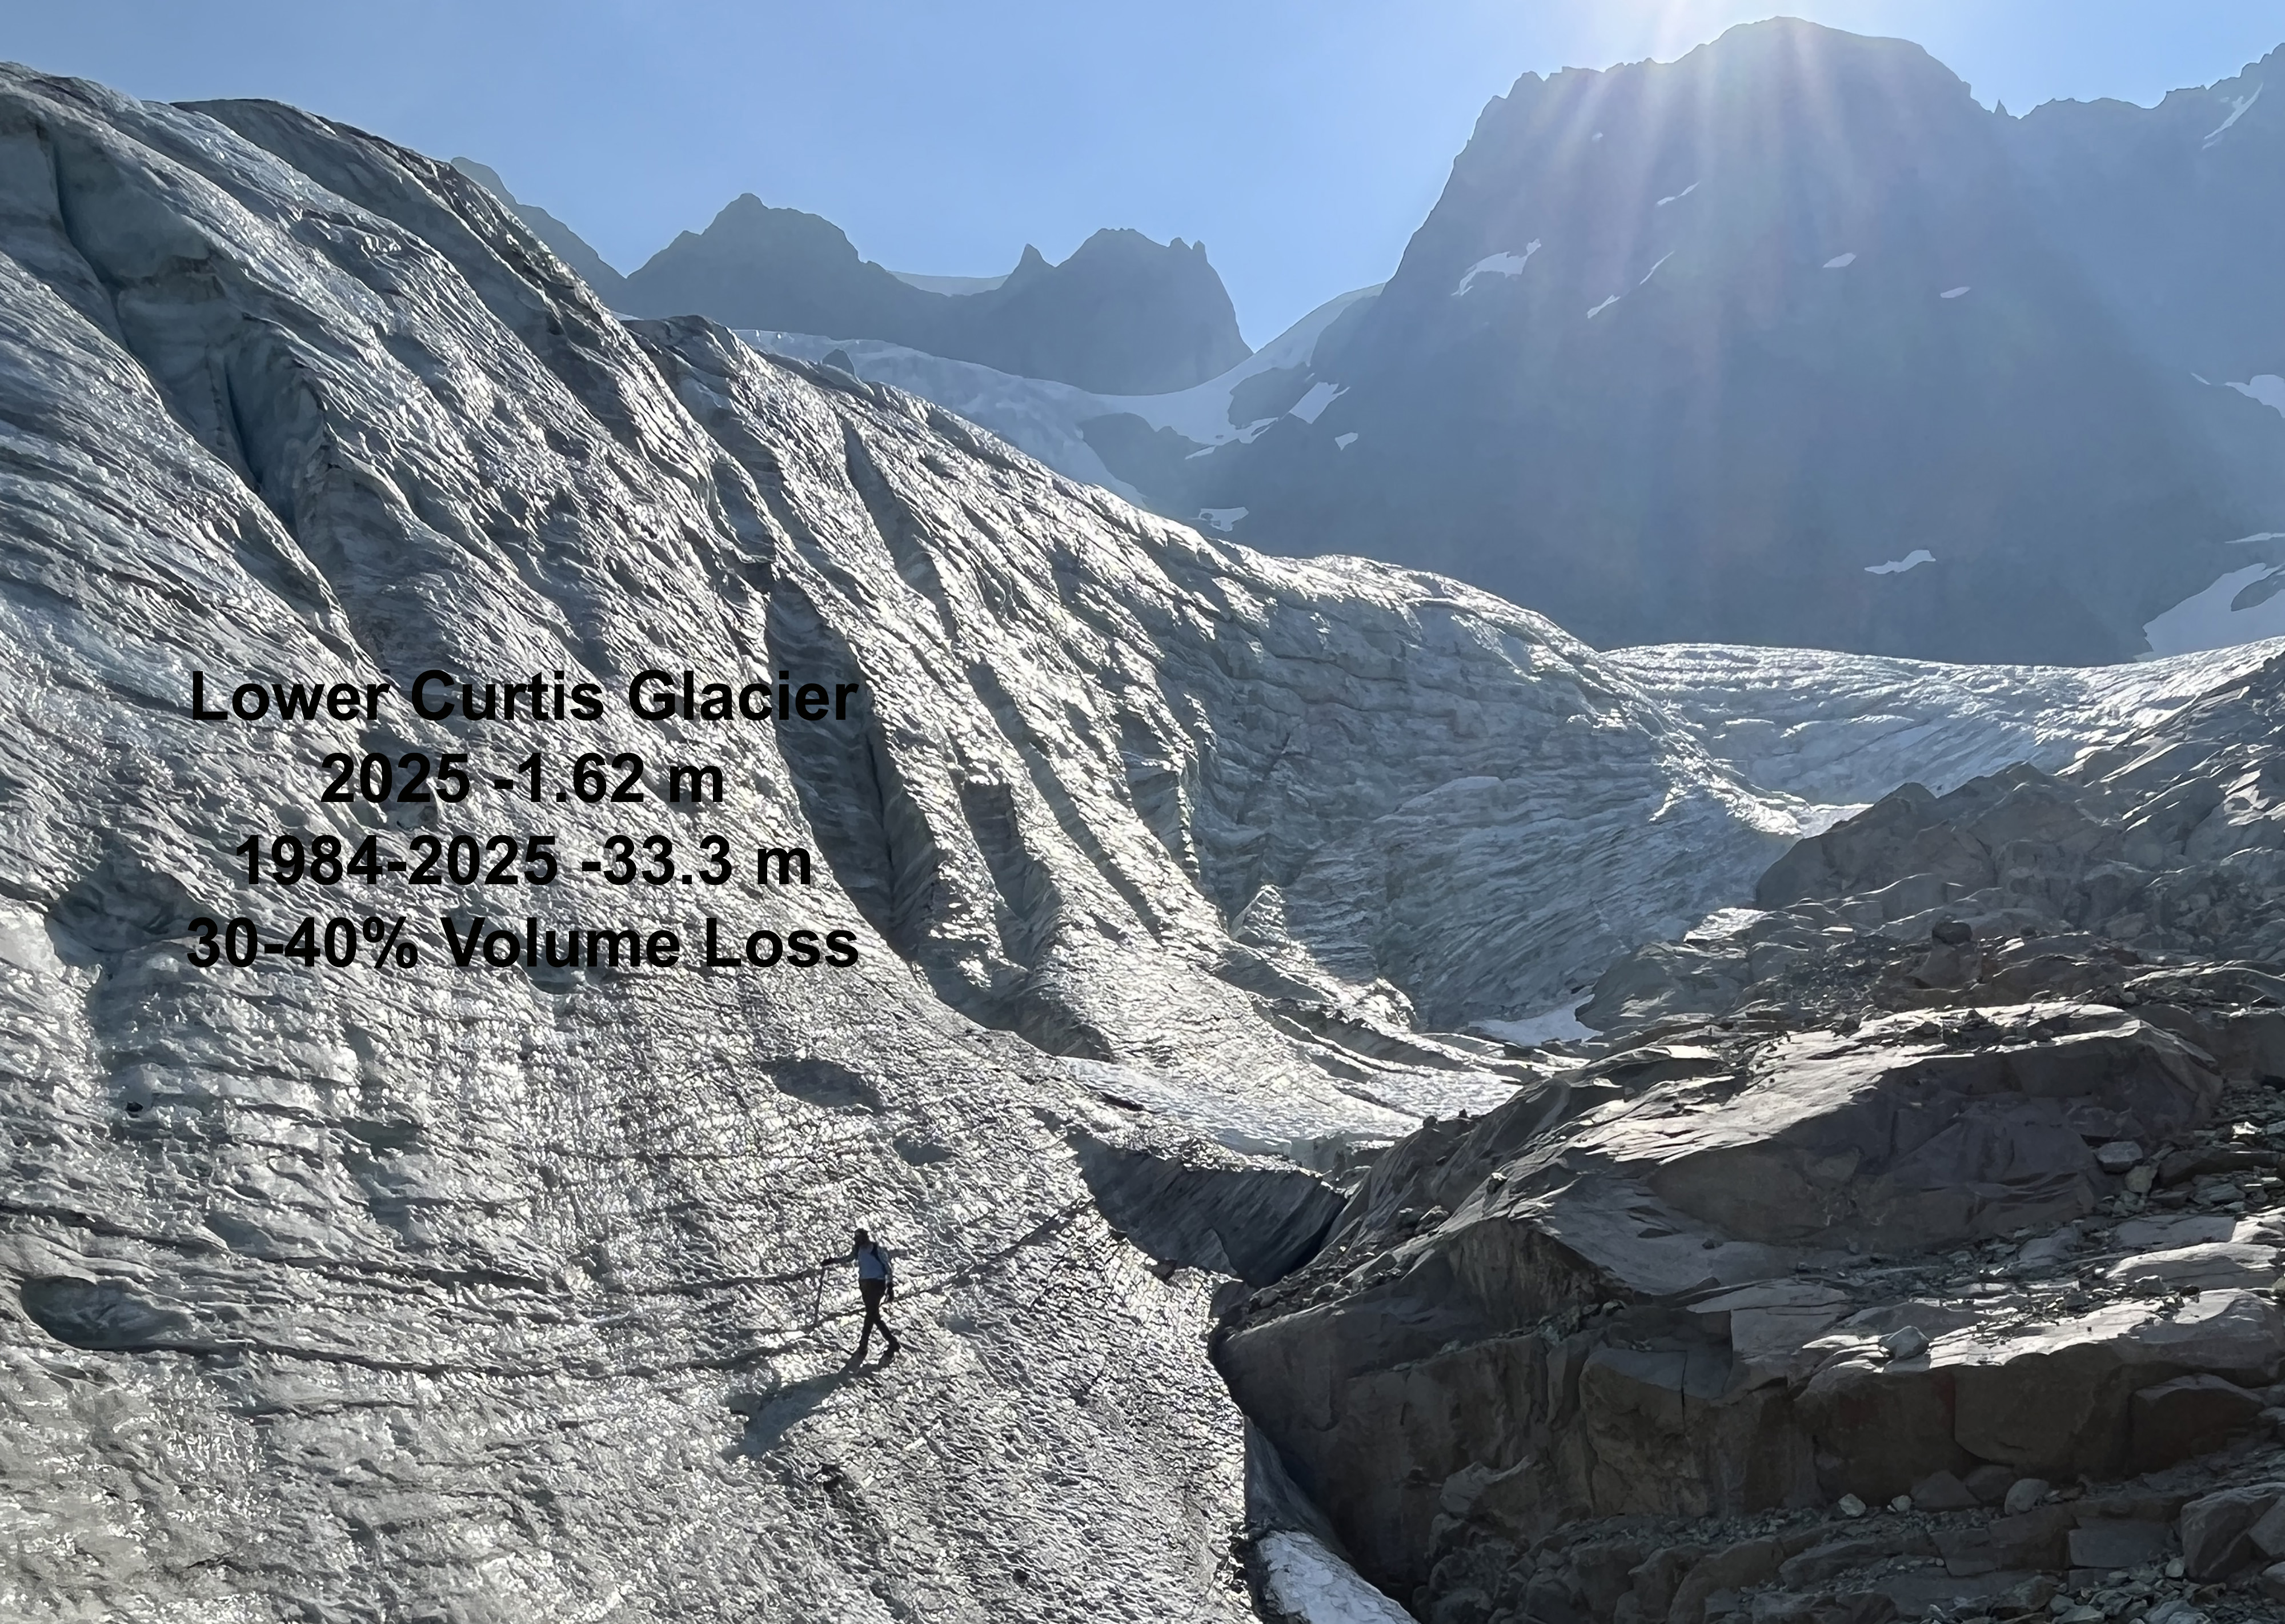
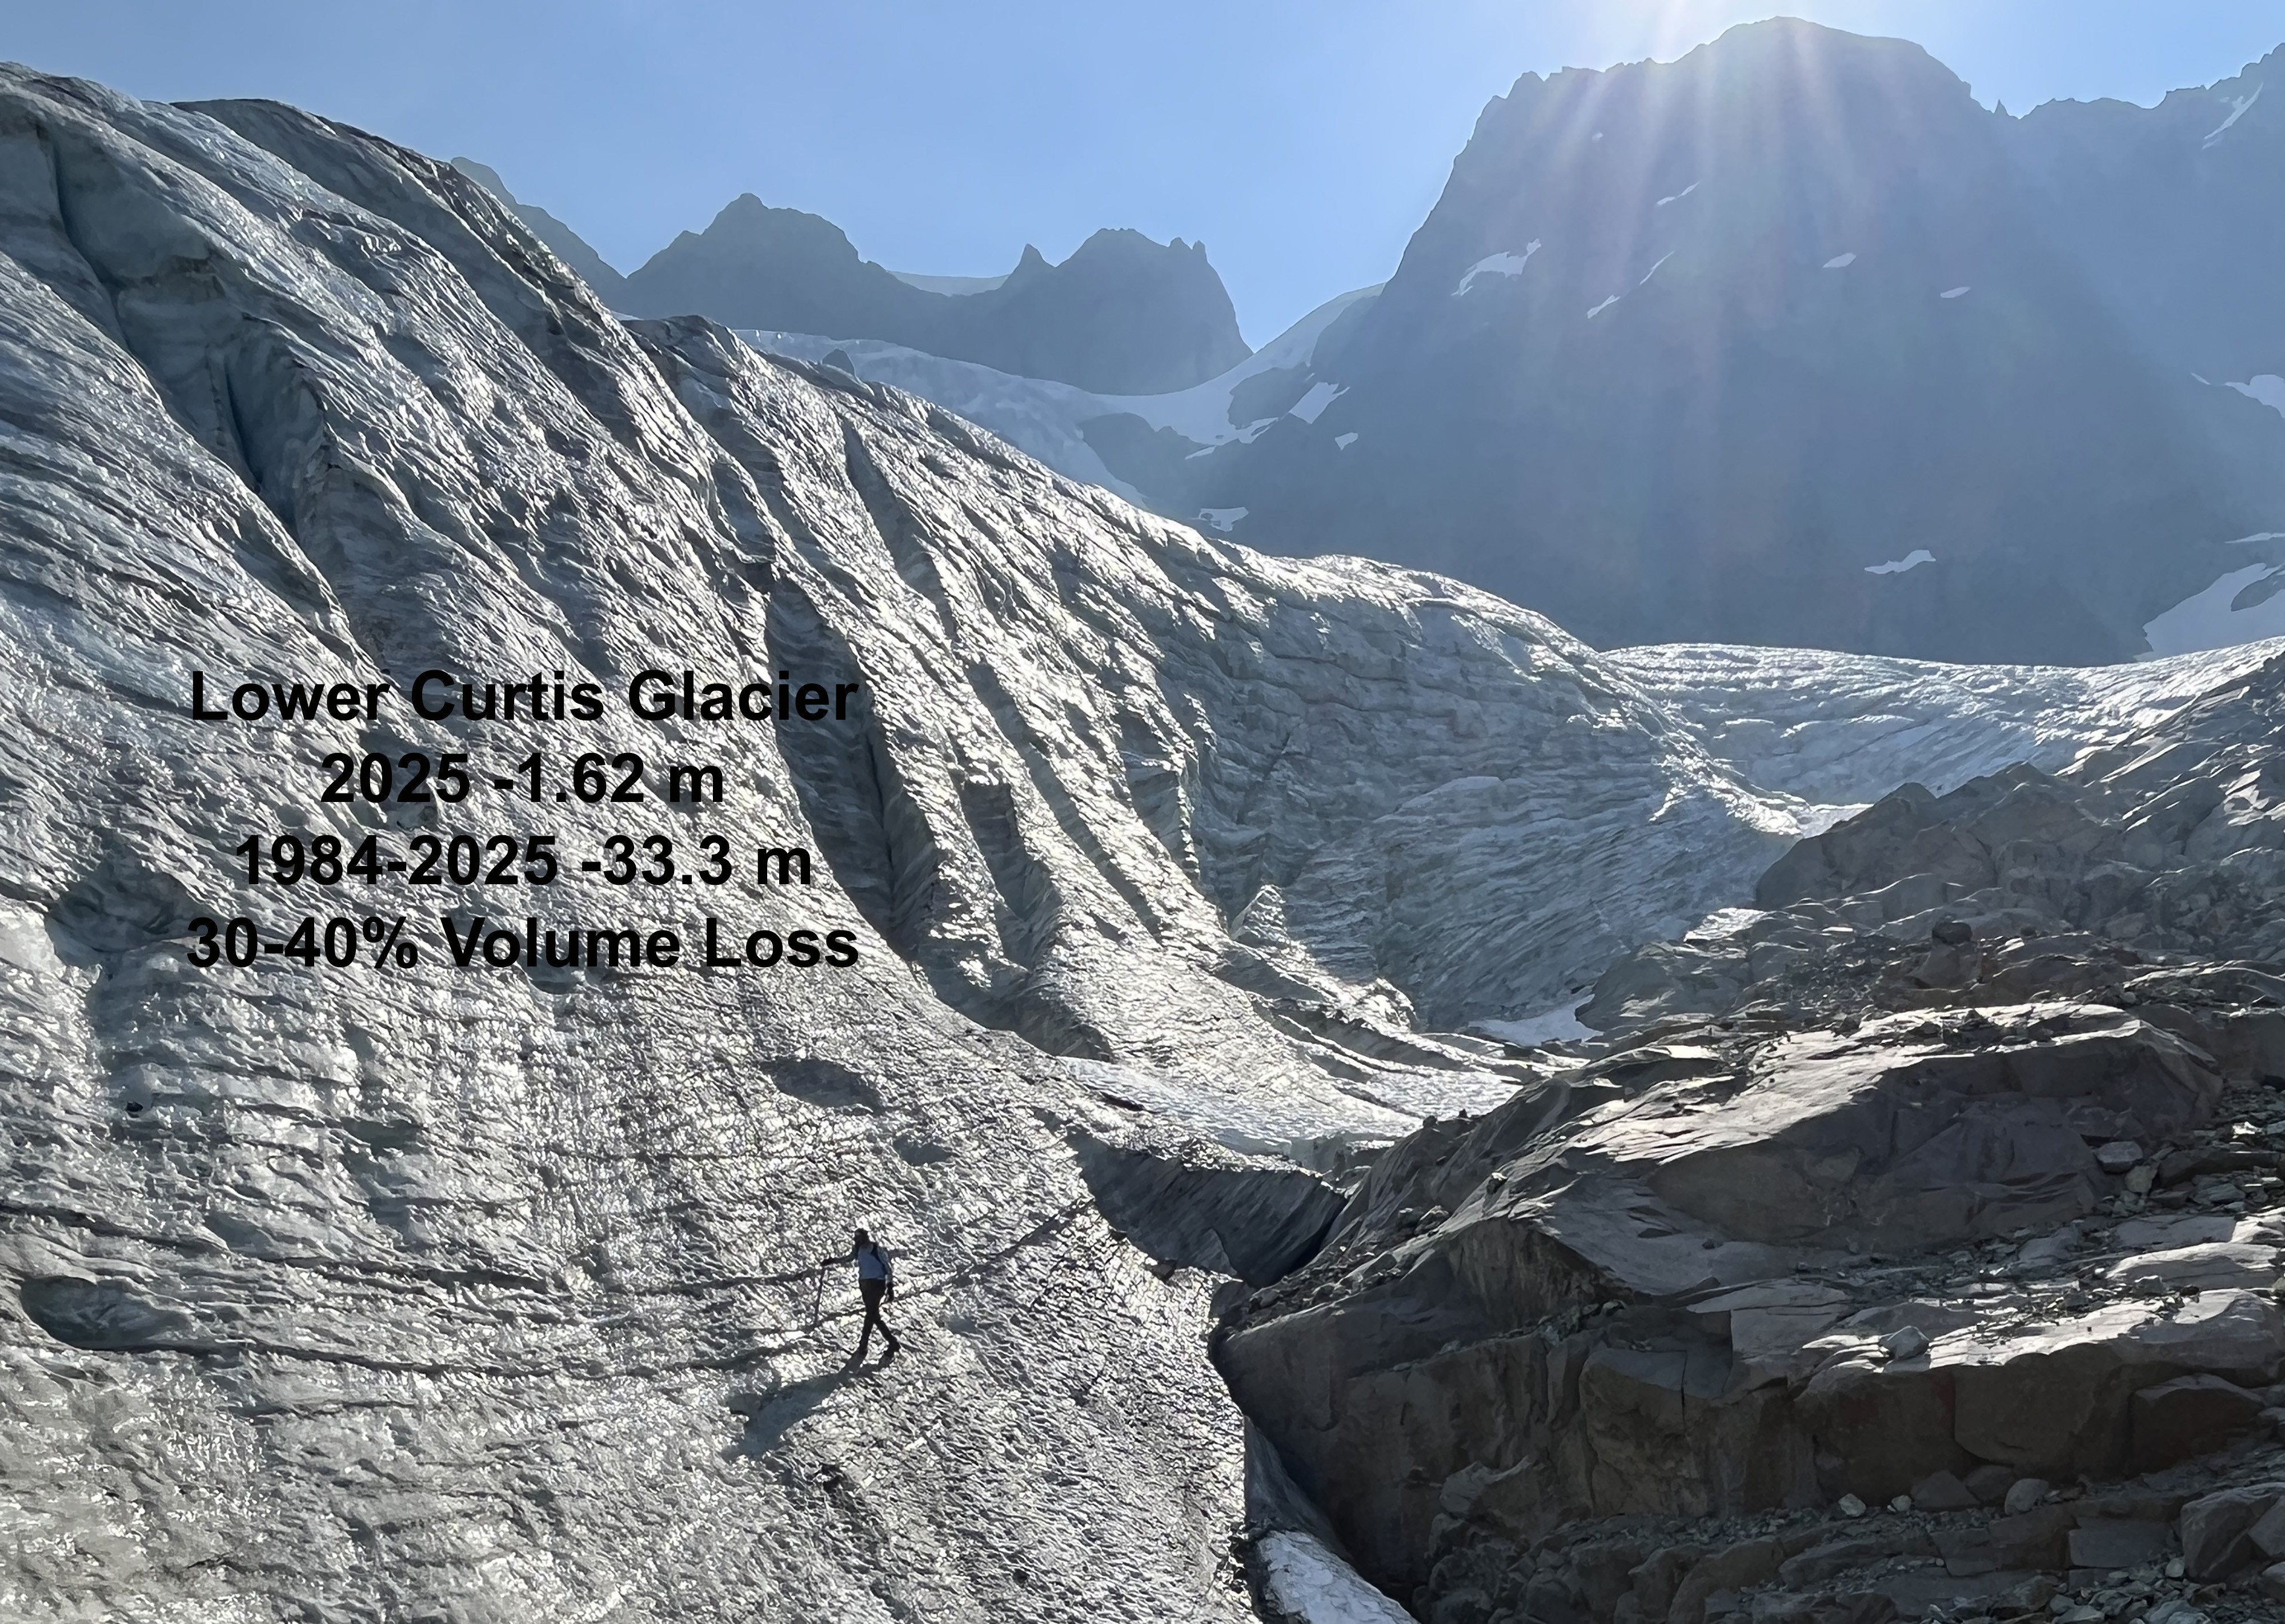
Abby Connor: Looking down at the terminus of the Lower Curtis Glacier on Mt. Shuksan, noticeably thinner than when I last visited. I grew up in Bothell, in a family that spends its weekends outdoors, assuming that massive and seemingly unchanging glaciers are a fact of life. But as we approached our first field site on the Lower Curtis Glacier on Mt. Shuksan, I struggled to reconcile the view of the noticeably less massive terminus of the glacier with my memory from my last visit eight years ago. When we reached our break spot and looked far down at the glacier, Mauri described the wall that would have towered 100 feet over where we sat, before the glacier had lost its impressive thickness. Throughout the 2026 field season, I was continually awed with the scale of the glaciers we still have in the North Cascades while surrounded by reminders of how quickly they’re disappearing, fast enough that we are on track to lose almost all of our glaciers in the state within my lifetime. In Western Washington, a place defined by the mountains and Sound, glaciers are the link between the two. They are no longer an unchanging fact of life.
Ava Reynolds:Pink monkey flower and fireweed bloom in the rocky moraine of the Columbia Glacier – one of the glaciers in the 2026 field season that looked the most impacted by warm temperatures and a reduced snowpack, with avalanche bands that feed the glacier now shutoff, rockfall evident across the entire glacier, and a growing lake of floating ice at the terminus.This field season was visually striking, highlighting the impact of our warming climate on the glaciers and surrounding ecosystem. Flowers were blooming weeks ahead of schedule, sections of new bedrock were exposed, wildfires dotted the horizon at every field site, and residual evidence from the December 2025 storm system was prevalent in downed trees and washed out riverbeds.
Shaina Dotson:Amidst the icefall of Easton Glacier. Joining the NCGCP this field season was equal parts breathtaking and sobering. Each glacier was stunning and wholly its own — ancient and irreplaceable — yet we were immersed in the evidence of a warming planet. Wildfire plumes lined the horizon, ice thinned and retreated where it once held firm, and every day I found myself torn between the beauty of this world and its unraveling.
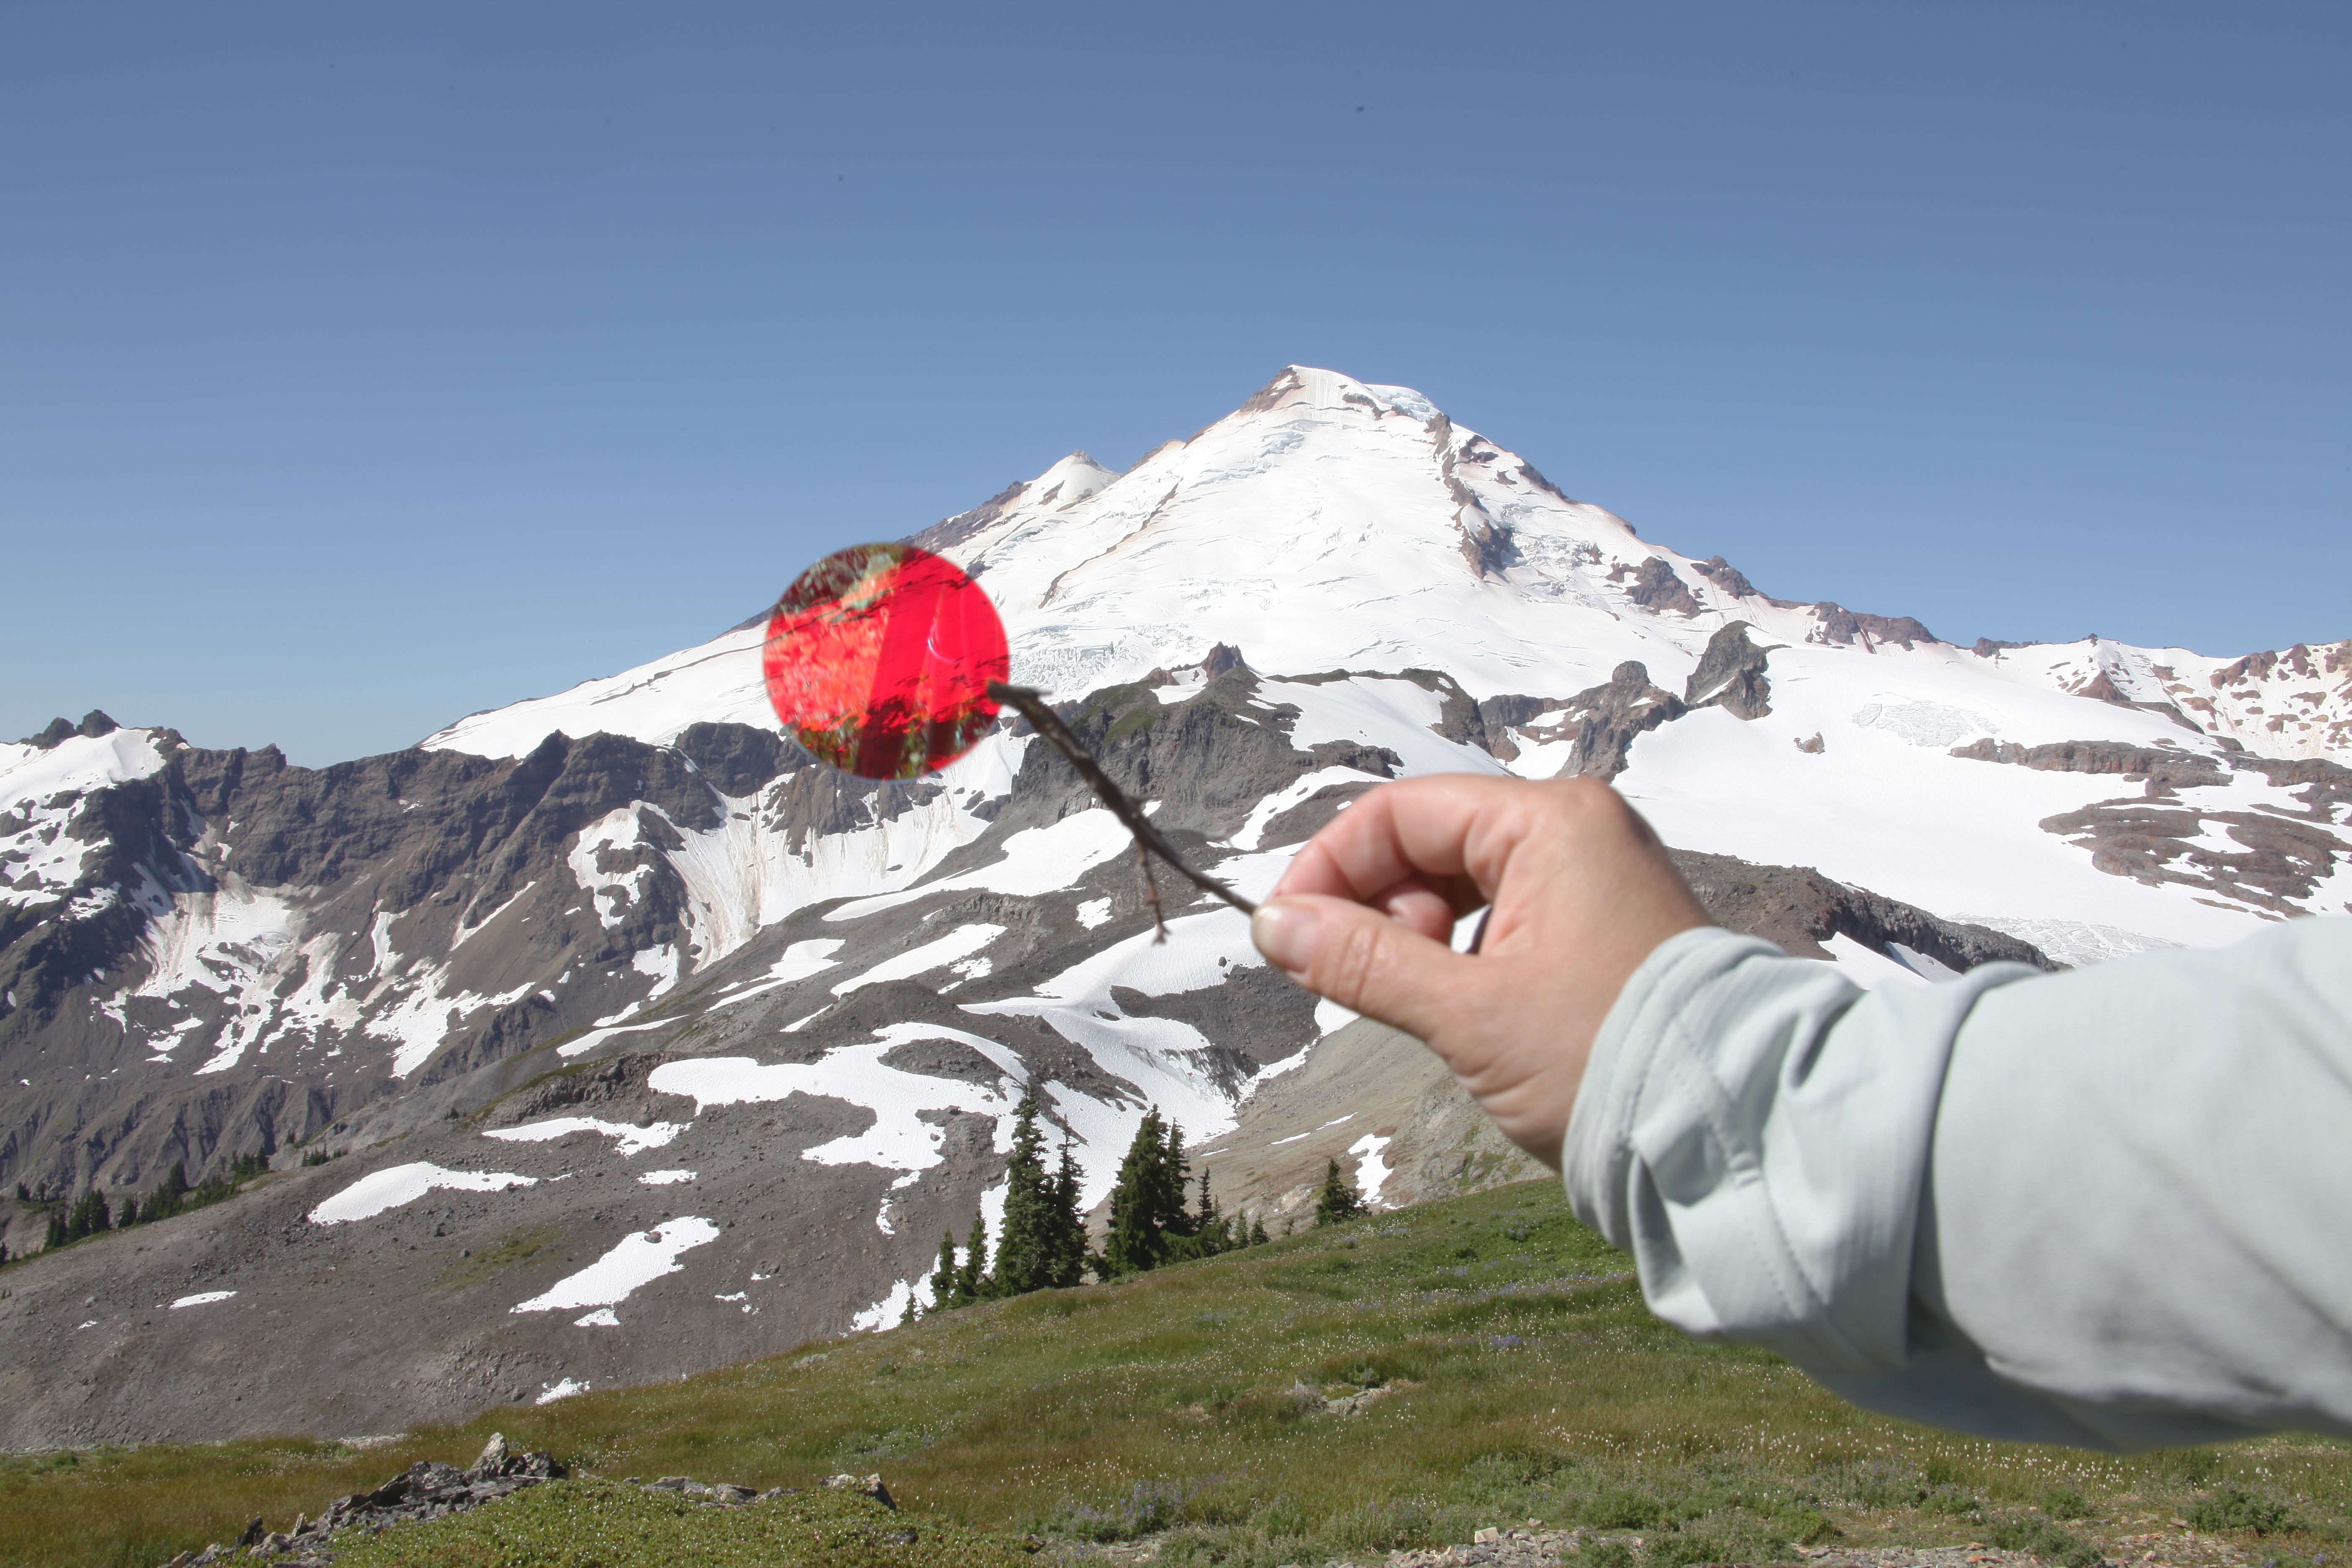
Danielle Schlunegger-Warner: Red Lens over Rainbow Glacier with Ice Alge sampled from Rainbow Glacier in the microscope. As an artist invited out to attend the 43rd field season with NCCGP, I spent my time in immersed with looking and observing. My attention drew not just to the fantastical forms of the ice on the glaciers, but the way they change the landscape around them. I saw ice algae and tiny black worms dotting the ice and snow, listened to the life bubbling up in the streams at their edges.The focus shifted between the expansive ancient glaciers, microorganisms, and the yearly changes diligently measured by the NCCGP with somber results. This experience illuminated for me not just that these glaciers the heartbeat of the North Cascades, but that their impact ripples out into our own lives in ways that are worth paying more attention to.
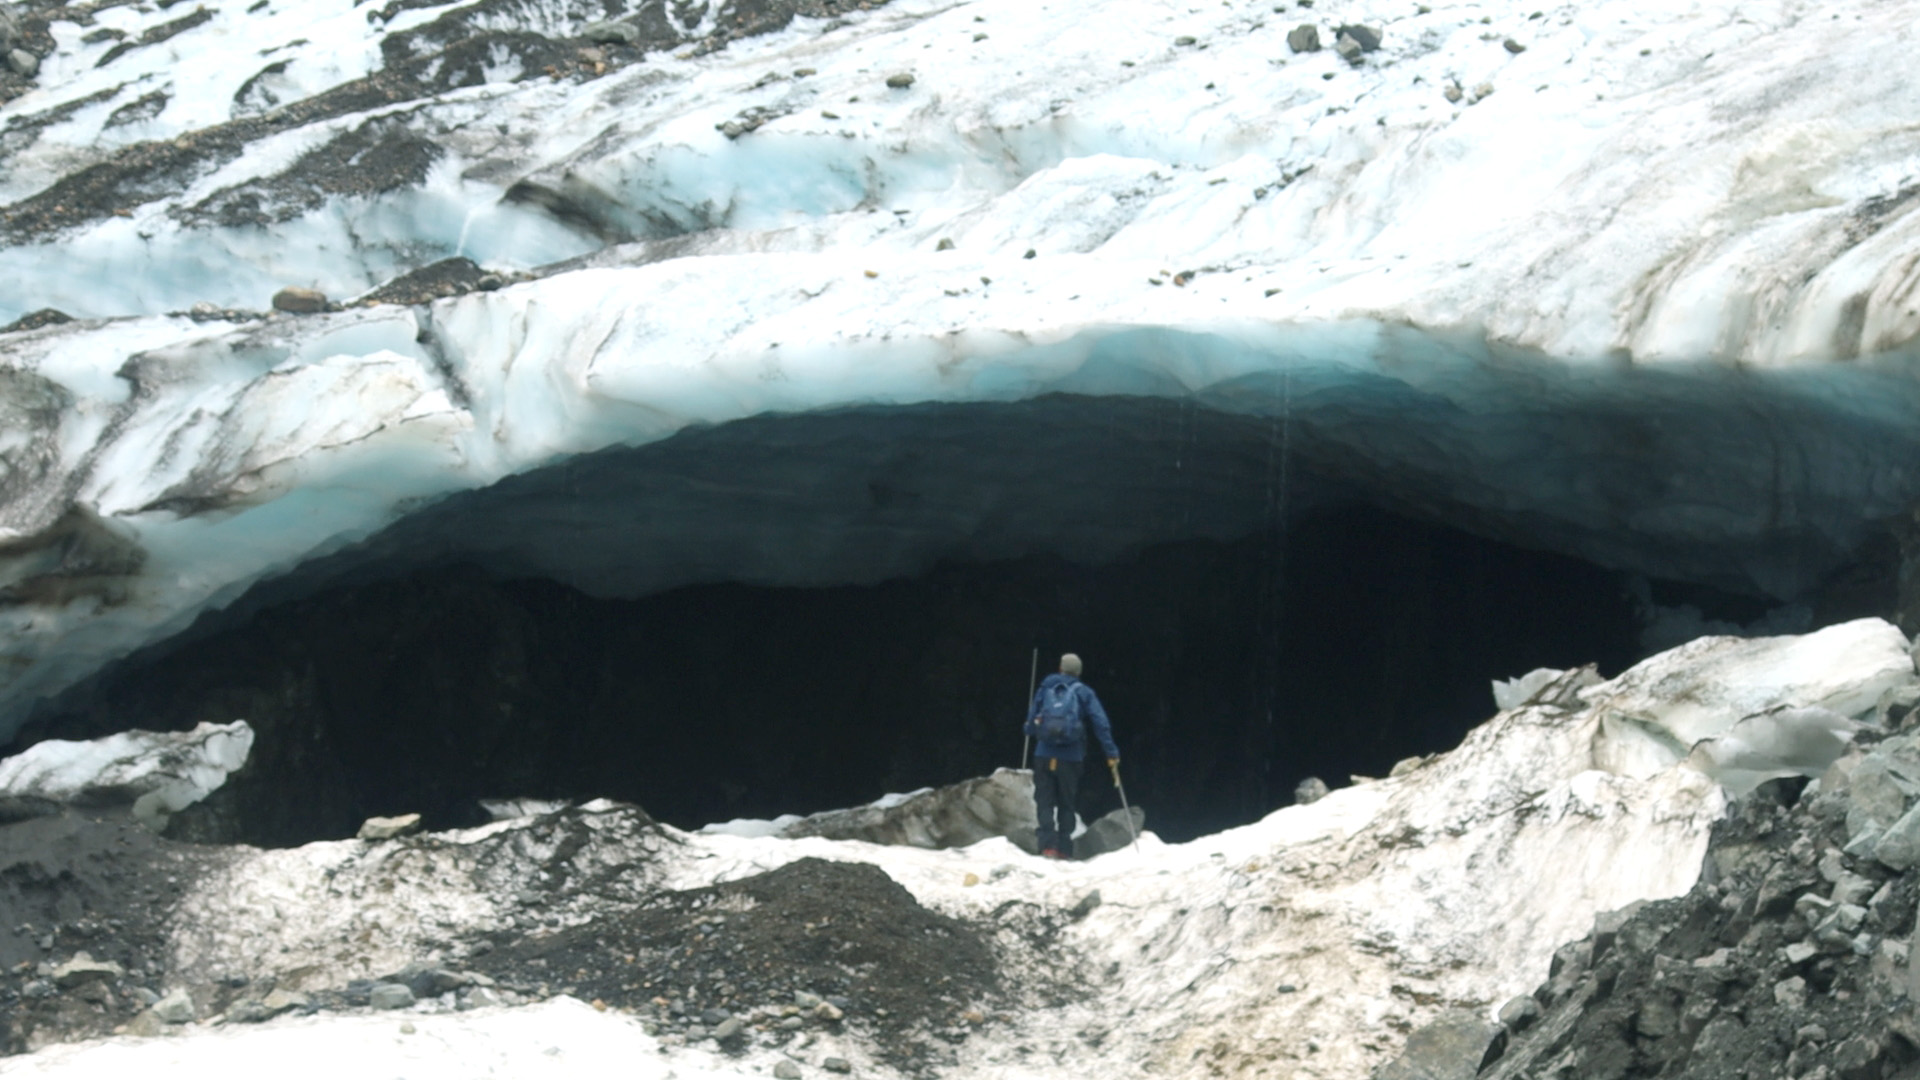
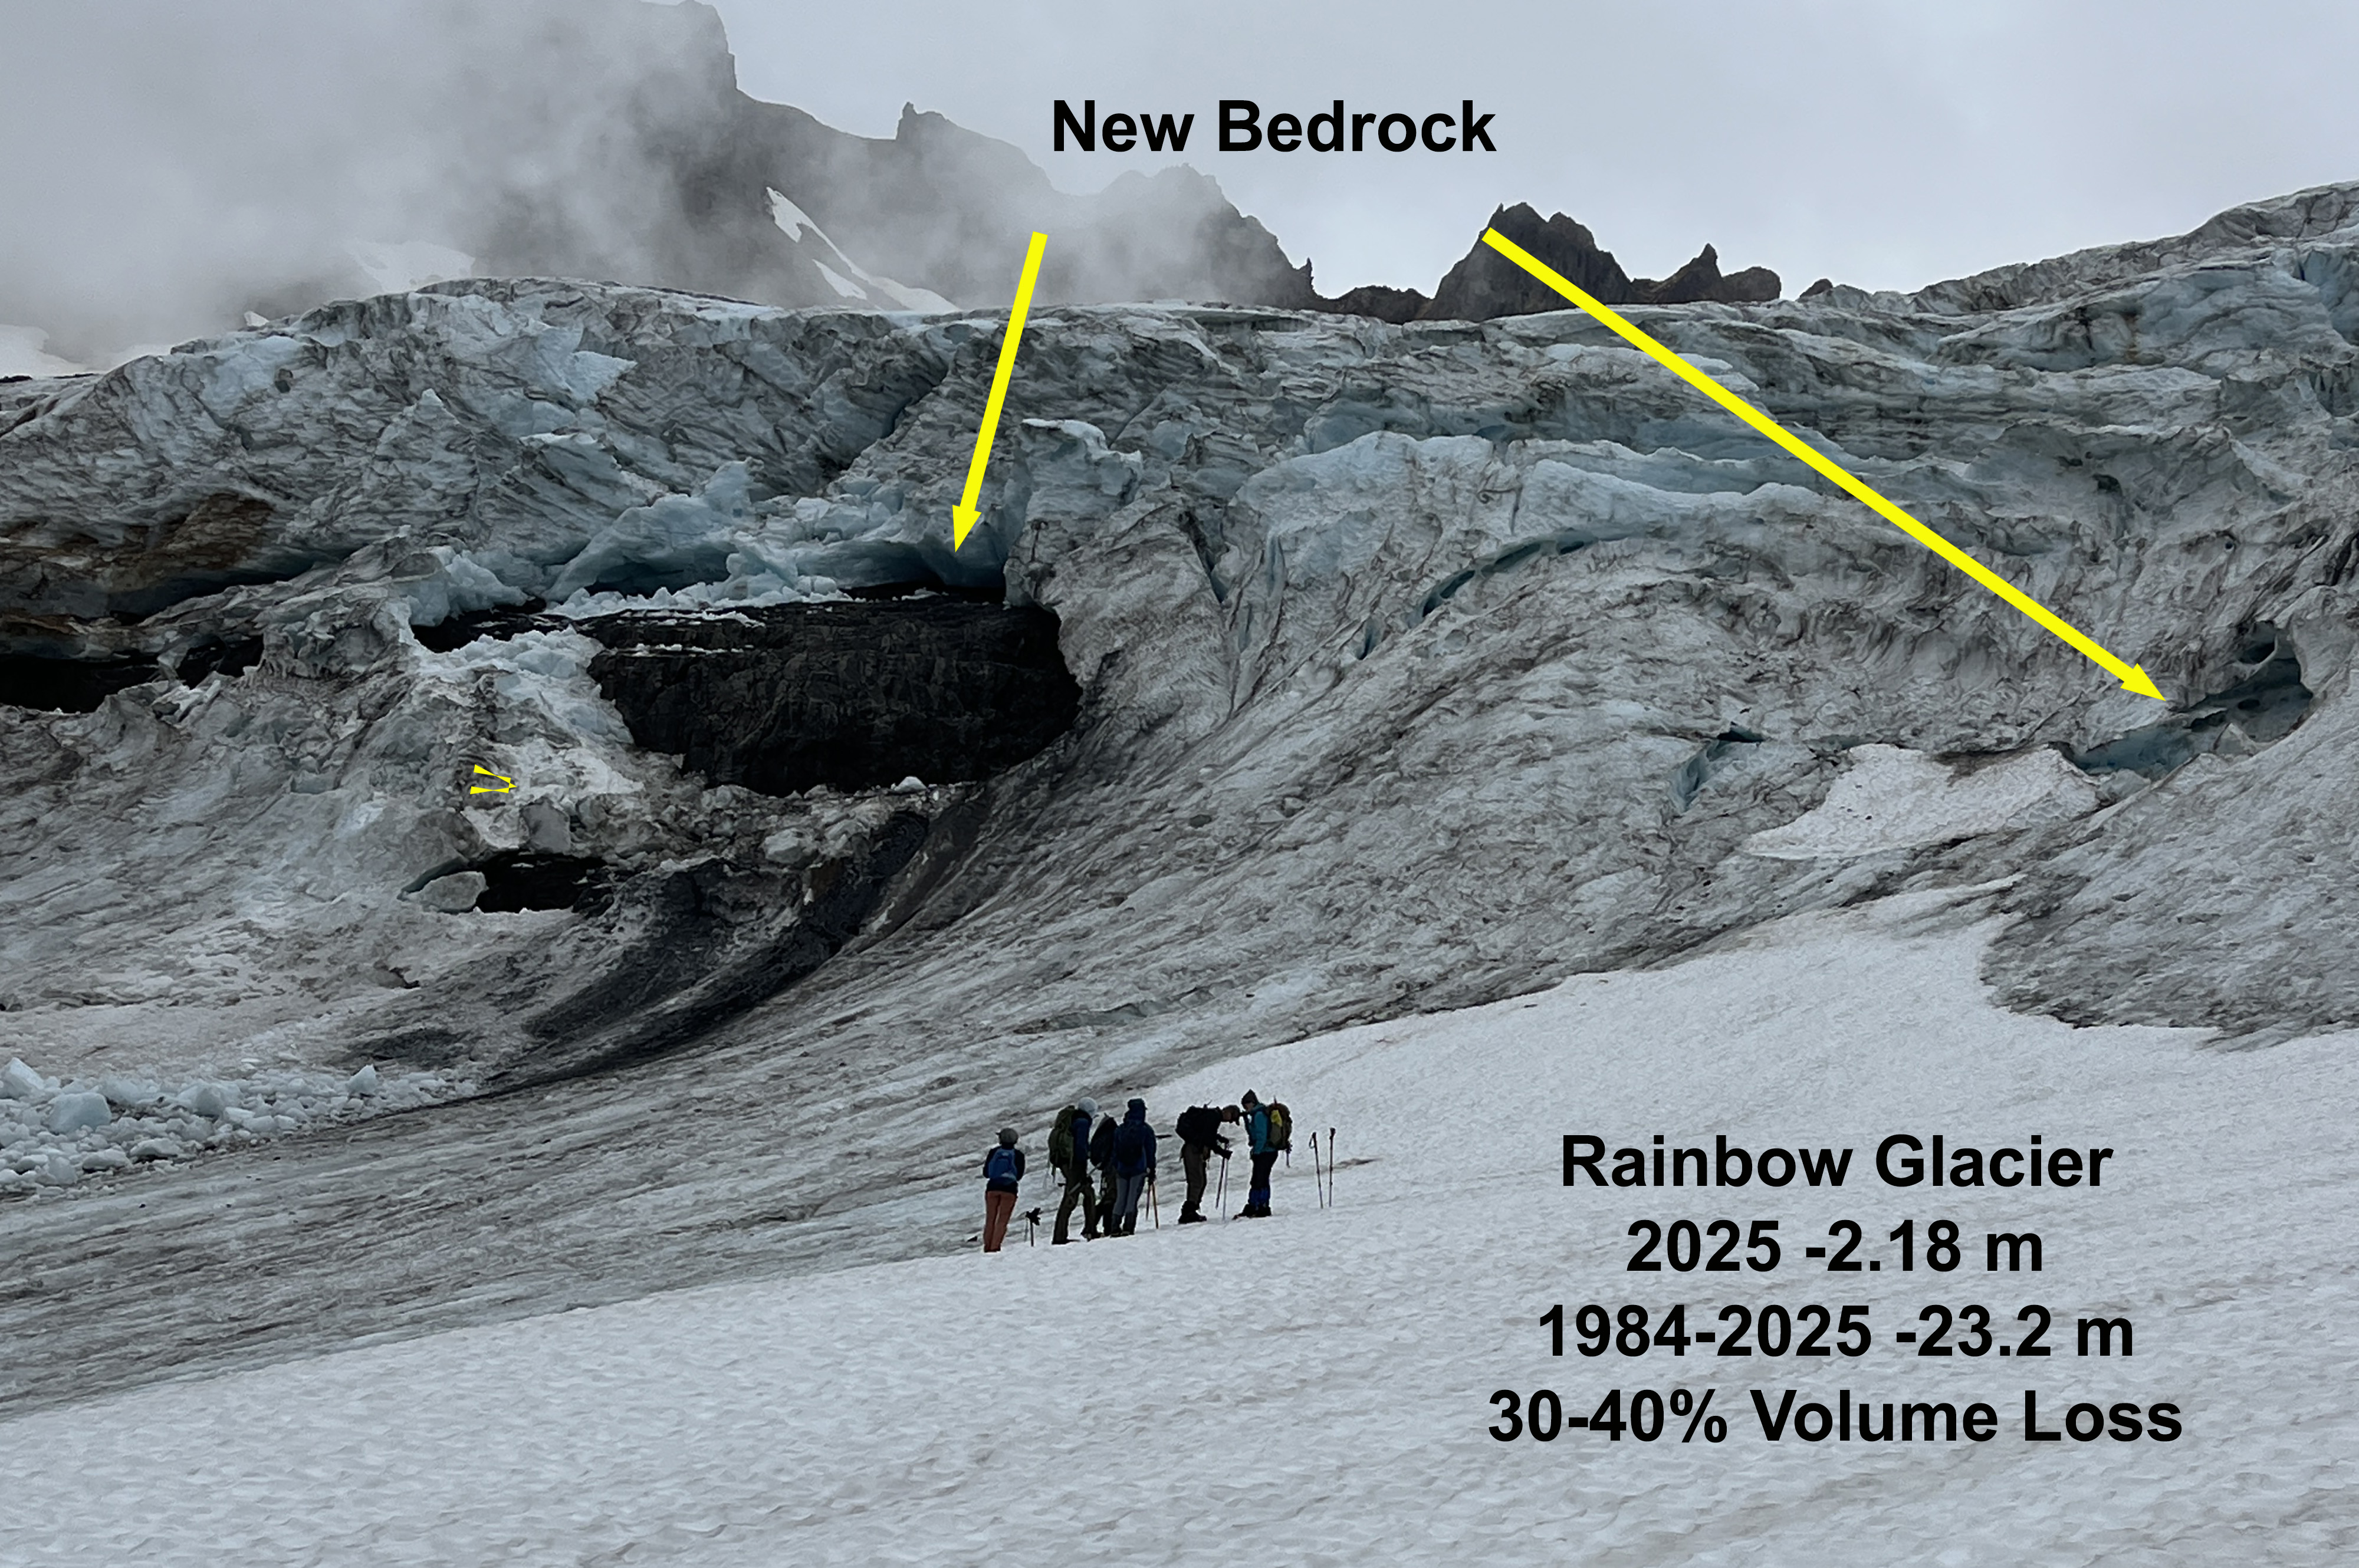
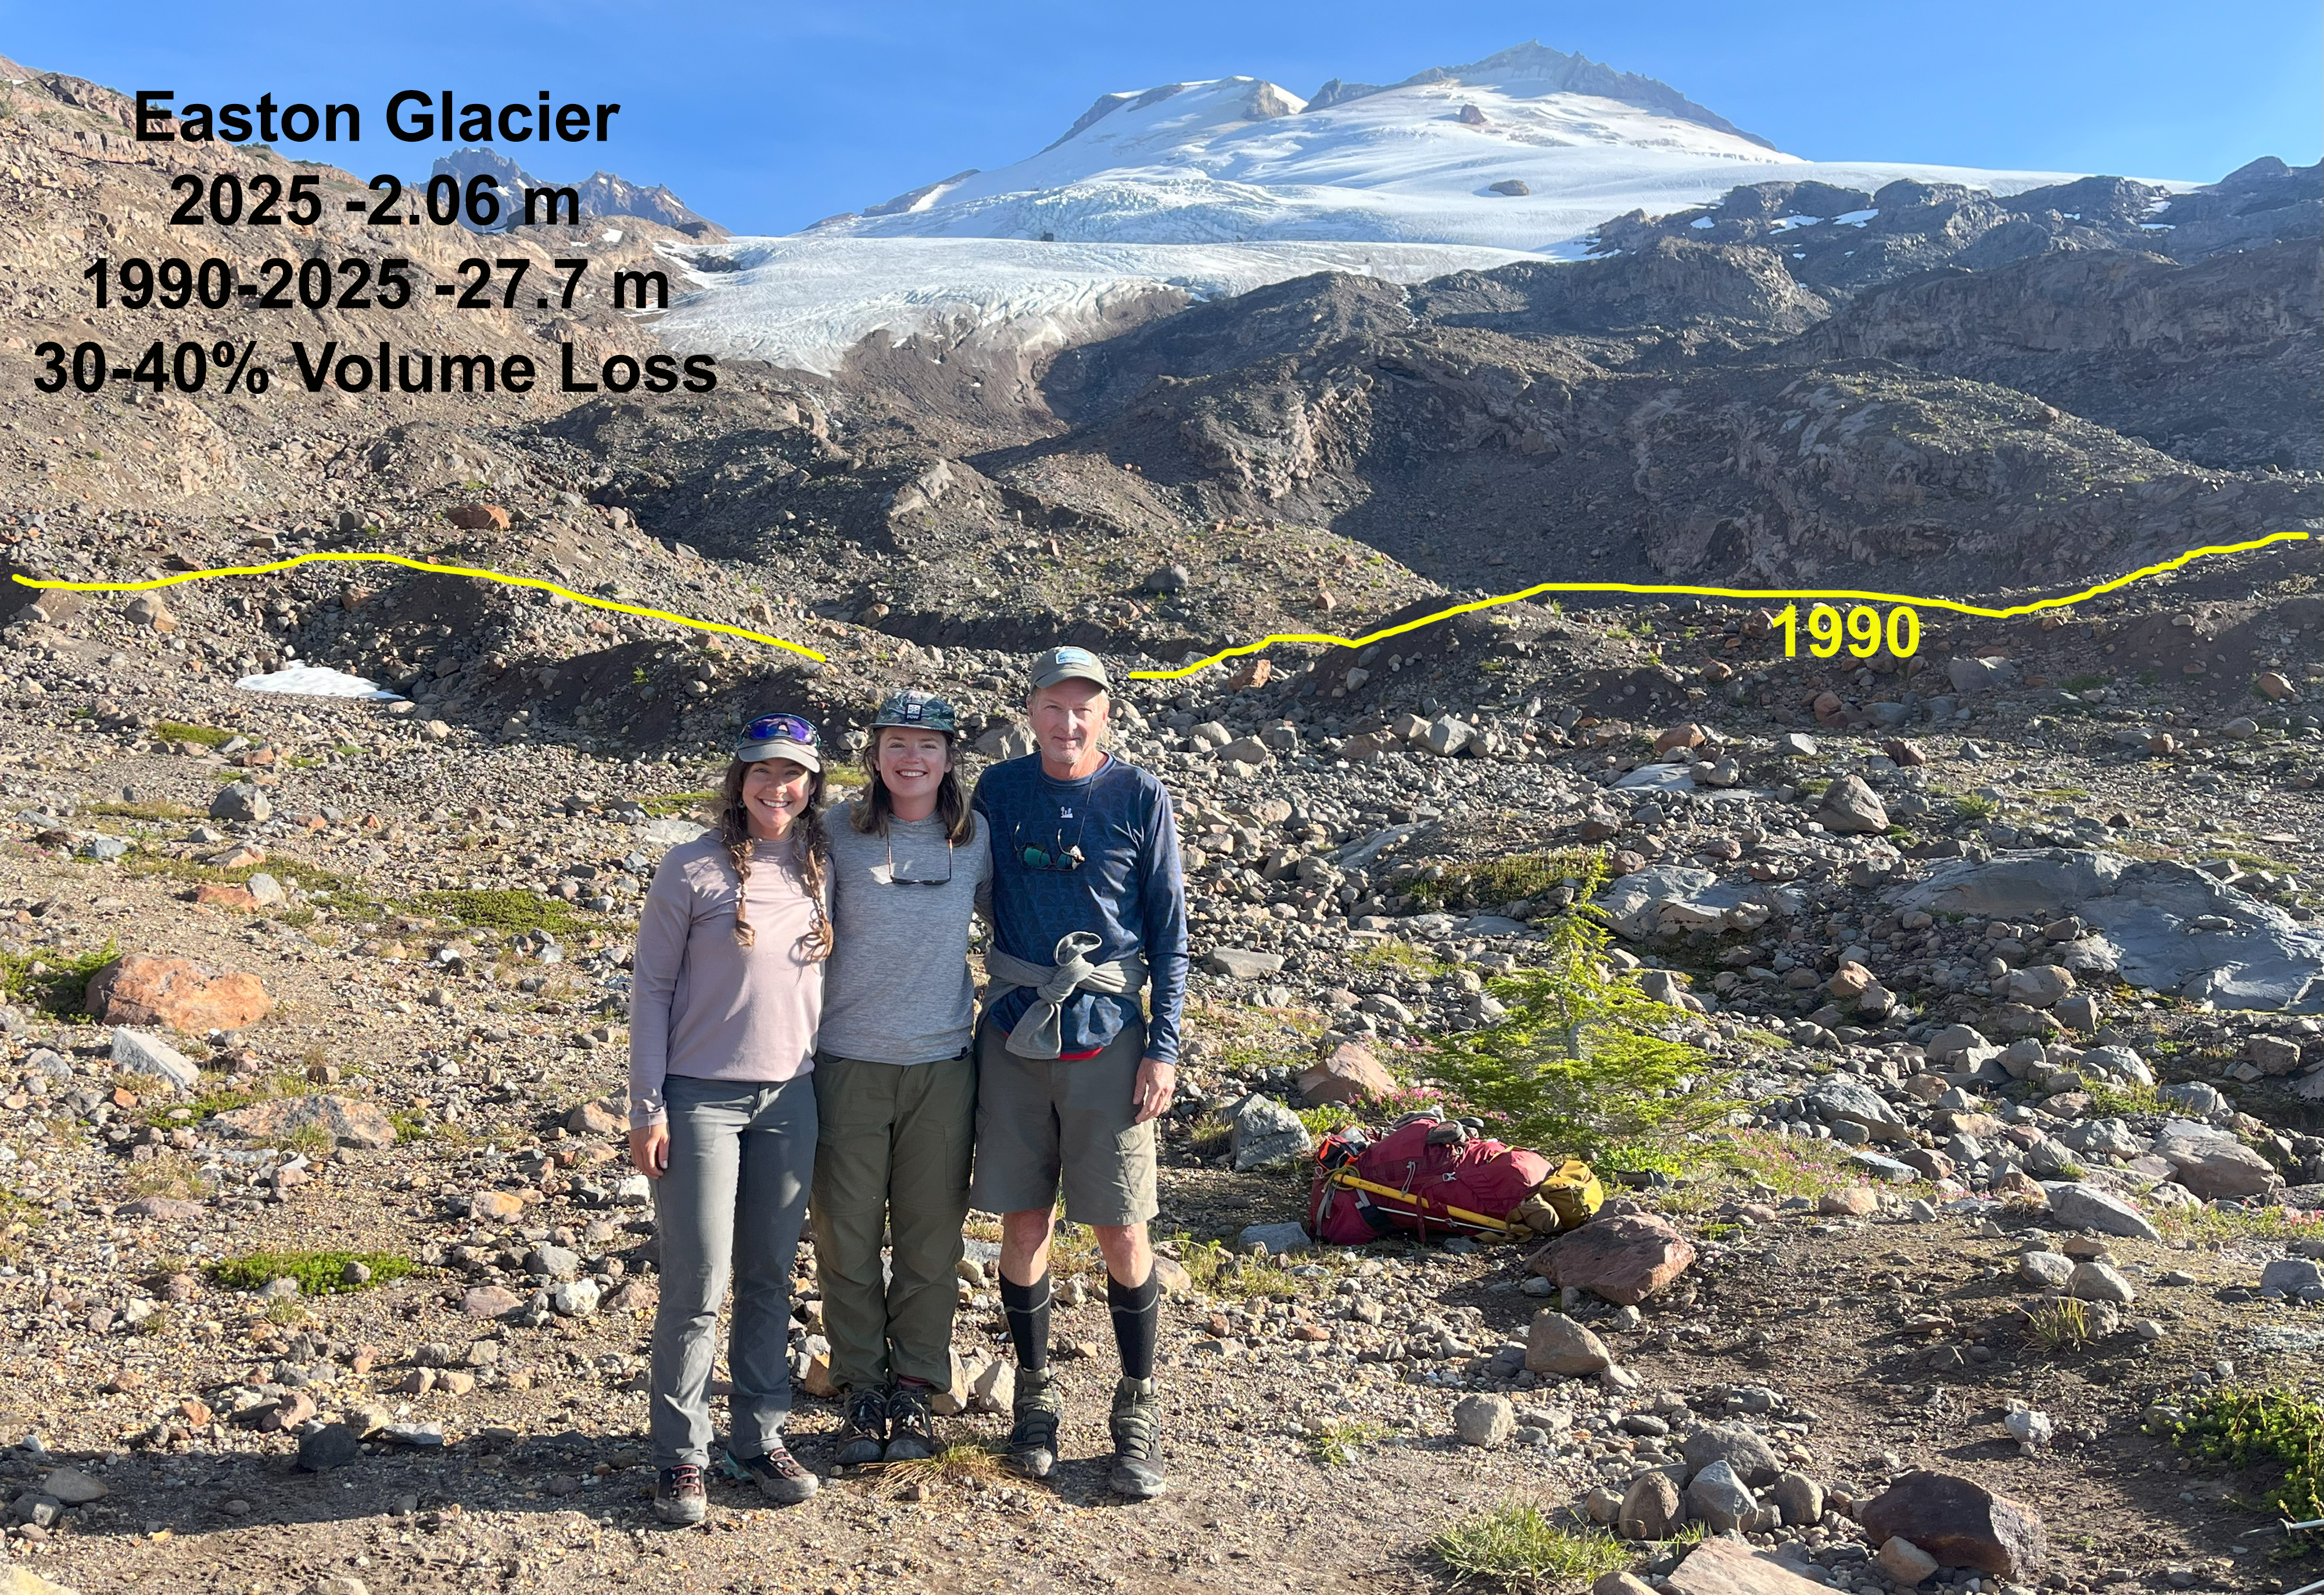
Rikki Held: Rainbow Glacier cave with Mauri for scale. The 43rd field season of the NCGCP was filled with both devastating and beautiful moments. We traversed landscapes with fresh glacier-fed streams, rugged mountains, wildflowers, mountain goats, and glaciers with unique formations and characteristics, while also witnessing heartbreaking sites including the large cave hollowing out Rainbow Glacier’s terminus on Mt. Baker and wildfire smoke plumes throughout the field season. Mauri and Jill shared their multi-year observations noting vegetation changes, newly exposed bedrock, and how far the glaciers have receded since they first visited them – e.g., Easton Glacier has retreated around 750m since 1990. This project highlights the importance of long-term data collection, science communication, and personal narratives as we all work to reduce the impacts of anthropogenic climate change and protect the environmental systems we depend on.
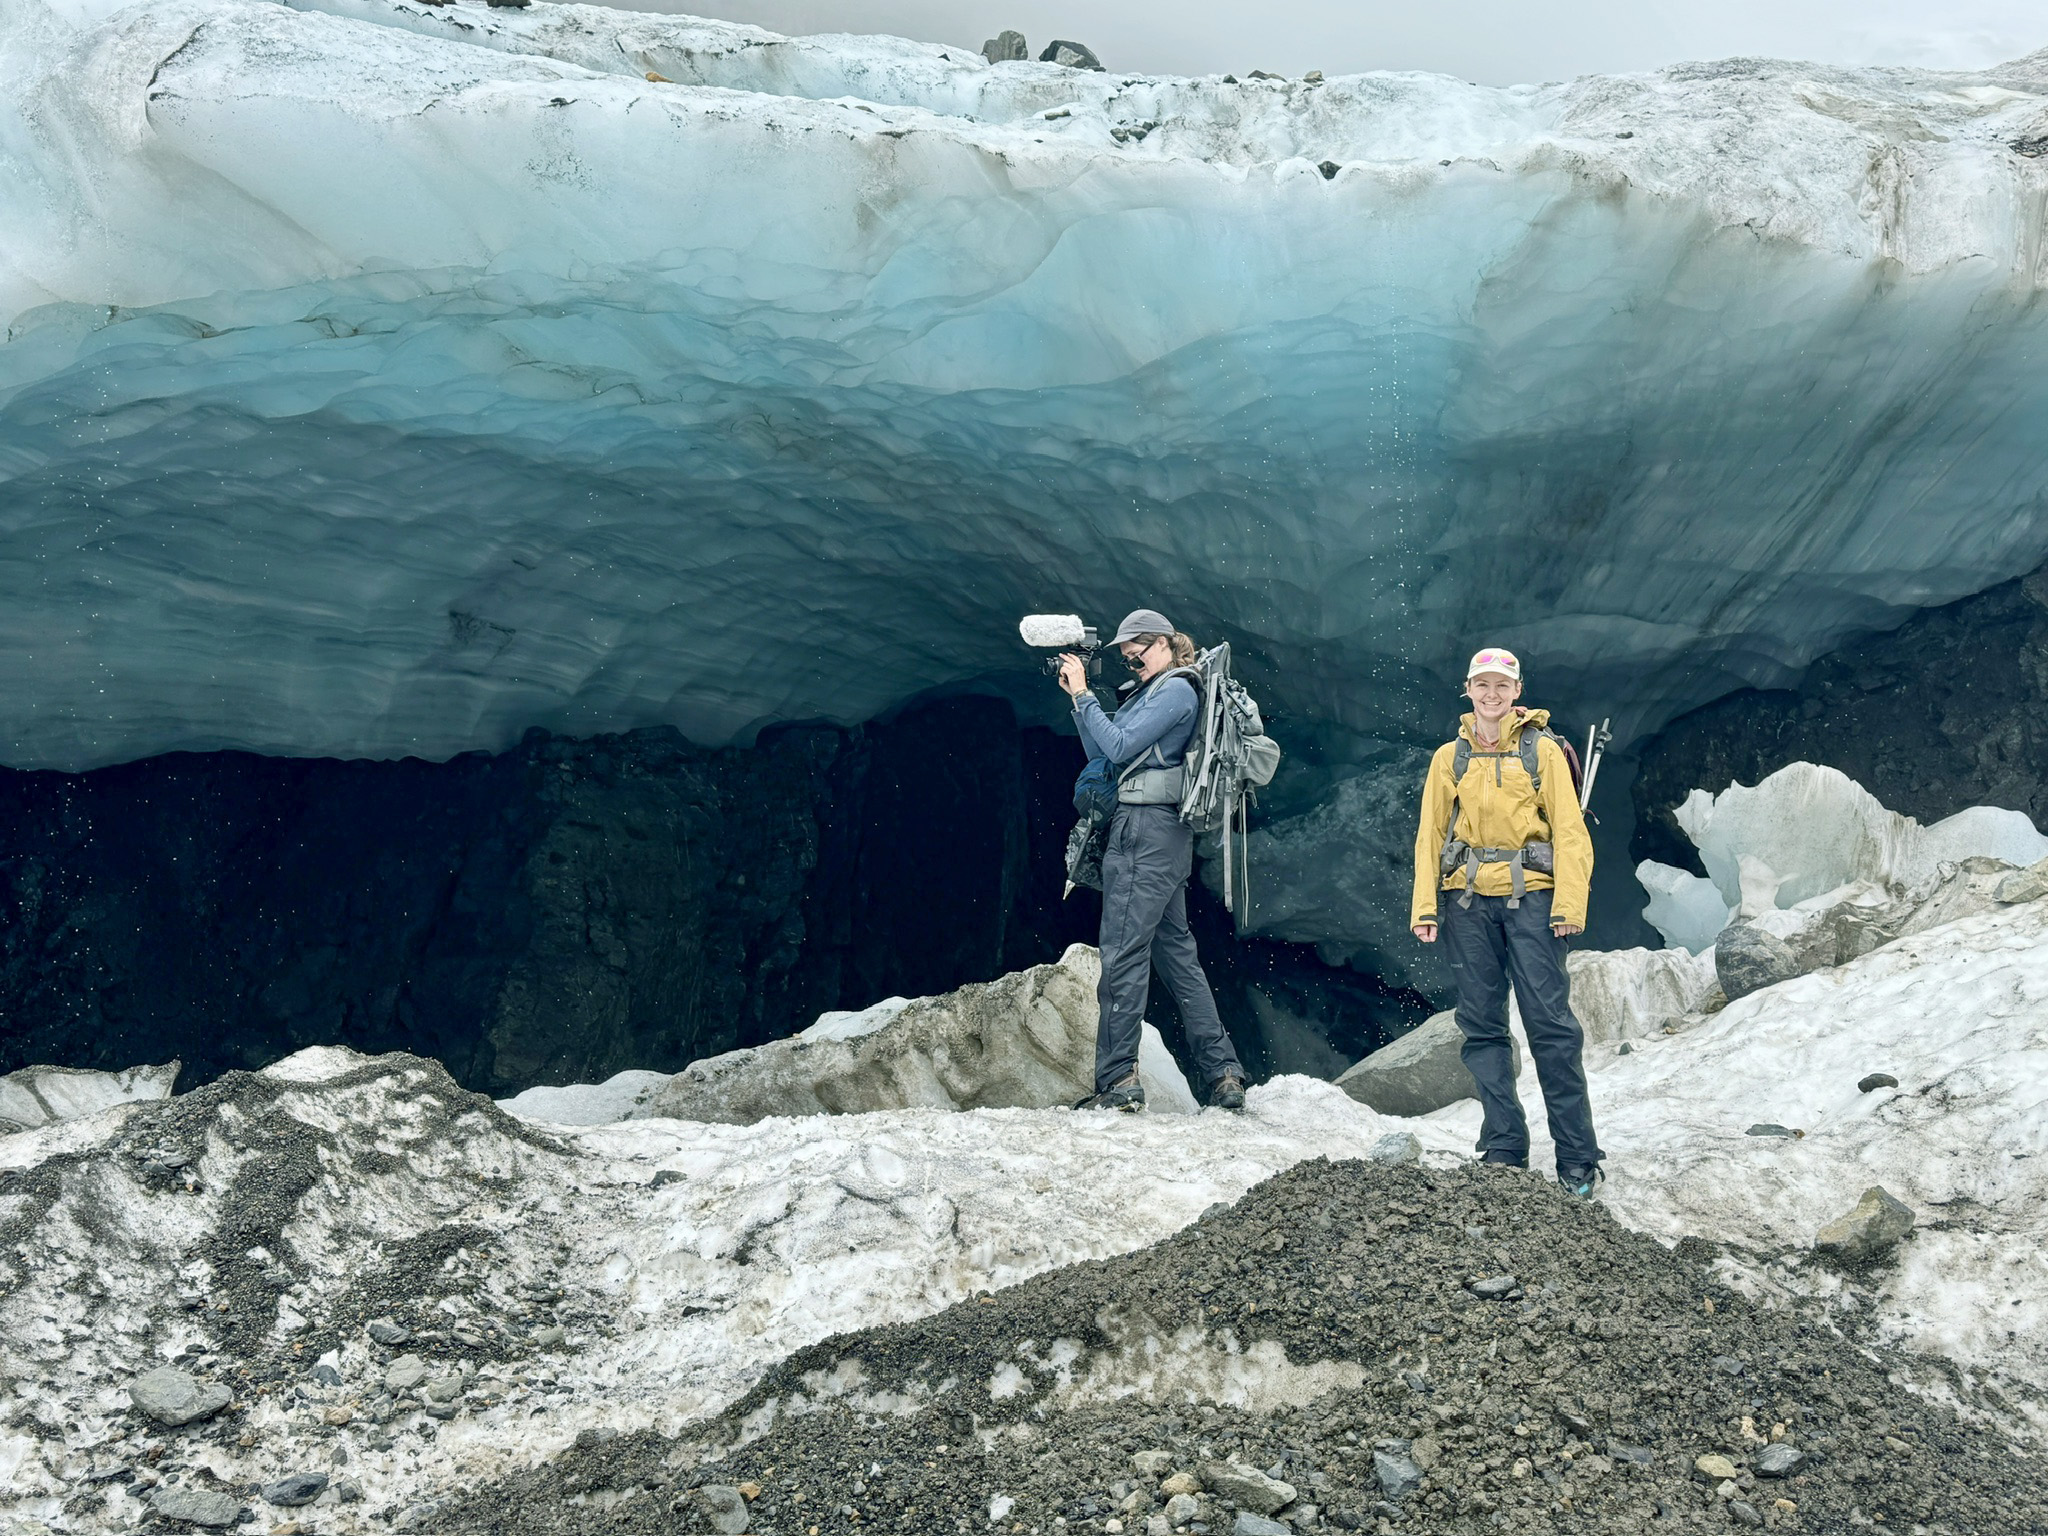
Mauri Pelto: Rainbow Glacier cave at the terminus with Abby and Rikki in foreground, viewed from an area where a previous cave had collapsed. Large ice caves are features of retreating glaciers where warm air circulates expanding the cave until it collapses. We observed several of these at the terminus of glaciers on Mount Baker this summer. The largest was at the terminus of Rainbow Glacier. The cave is large enough to hold a cape style house. It will collapse by the end of summer driving further retreat. The size of this cave and the roar of the water was quite intimidating.
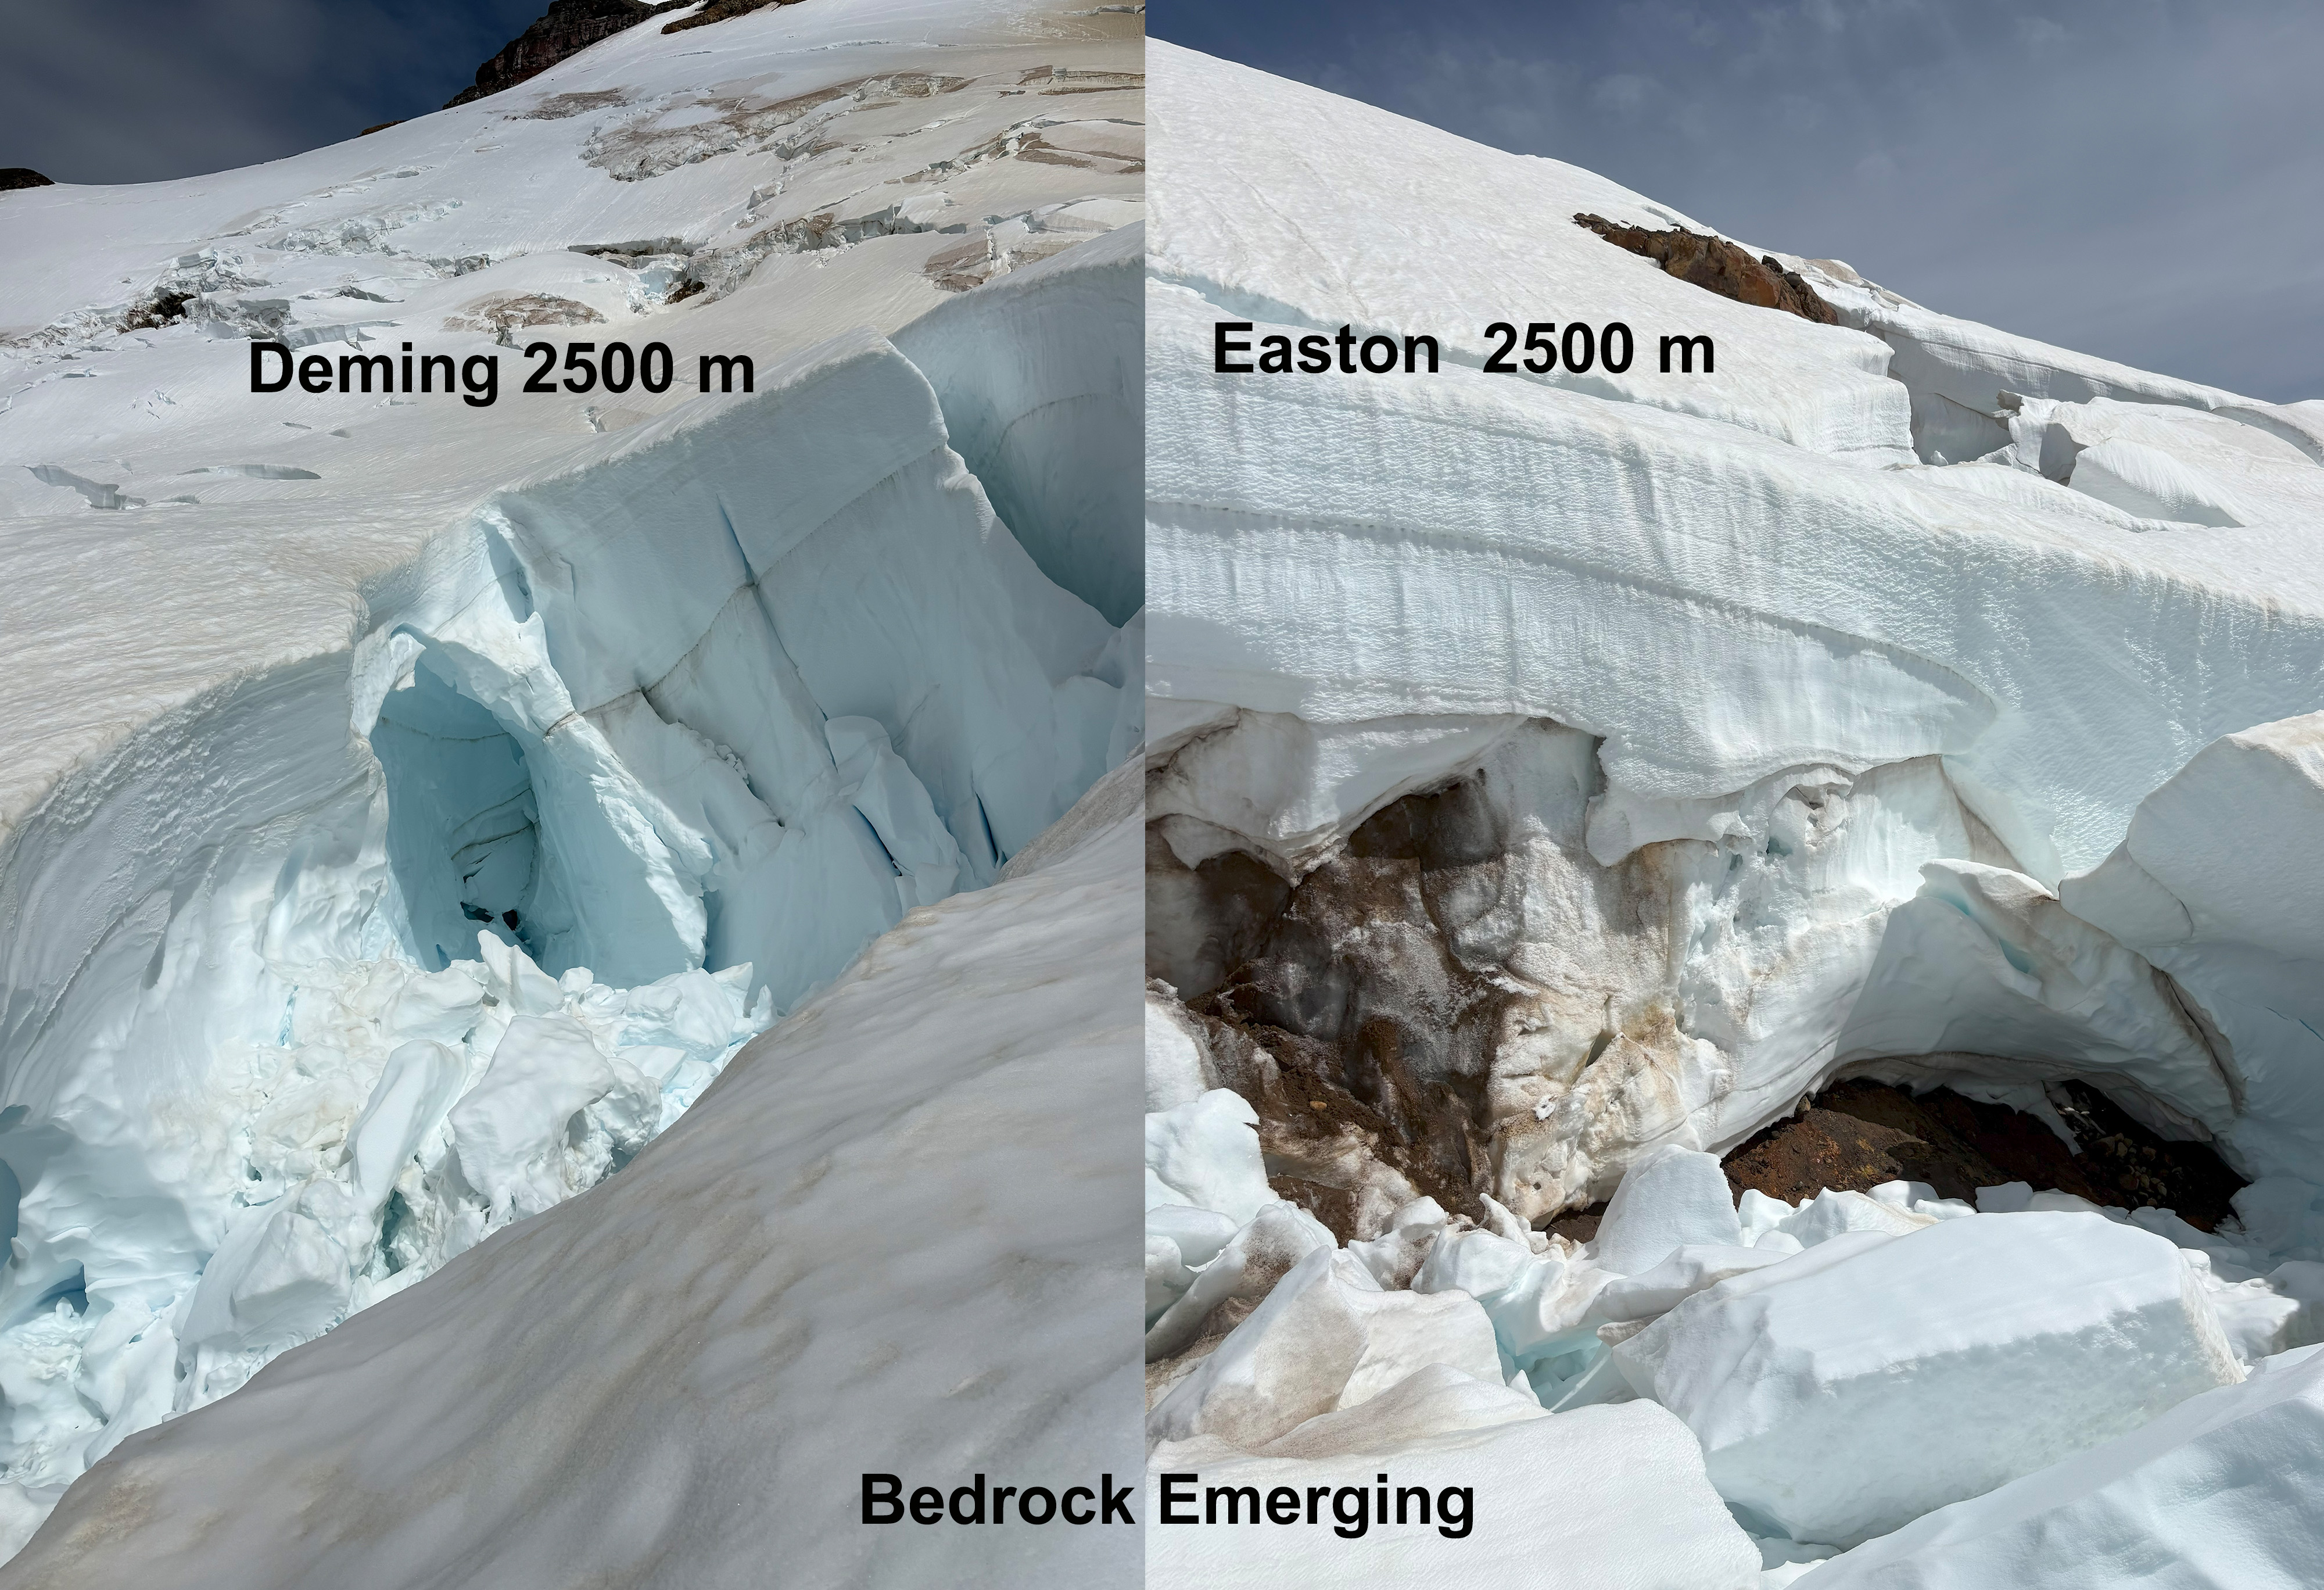
Hannah Contreras: In a melted feature looking up at two newly exposed, widening bedrock areas in the Easton Glacier icefall. As bedrock becomes visible, it’s darker shade absorbs heat and melts the ice around it even faster, creating a vicious cycle. In between measuring crevasse and snow depth, this field season we observed newly exposed bedrock in the icefall, again at ~9000 ft just off the popular Easton climber’s route, and finally at the top of the famed Roman Wall (~10,000 ft). Seeing growing bands of melted out bedrock at these elevations and features highlights how threatened the Easton truly is. As a mountaineer, I have spent quite a bit of time both traveling on and marveling at glaciers, but never like this. Experiencing these landscapes always evokes a strong sense of awe, appreciation, and inspiration, but when faced with the magnitude, speed, and decisiveness of their retreat, these feelings were countered by an equally powerful sense of dread and loss.
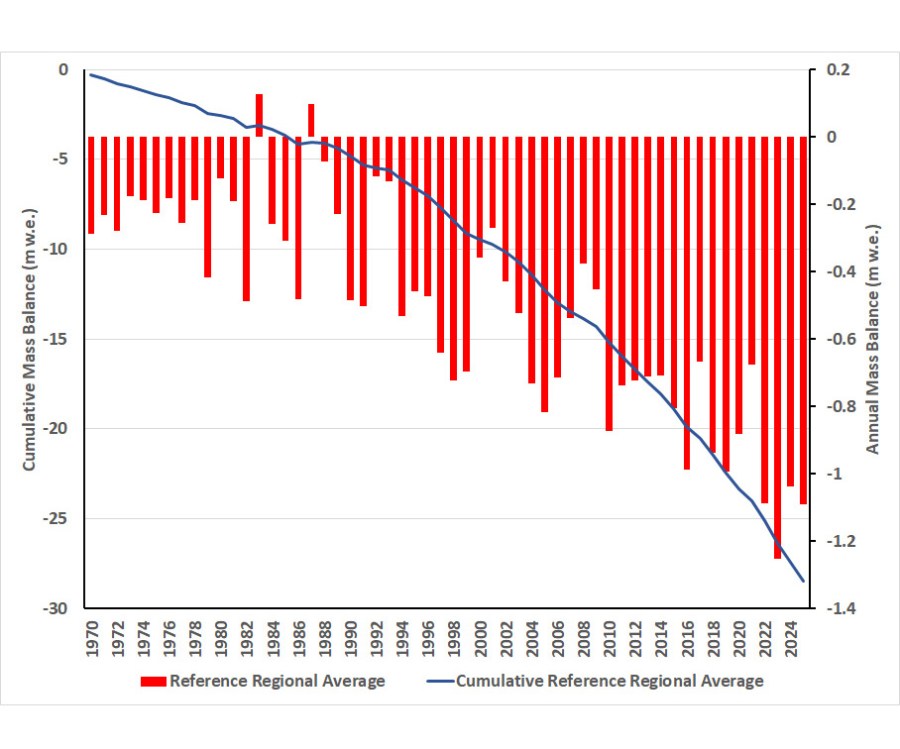
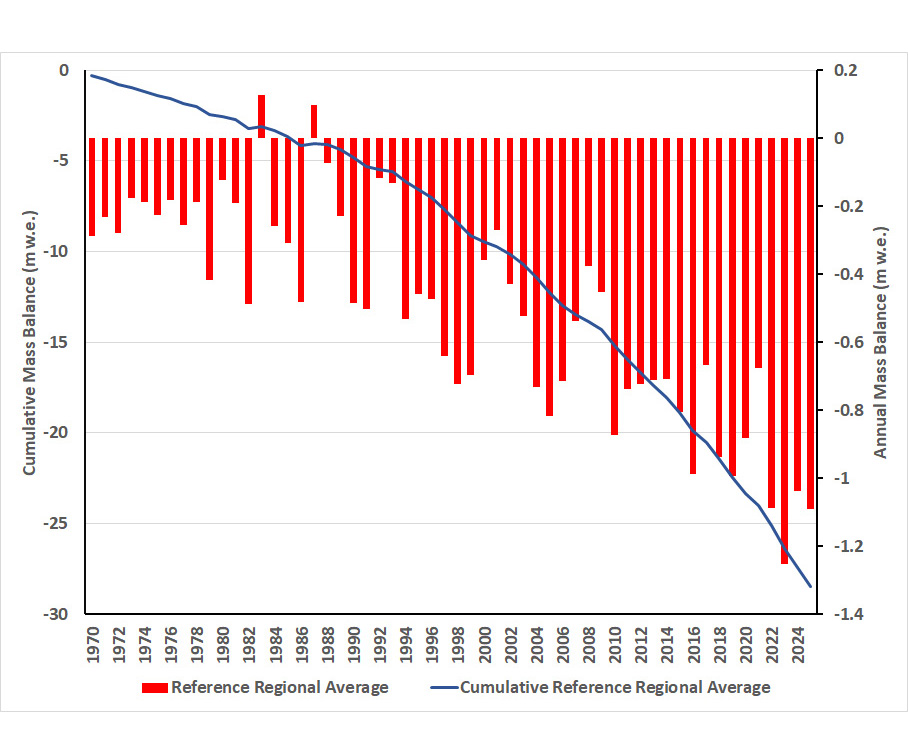
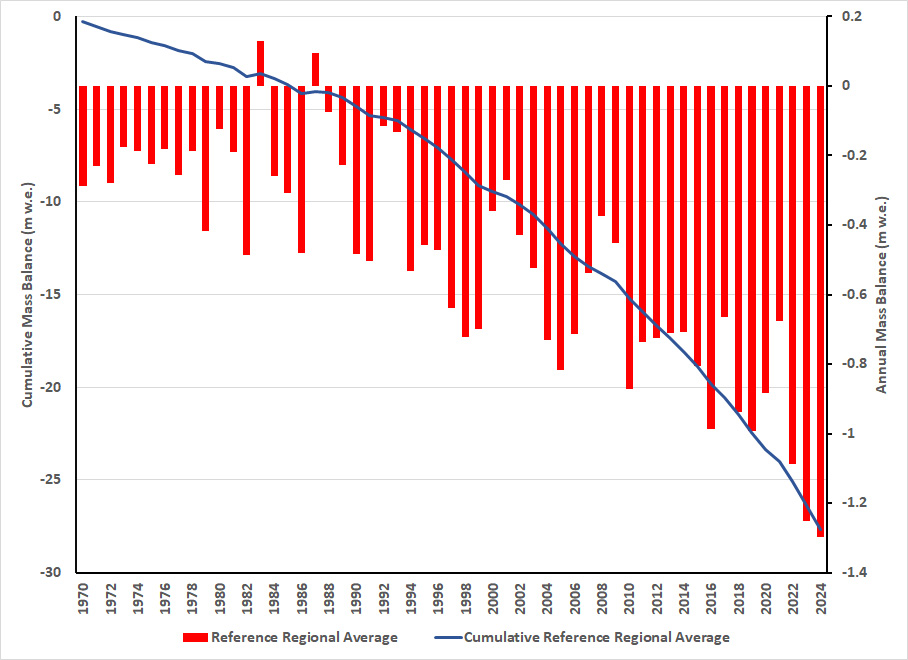
Figure 1. Global mean annual balance (bars) and cumulative balance (line) from the WGMS data set.
Each year since 2008 I have been responsible for summarizing the global alpine glacier status for each specific year in the Bulletin of the American Meteorological Society State of the Climate report. The 2025 report came out in early August. Below is the report with several added figures.
The 2025 World Glacier Monitoring Service (WGMS) dataset of annual glaciological mass balance observations includes 162 glaciers from six continents and 26 nations, 158 with a negative balance and four with a positive balance. In 2025, the mean annual mass balance of the 59 reporting global reference glaciers was –1.34 m w.e., and -1.34 m w.e. for all 162 reporting glaciers. The 2025 regionalized global average annual balance of –1.09 m w.e., is the fourth consecutive year with mass balance loss exceeding 1.0 m w.e., 2023 had the most negative -1.23 m w.e and 2024 was at 1.04 m w.e. Since 1976, mountain glaciers and ice caps have lost 9179+621 Gt of water, contributing 25.3+1.7 mm to the global mean sea level rise, with 41% of this loss occurring in the last decade (Dussaillant et al. 2025).
The mean annual balance of global reference glaciers was -1.34 m w.e., a similar result to 2023 and 2024 with a mean annual balance for global reference glaciers of -1.60 m w.e. and -1.37 m w.e., respectively. This makes 2025 the 38th consecutive year with a global alpine mass balance loss, the 16th consecutive year with a regionalized global mass balance below –0.5 m w.e. The significant acceleration of mass balance loss is evident in glaciological observations, geodetic observations, altimetry observations and gravimetric observations (The GlaMBIE Team, 2025). The acceleration of mass balance loss indicates glaciers are not approaching equilibrium and increasingly are disappearing. The Global Land Ice Measurement from Space inventory of global glaciers has now added an extinct glacier layer to record glaciers that have disappeared, that is populated by 181 glaciers that had existed in a previous inventory (Raup et al. 2025). In conjunction with 2025 being the UN International Year for Glaciers’ Preservation the Global Glacier Casualty List has been created to chronicle the story of specific glaciers being lost from each glaciated region (Boyer and Howe, 2025).
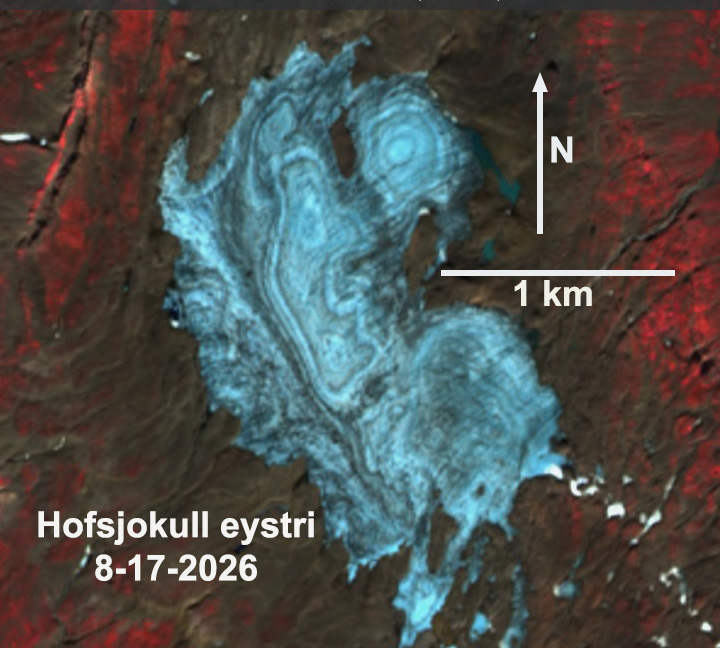
Hofsjokull eystri, Iceland was snow free by mid-August, leading to extensive ice cap thinning.
In the European Alps all 54 glaciers observed had negative balances, with 45 of the glaciers losing over 1 .0 m w.e. In Iceland (6) and Svalbard (9) all 15 glaciers observed lost over 1.0 m w.e. In Norway 8 of 10 glaciers had a negative balance, with two glaciers having a positive balance. In Sweden 3 of 4 glaciers had a negative balance.
High snow line on Durung Drung Glacier, India near end of summer monsoon season.
In Asia all 23 glaciers across 7 nations had negative balances averaging 0.97 m w.e. In New Zealand the glaciers observed had a negative mass balance.
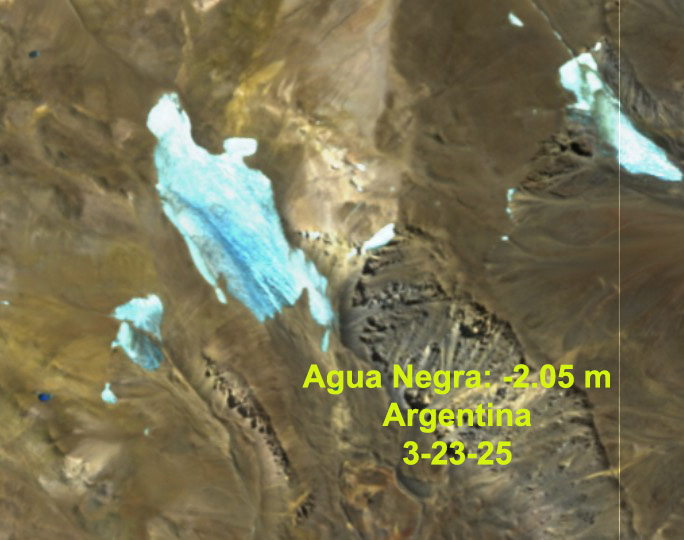
Agua Negra Glacier, Argentina with minimal snow cover at end of summer melt season.
In the Andes Mountains of South America nine of ten, reporting from four nations, had negative balances, with an average balance of -0.92 m w.e.
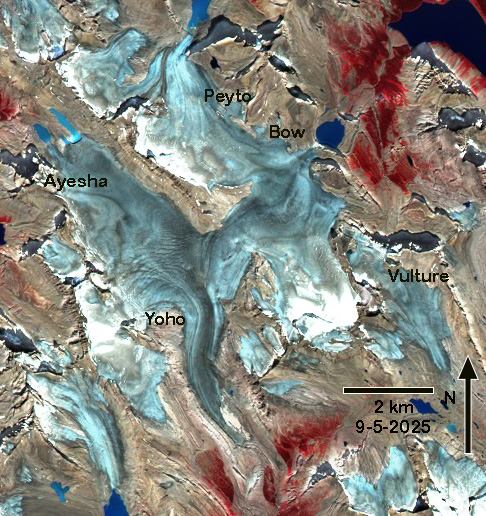
All 14 glaciers in Western North America, outside of Alaska, had mass balance below -1.0 m w.e. with an average of -2.24 m w.e. Peyto Glacier, Canada exemplifies the limited retained snow cover on alpine glaciers in Western North America in 2025, a glacier should be 50-60% snow covered at the end of summer to be in equilibrium (Fig X2). It is evident Peyto Glacier is representative of adjacent glaciers that also have limited retained snow cover. In Alaska 3 of 4 glaciers had negative balances. The five glaciers in Arctic Canada all had small negative balances averaging -0.16 m w.e.
Snow cover was minimal in the Yoho-Peyto Glacier regions, Canada at the end of the melt season.
Alpine annual mass balance glaciological observations are reported to the WGMS by National representatives with a December 1 annual submission deadline. WGMS reference glaciers (60) have at least thirty continuous years of mass balance observation. Benchmark glaciers (23) have at least a ten-year mass balance record and are in regions that lack sufficient reference glaciers. The combination of benchmark and reference glaciers are used to generate regional averages (WGMS, 2023). Global values are calculated using a single averaged value for each of 19 mountain regions, limiting bias from observed regions (WGMS, 2023). Expansion of this data set leads to reanalysis and updated values.
References
Boyer, D. and Howe, C. 2025. Communication efforts to educate the public about vanishing glaciers, 1958–2025. Annals of Glaciology, 67: e2. doi:10.1017/aog.2025.10033
Dussaillant, I., Hugonnet, R., Huss, M., Berthier, E., Bannwart, J., Paul, F., and Zemp, M. 2025: Annual mass change of the world’s glaciers from 1976 to 2024 by temporal downscaling of satellite data with in-situ observations. Earth System Science Data 17(5): 1977-2006, https://essd.copernicus.org/articles/17/1977/2025/.
Raup, B., Andreassen, L., Boyer, D., Howe, C., Pelto, M., and Rabatel, A. 2025: Tracking extinct glaciers in GLIMS. Annals of Glaciology, 66, e35, 1–6. https://doi.org/10.1017/aog.2025.10027
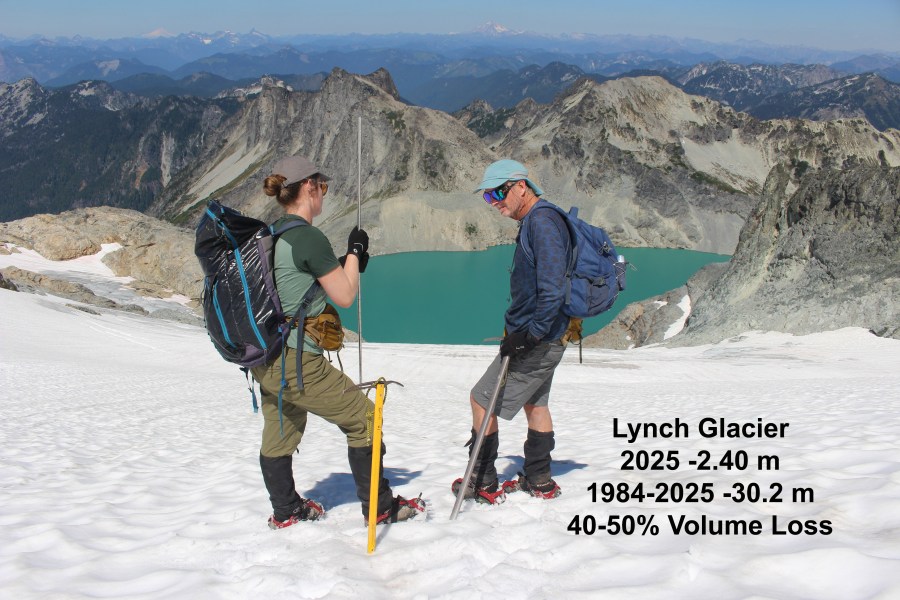
Lower Curtis Glacier terminus in 2025 with overall results of our work 1984-2025.
2026 Field Season: For the 43rd consecutive summer we are heading into the field to measure and communicate the impact of climate change on North Cascade glaciers. This field season follows the 2021-2025 seasons that featured either historic heat waves and/or periods of extended warm weather. The heat led to a greater exposure of bare ice on glaciers with a higher albedo and greater density. The observed melt rates are 7-9 cm/day water equivalent during warm weather events vs 4-6 cm/day for snow surfaces. This led to substantial mass losses on North Cascade glacier for the five years of ~8m. This winter was poor and the summer will be hard on glaciers. This year we have provided support from Alpine Start, Marmot, Protect our Winters and Smartwool.
Science objectives: We will complete detailed measurements on 10 glaciers, three of which are part of the World Glacier Monitoring Service reference glacier network (48 glaciers globally), which have 30+ consecutive years of mass balance observations. This summer we will have an opportunity to assess the long-term ramifications of the 2021-2025 period of unprecedented mass balance losses and associated glacier changes, with detailed mass balance, crevasse depths and glacier surface elevation profiling. We also focus on the impact of diminishing glacier size on downstream runoff.
Art Objectives: We will collaborate with several artists who will join us for a portion of the field season. They will be able to create their own work about the landscape and the science or may join us for fieldwork and make plans for future artwork. We hope to use this art to share our research with a broader audience and highlight the beauty and importance of these places.
Communication Objectives: We will leverage the brands of our expedition sponsors and local organizations that we are building collaborations to focus on continued rapid glacier loss and the downstream effects. We will utilize a combination of artists and scientists to tell the story.
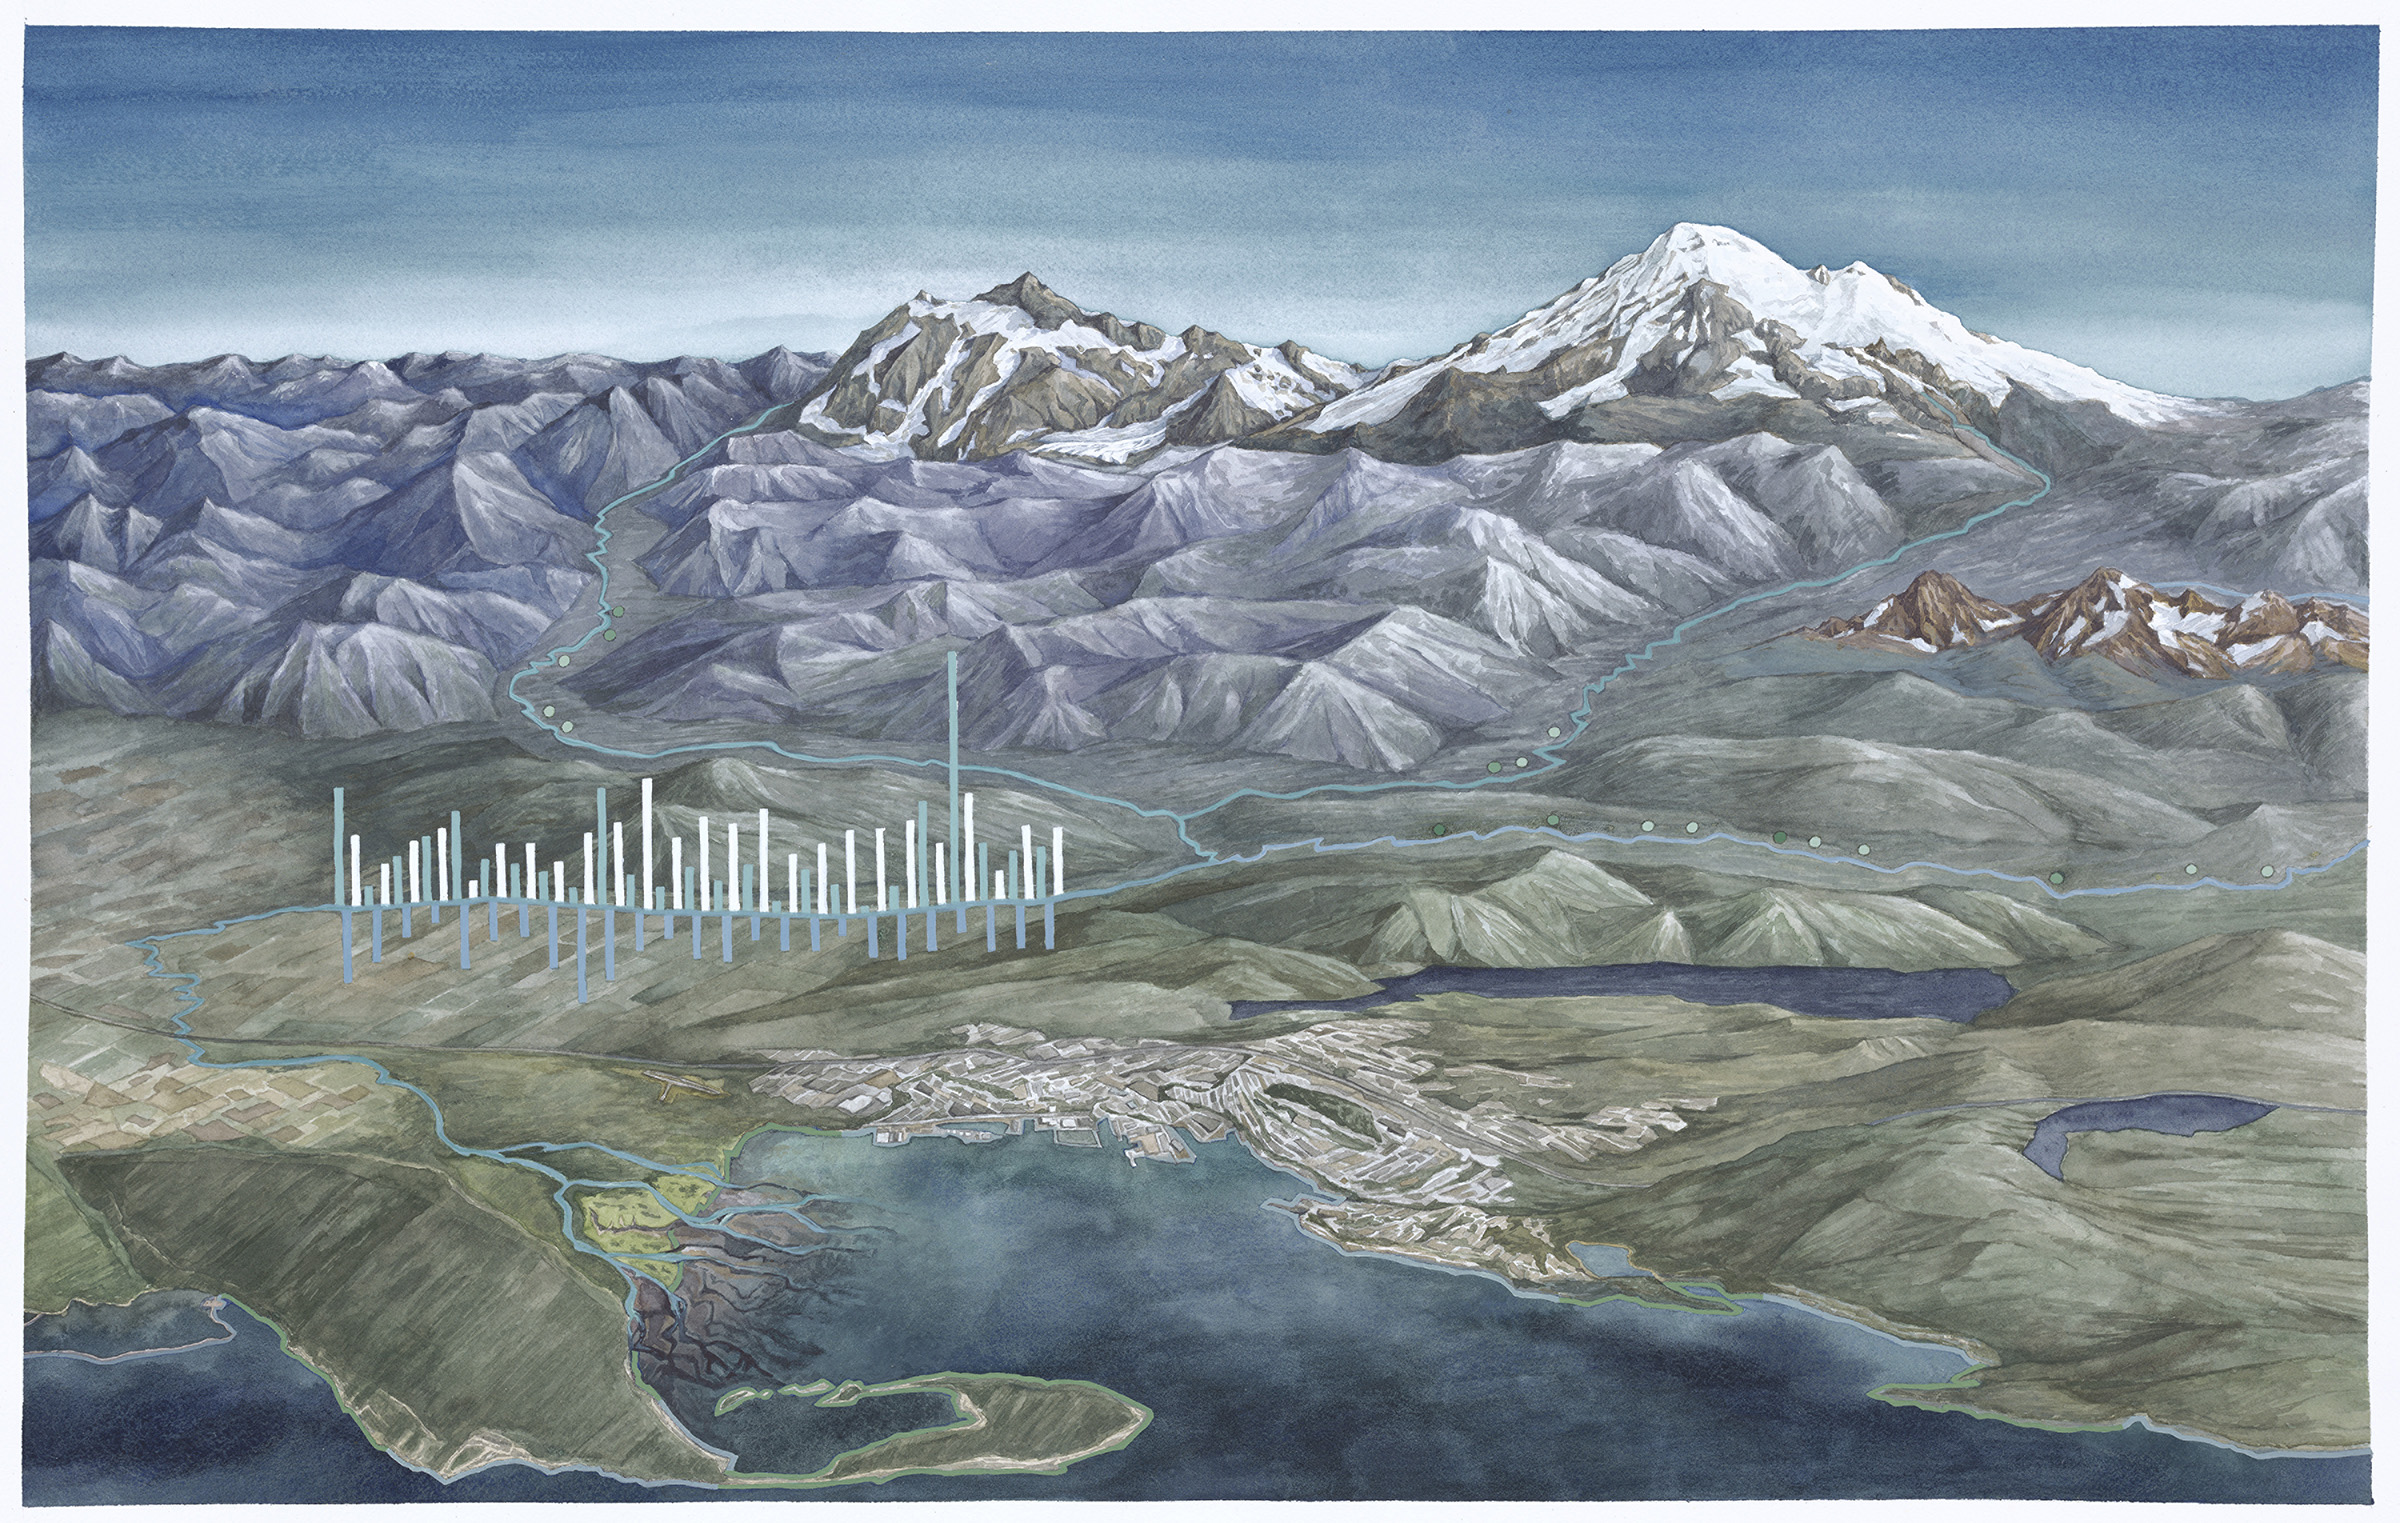
Painting by Jill Pelto of the Nooksack watershed illustrating connections from glacier to the sea.
Bios
Jill Pelto (she/her) is an artist and scientist from New England who grew up loving winter sports and trips to the mountains. She incorporates scientific research and data into paintings and prints to communicate environmental changes. 2025 was Jill’s 17th field season. She has coordinated an art gallery exhibit “Shaped by Ice” in Seattle in 2025 and in Winthrop, WA in 2026. She is excited about continuing to document the change in North Cascade glaciers that she has witnessed each of the last ten years —through science and art.
Mauri Pelto (he/him)has directed the project since its founding in 1984, spending more than 800 nights camped out adjacent to these glaciers. He is the United States representative to the World Glacier Monitoring Service. For 16years he has been author of the blog “From a Glacier’s Perspective”, and associate editor for three science journals. He is on the Science Advisory Board for NASA’s Earth Observatory. His primary position is Associate Provost at Nichols College, where he has been a professor since 1989. He either runs on trails or skis on alpine and cross country trails every day.
Ava Reynolds is a printmaker examining the relationship between environmental beauty and climate change in her work. Ava holds a B.A. in Global Sustainability and a B.A. in Studio Art from the University of Virginia (2020), and is in her first year at the Rhode Island School of Design, pursuing an MFA in Printmaking. She finds inspiration for her prints from organic forms, natural landscapes, and climate change data and seeks to use art as a medium to engage with a large audience about the impacts of climate change.
Shaina Dotson is a Seattle-based creative with a BFA in Metalsmithing whose hobbies include metal arts, fiber arts, and printmaking. She serves on the board of the Washington Alpine Club and instructs for their Basic Climbing Class, sharing her love of the mountains with new climbers. Shaina is an avid mountaineer who finds joy in exploring the forests, peaks, and wild places of Washington State. Her deep connection to the landscape, combined with a love of learning and giving back to her community, naturally drew her to this project. She looks forward to creating new work inspired by the glaciers of Washington and the research this project brings to light.
Rikki Held is an early-career scientist passionate about understanding Earth and climate systems and communicating science through film. Growing up on her family’s ranch in southeastern Montana and studying the adjacent river with USGS scientists sparked her interest in investigating the complex Earth systems in which we live. She earned her B.A. in Environmental Science at Colorado College and has conducted interdisciplinary research, taught high school biology and chemistry through the Peace Corps in Kenya, and communicated climate impacts through her climate advocacy work in Montana. In graduate school, Rikki aims to study glaciology and climate variability to better predict future change. She looks forward to learning from the scientists and artists involved in NCGCP and creating a short documentary on their inspiring work.
Abby Conner (she/her) is a water resources professional with a passion for connecting people to their local watersheds. She earned her M.S. in Civil Engineering from the University of Colorado and returned to the PNW, where she serves on the board of the Carkeek Watershed Community Action Project and volunteers with the Mountaineers. She looks forward to bringing her background in water resources to the NCGP and exploring the connections between North Cascade glaciers and the communities downstream.
Nina Adjanin (she/her) is an associate professor at Northwest Missouri State University. Her work integrates technology and immersive experiences to explore the intersection of education, extreme environments, and the impact of climate change on high mountains and polar regions. Beyond her academic work, Nina is an experienced high-altitude mountain guide and adventurer, with expeditions that have taken her to extreme environments around the world and shaped her interdisciplinary approach to research. Nina is thrilled to be joining this project documenting the changes in the North Cascade glaciers, bringing her background in extreme environments and climate change research.
Danielle Schlunegger-Warner is a multi-disciplinary artist working in sculpture, installation, and experimental digital photography, to celebrate the wonder of the natural world. After graduating from California College of Art with a BFA in Sculpture, she has fabricated and designed museum exhibits for over ten years and maintained an independent art practice including science communication projects. For NCGCP, Danielle plans to continue combining her art, science, and museum exhibit background. She will investigate how the rapidly changing glacial landscape of the Cascades can be seen through the lens of a microscope, intertwining field microscopy, image projection, and artistic observations illustrating impact of smallest forms of life the greater environment.
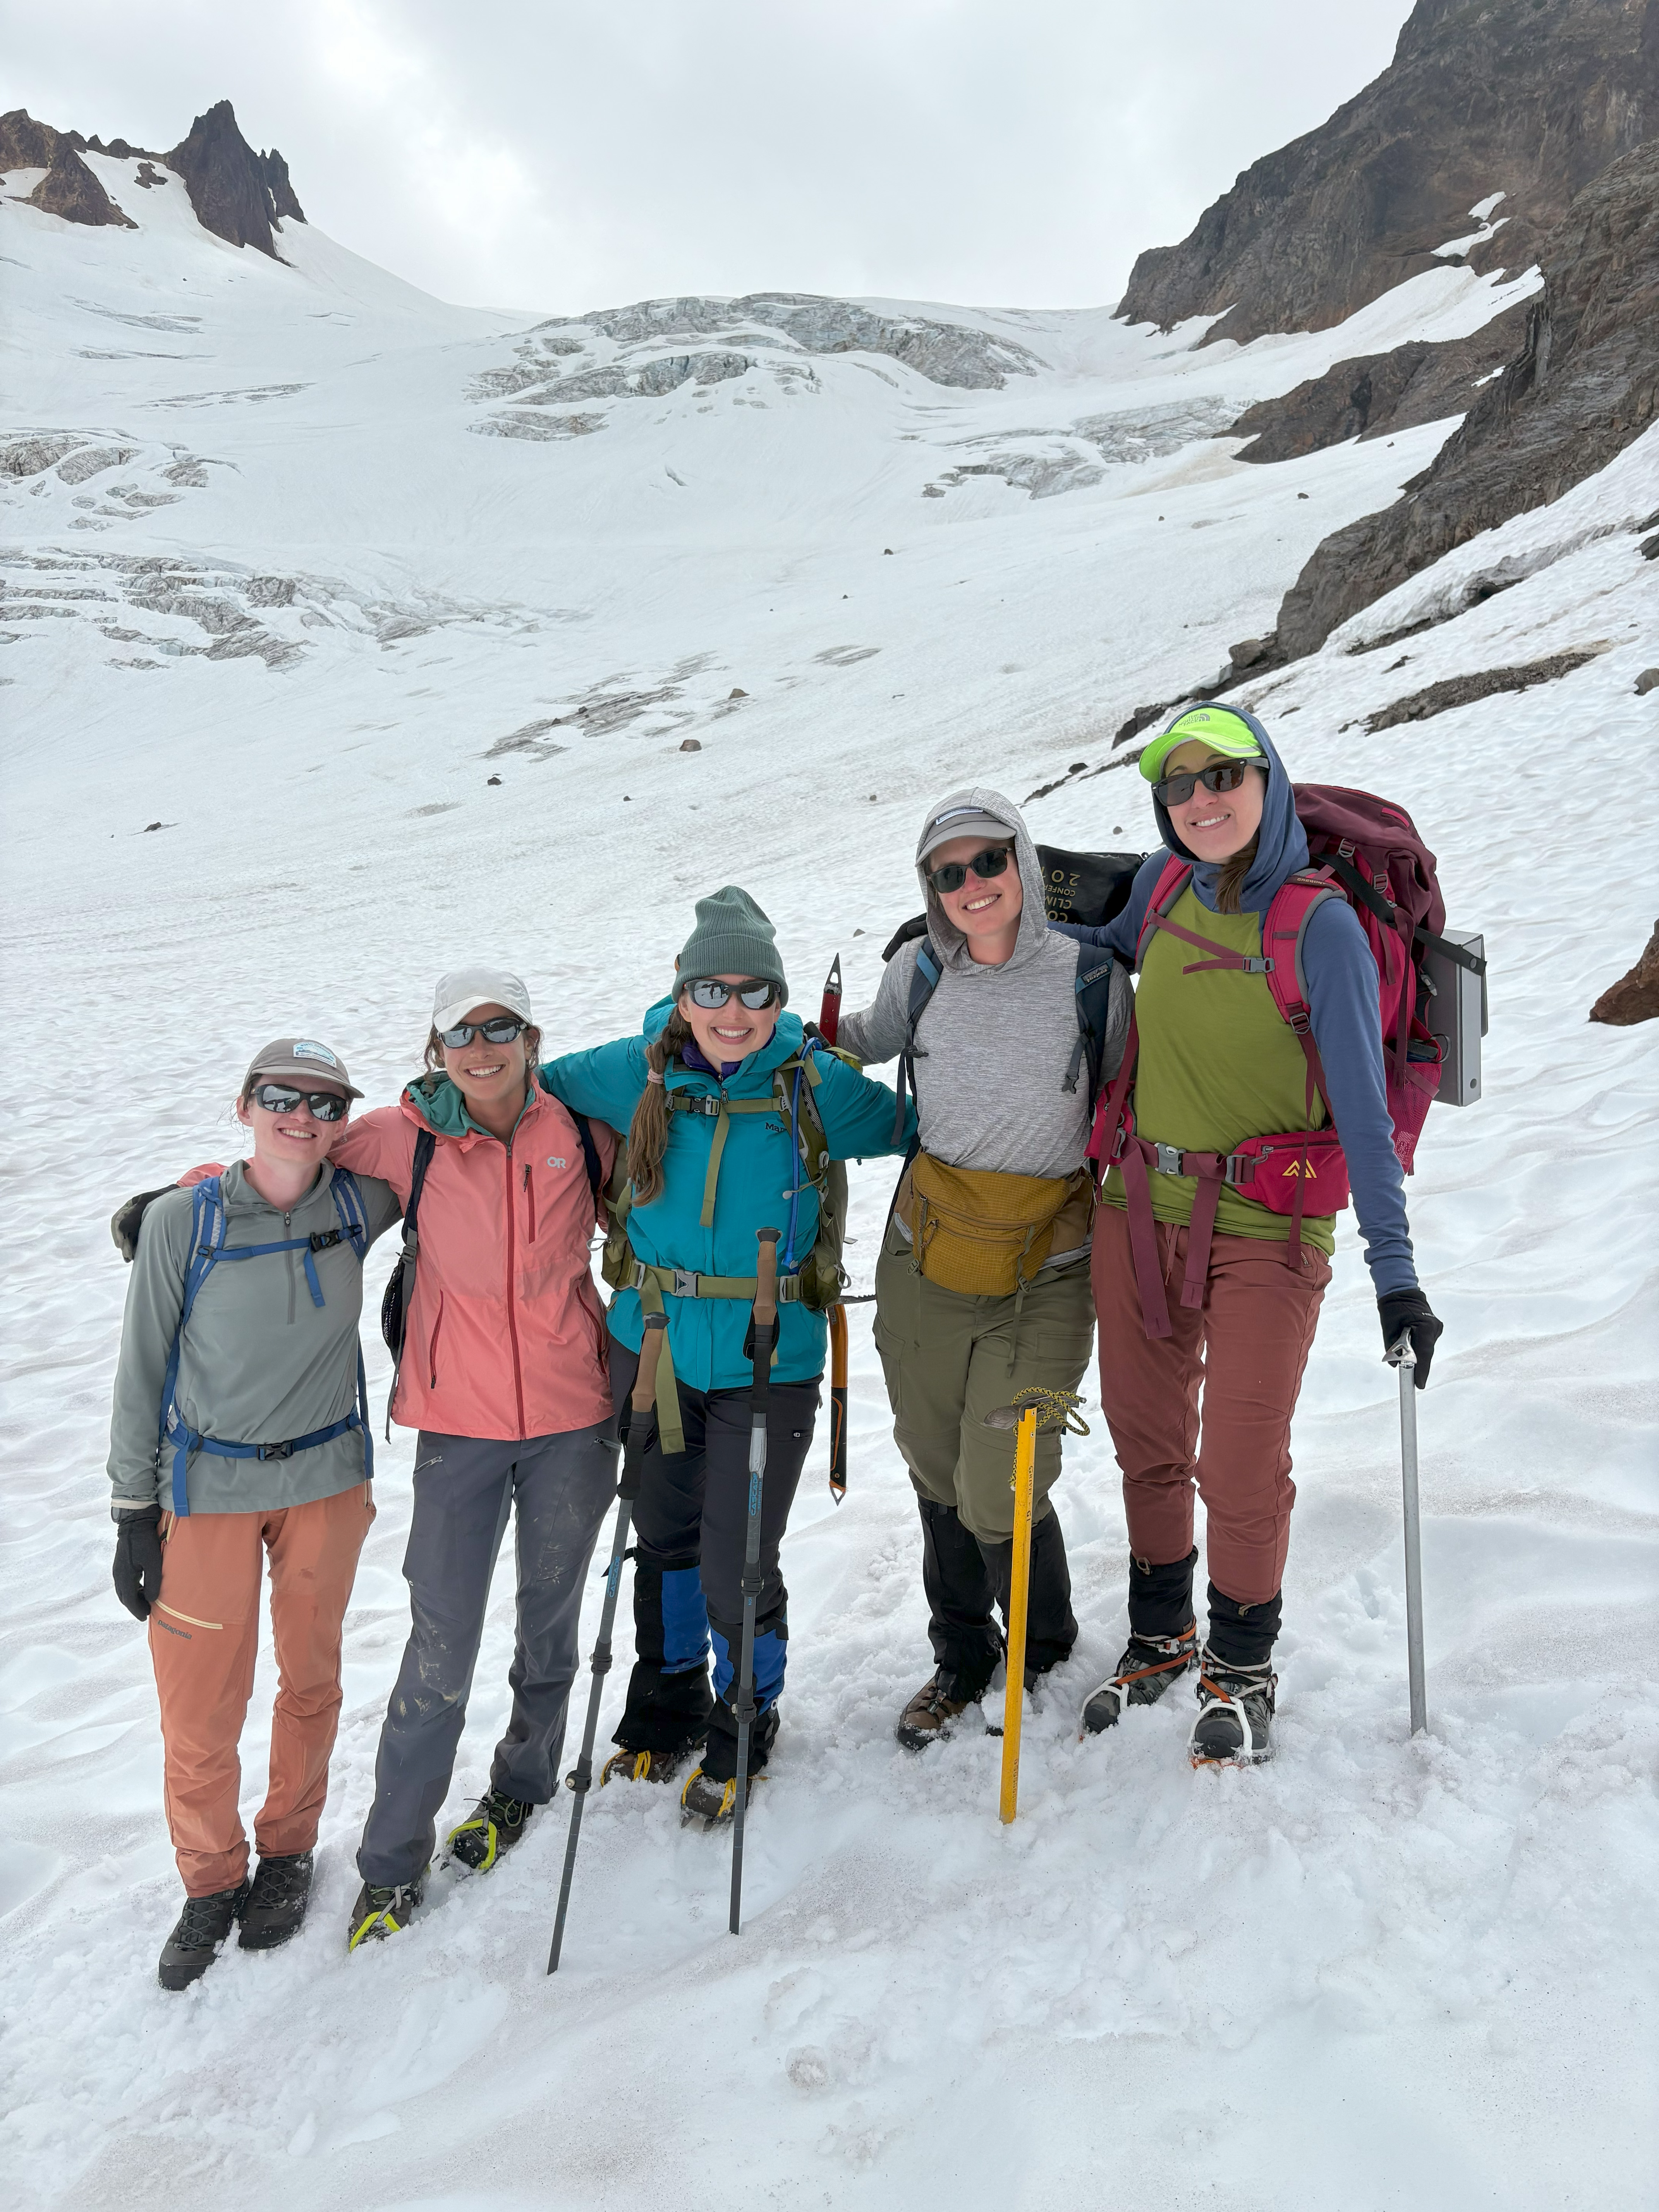
Team on Rainbow Glacier in 2025 from left Katie Hovind, Caitlin Quirk, Claire Sianna Seaman, Jill Pelto and Margaret Kingston.
2026 Schedule
July 28: Hike In Lower Curtis Glacier
July 29: Lower Curtis Glacier survey
July 30: Hike Out Lower Curtis/Hike in Ptarmigan Ridge
July 31: Sholes Glacier
Aug. 1: Rainbow Glacier
Aug. 2: Rainbow Glacier
Aug. 3: Hike out. Hike in Easton Glacier (Resupply in Bellingham WA)
Aug. 4: Easton Glacier
Aug. 5: Easton Glacier
Aug. 6: Squak Glacier
Aug. 7: Talum Glacier
Aug. 8: Hike out Hike in Columbia Glacier (resupply in Monroe WA)
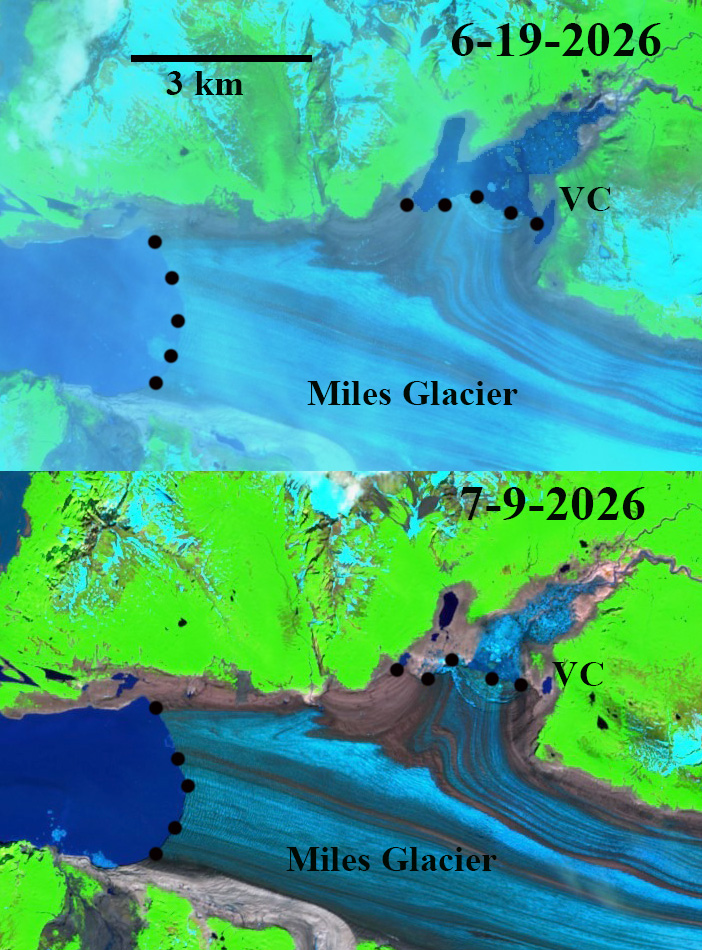
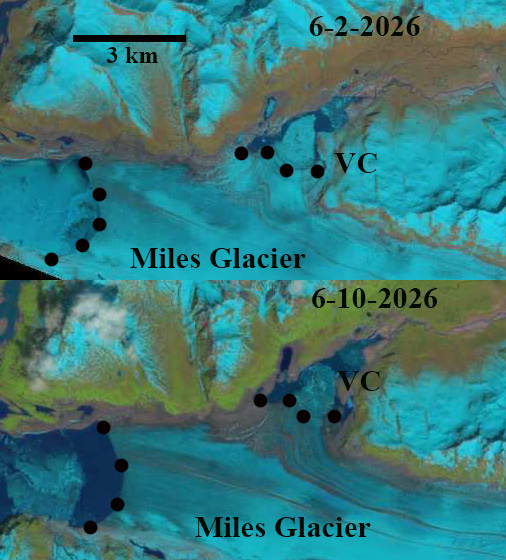
Miles Glacier and Van Cleve glacier lake (VC) near its maximum size on June 19th and after drainage on July 9th in Sentinel images. Glacier margin black dots.
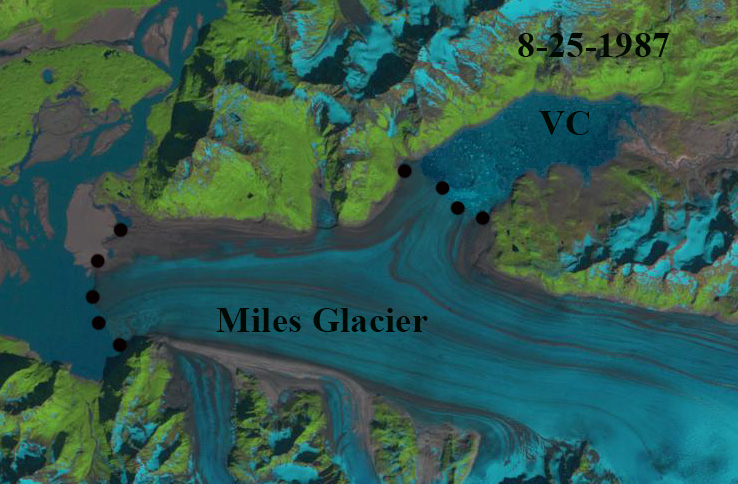
Miles Glacier terminates in an embayment on the east side of the Copper River, Alaska. A secondary terminus on the north side of the main glacier has long impounded a glacial lake that periodically drains. As miles has retreated over the last 40 years the maximum size of the glacial dammed lake has diminished, prior to its drainage. In 1987 the glacier extended onto an outwash plain directly adjacent to the Copper River, the lake reached a maximum size of 12 km2 . From 2016 to 2019 the lake drained each summer reaching a maximum average size of 5.5 km2 (Rick et al 2023). This was noted as a shrinking ice dammed lake by Field et al (2021).
Miles Glacier and Van Cleve glacial lake filling in June 2026 in Landsat images.Glacier margin black dots.
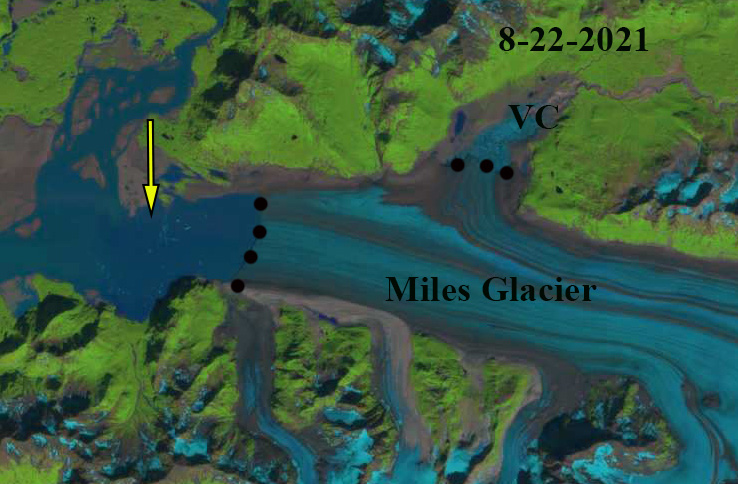
By 2021 the glacier had retreated 3.5 km since 1987. From 2021-2026 the lake reaches a maximum size of 3.5 to 4.0 km2 before draining. On June 2, 2026 the lake still has some winter lake ice and is filling. By June 10th the lake had reached 3 km2 and by June 19th it had reached 4 km2. The lake had began draining before June 25th. By July 9th it was fully drained. The Miles Glacier terminus has retreated 4.5 km since 1987. This ongoing retreat will continue to diminish the size of the lake. Ths lake does not have the complex drainage system or changing drainage location that Berg Lake has with retreat of Stellar Glacier..
Miles Glacier and Van Cleve glacial lake in 1987 Landsat image. Black dots indicate glacier margin. Miles Glacier and Van Cleve glacial lake in 2021 Landsat image. Black dots indicate glacier margin and yellow arrow indicates 1987 margin.
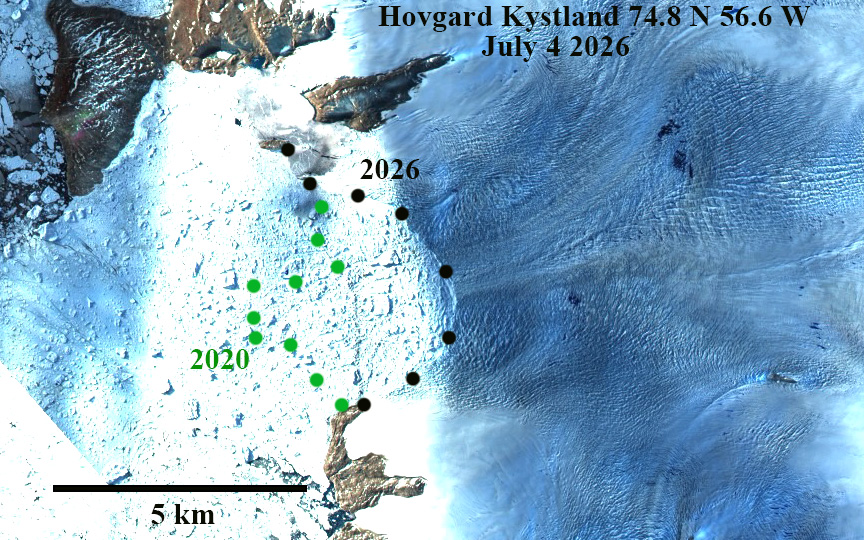
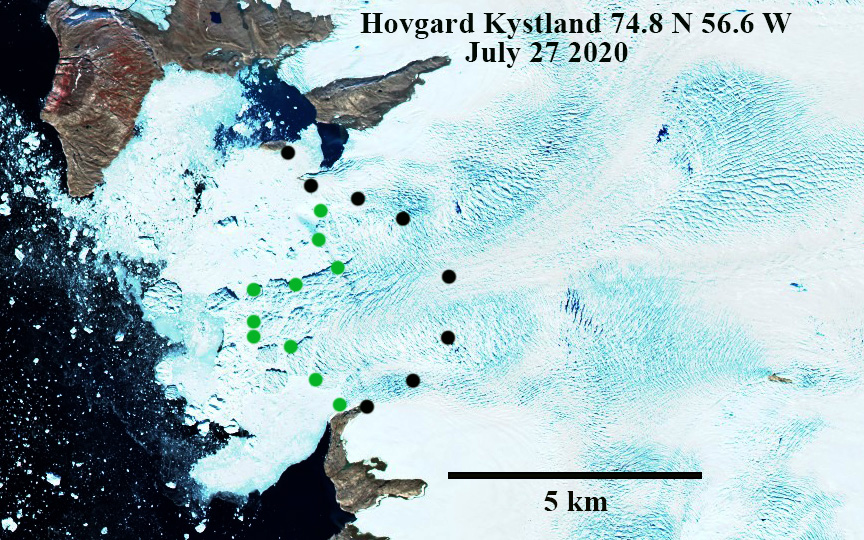
Hovgard Kystland Glacier in Sentinel image from July 4, 2026 with margin indicated by black dots. The 2020 margin seen below is indicated by green dots.
Hovgard Kystland Glacier is an outlet glacier in West Greenland between Alison and Hayes Glacier. Alison Glacier had the highest retreat rate from 1976-2021 losing 14.3 km in length and 59.4 km2 in terminus area (Black and Joughin, 2026). Hayes Glacier lost 2.7 km in length and 10.8 km2 in area (Black and Joughin, 2026).. They indicate that Hovgard Kystland Glacier retreated 5.4 km and lost 21.3 km2 during this interval.
Here we examine the acceleration of retreat from 2020 to 2026. In 2020 the central tongue of the glacier extended west beyond the main front. This central tongue collapsed by July 2024 leaving a generally north/south calving front, the glacier had lost 5.7 km2 of terminus area. From July 2024 to July 2026 an embayment formed generating a concave calving front. The glacier terminus lost another 4.8 km of area. Retreat of the calving front was 2.5 km during the 2021-2026 period. The glacier has lost an area that is 50% of the area lost from 1976-2021, in the last five years. The embayment is poised to further expand, though this summer an extensive packed melange is currently in place which typically limits calving (Meng et al. 2025).
Hovgard Kystland Glacier in Sentinel image from July 27, 2020. The 2020 margin seen below is indicated by green dots and the 2026 margin with black dots.Hovgard Kystland Glacier in July 4, 2024 Sentinel image. The calving front indicated by red dots for 2024 and black dots for 2026.
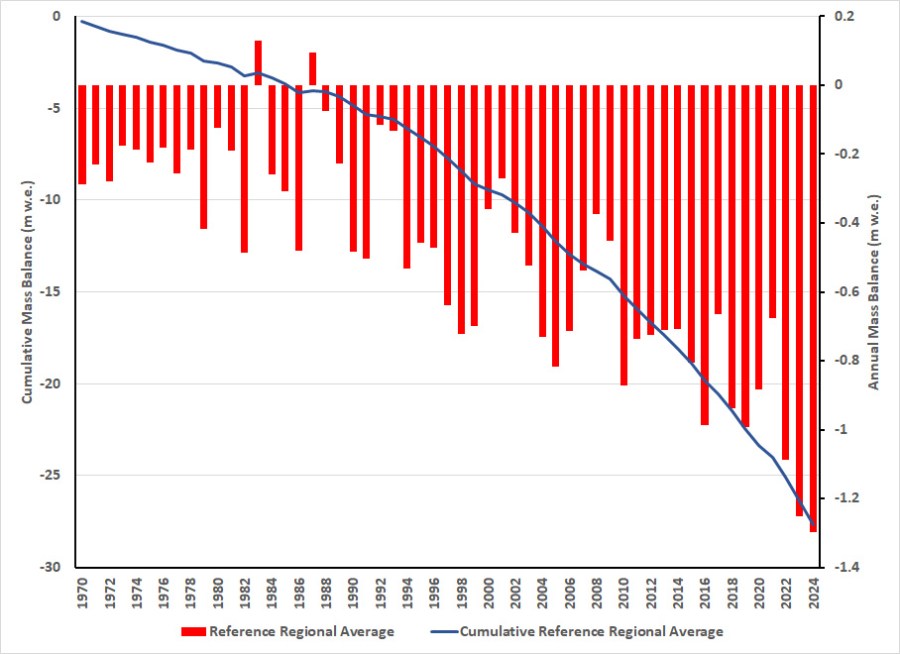
Global alpine mass balance in 2024 as reported to the World Glacier Monitoring Service. Solid line is the cumulative balance, bars are the annual balance.
Each of the last 15 years I have summarized the annual mass balance of alpine glaciers globally for the Bulletin American Meterological Society-State of the Climate report,. Below is the 2024 section on alpine glaciers with a few added figures.
ALPINE GLACIERS
M. Pelto
In 2024, all 58 global reference glaciers reported a negative annual mass balance. This is only the second year in the 1970–2024 period with all negative annual balances, following 2023. The global average annual mass balance based on equal weighting of 19 regions is −1.30 m water equivalent (w.e.), the most negative value in the record
The 2024 dataset of submitted glaciological observations includes 142 glaciers from six continents and 27 nations, with 140 reporting a negative balance and 2 a positive balance. In 2024, the mean annual mass balance of the 58 global reference glaciers was −1.44 m w.e. and −1.36 m w.e. for all 142 reporting glaciers. This is a similar result to 2023, which saw a mean reference glacier balance of −1.62 m w.e. and −1.35 m w.e. for all 116 reporting glaciers.
The 2024 regionalized global average of −1.30 m w.e. exceeds the previous most negative year in 2023, which saw a regional-ized global average of −1.25 m w.e. This makes 2024 the 37th consecutive year with a global alpine mass balance loss and the 15th con-secutive year with a regionalized global mass balance below −0.5 m w.e. The acceleration of mass balance loss indicates that alpine glaciers are not approaching equilibrium. The acceleration of mass balance loss is apparent regardless of datasets used to determine it, including glaciological, geodetic, altimetry, and gravimetric observations (The GlaMBIE Team 2025). The intercomparison assessment identified that global glaciers annually lost 273+26 gigatons (Gt) in mass from 2000 to 2023, with loss having been 36% greater in the second half than in the first half of this period (The GlaMBIE Team 2025).
In the European Alps, all 49 glaciers reported negative mass balances, with 45 losing over 1 m w.e. All 10 Icelandic glaciers had negative balances. In Svalbard, all seven had negative balances exceeding an exceptional loss of 1.25 m w.e. This was the result of near complete snow cover loss across most glaciers (Fig. 2.20) following record temperatures in August (see section 7f5 for details). Twelve of the 13 glaciers from Norway and Sweden had mass losses of more than 1.0 m w.e.
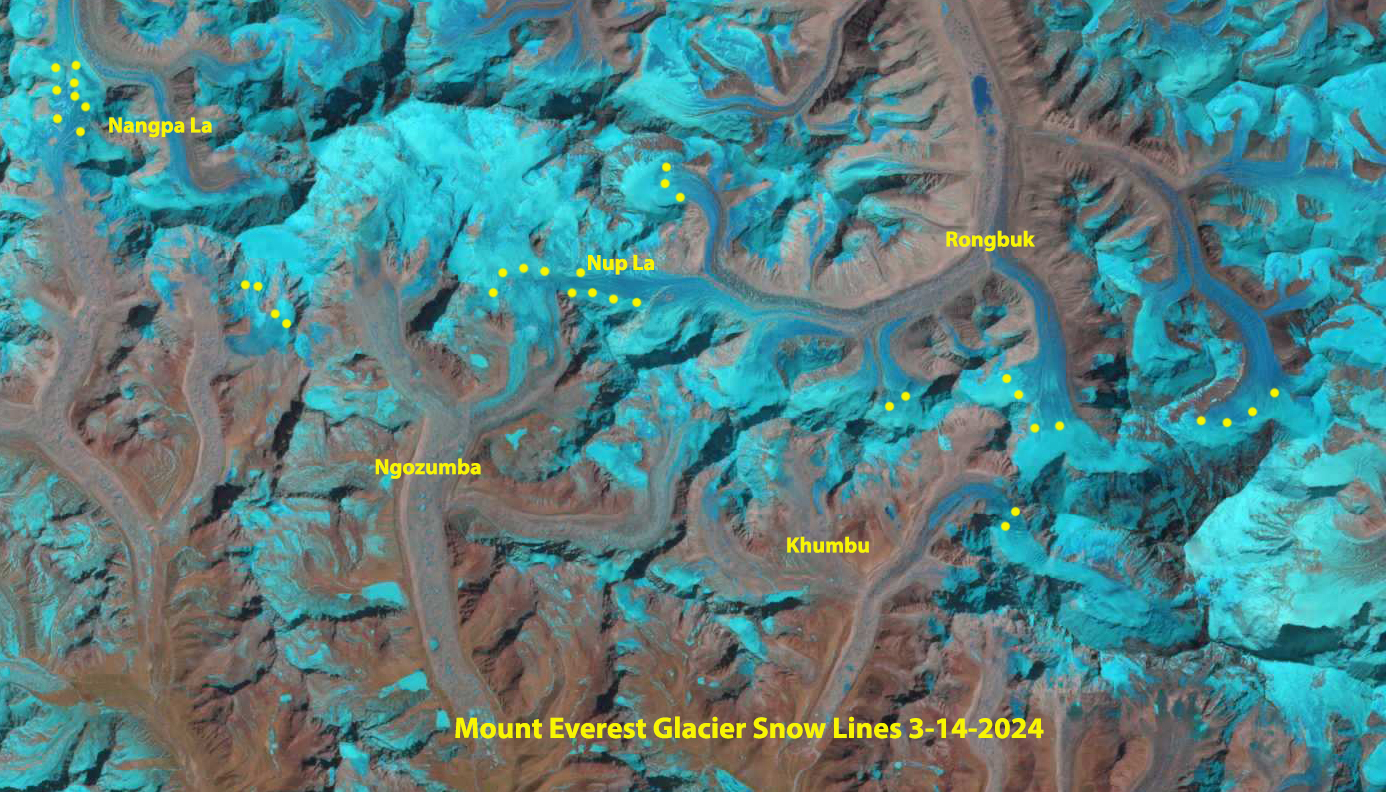
High snow line persisted through the winter on Mount Everest glaciers.
Across High Mountain Asia, 20 of 21 glaciers, reporting from seven nations, had negative balances. The highest average losses were in the Himalayas of Nepal and the lowest in the Pamir Range of Tajikistan.
In the Andes Mountains of South America, all 14 glaciers, reporting from five nations, had negative balances. Conejeras Glacier (Colombia), following a 5.04 m w.e. loss in 2023, was declared extinct in 2024. The daily hydrograph below this glacier changed from a predominanceof days with a purely melt-driven hydrograph from 2006 to 2016 to an increase in the frequency of days with flows less influenced by melt after 2016 (Morán-Tejeda et al. 2018).
All 16 glaciers in North America had negative balances. All four glaciers in Arctic Canada had mass balance losses under 1 m w.e. In western Canada and Washington and Montana (United States), all 16 glaciers reporting had losses exceeding 1 m w.e. The Ice Worm Glacier (Washington) was listed as extinct in 2023 after 40 years of continuous observations (Pelto 2024). In 2024, loss from the relict ice (ice that is no longer moving or part of a glacier) was 2.4 m and melt runoff below the glacier had decreased similar to Conejeras Glacier (Pelto and Pelto 2025). In Alaska, all three glaciers had mass balance losses. Davies et al. (2024) examined the Juneau Icefield, the most observed icefield in Alaska in terms of mass balance, and found an acceleration of mass loss with a doubling after 2010 compared to 1979–2010.
Easton Glacier, Washington extensive retreat since 1990, with last five years being the most rapid. Terminus and mass balance surveyed annually and reported to WGMS.
Alpine annual mass balance glaciological observations are reported to the World Glacier Monitoring Service (WGMS) by national representatives with a 1 December annual submission deadline. WGMS reference glaciers have at least 30 continuous years of mass balance observa-tion. Benchmark glaciers have at least a 10-year mass balance record and are in regions that lack sufficient reference glaciers. The combination of benchmark and reference glaciers is used to generate regional averages (WGMS 2023). Global values are calculated using a single averaged value for each of 19 mountain regions, limiting bias from observed regions (WGMS 2023). As this dataset expands, the annual values are reanalyzed and updated.
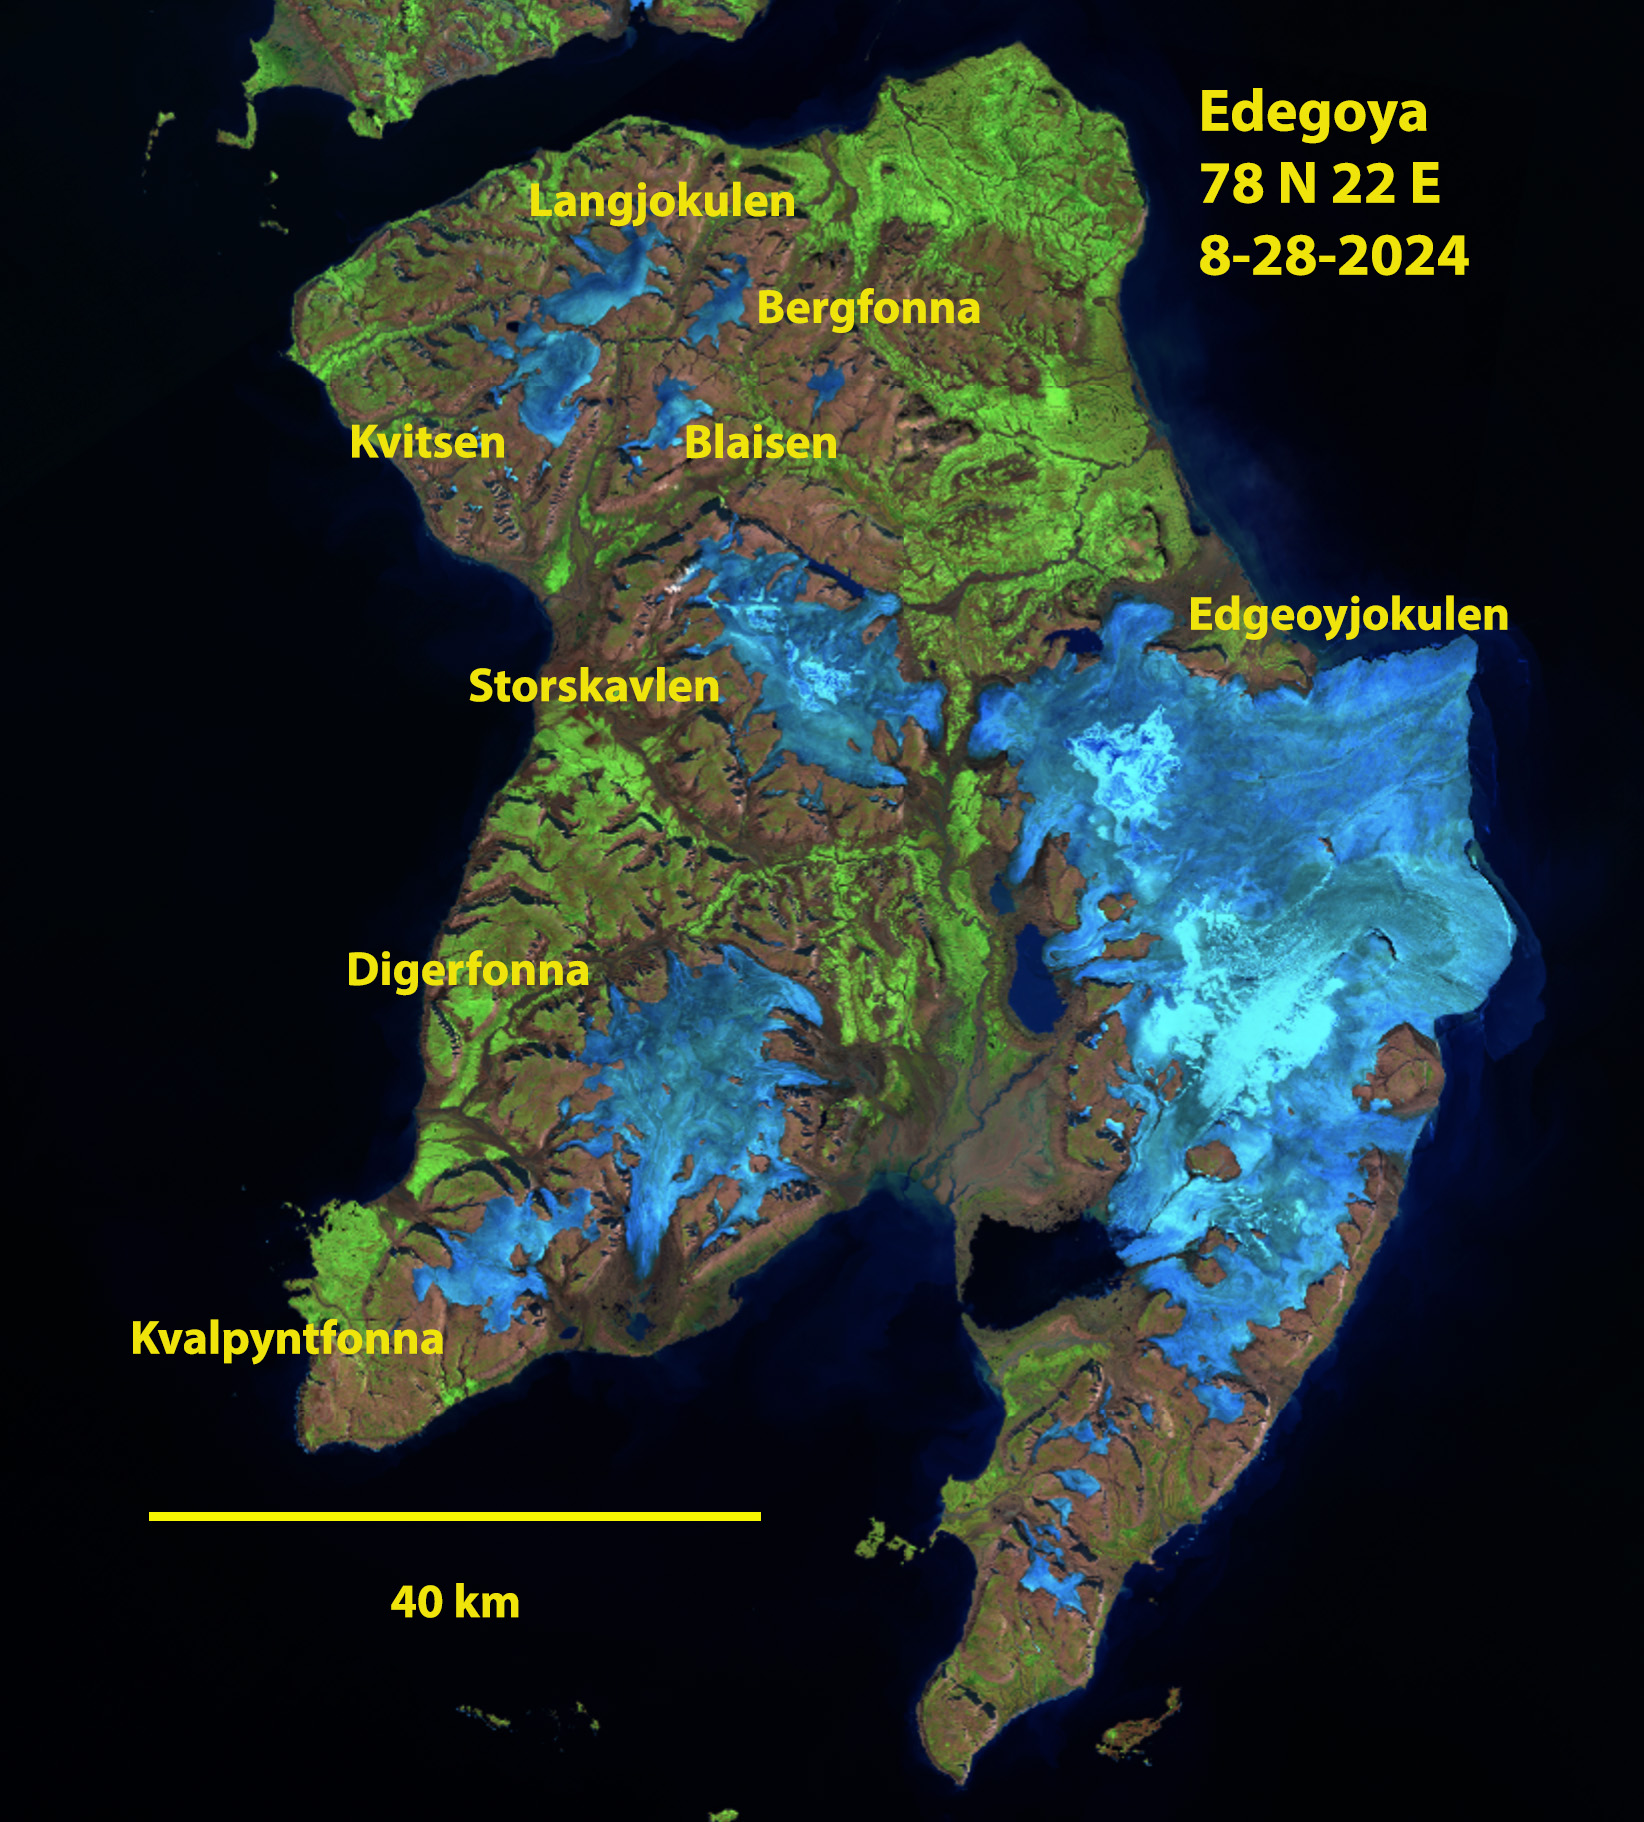
The lack of snow pack at the end of summer is evident across Edgeoya in Svalbard, blow a closeup of Digerfonna further illustrates with lettered points indicating new bedrock areas that are expanding amidst the ice cap.
March 21, 2026 was World Day for Glaciers, telling this story is an ongoing four decades long project for us. The North Cascade Glacier Climate Project began in 1984 to identify the response of Washington’s North Cascade glaciers to climate change. The 2026 field season will mark our 43rd year of observations.
I co-direct the project as the science director, with Jill Pelto as the art director. We strive to create a diverse and collaborative portfolio of impactful observations connecting people to science through art and data publication. Our theory of change is that art has the power to inspire people by including the emotional context behind the science research. We seek collaborators who are passionate about contributing to and sharing this work. Here we reflect on some of the stories we have shared in the last 12 months that chronicle the rapidly melting reality of glaciers.
In April, 2025 the “Shaped by Ice” exhibit coordinated by Jill Pelto opened at the Slip Gallery in Seattle. This featured work from nine artists, eight of whom had been in the field with us and was the focus of a Seattle Magazine article.
In May we worked with Protect Our Winters to explore what the loss of glaciers, “Beyond the Ice” means for specific regions.
In June, High Country News focused on the use of art to preserve the legacy of glaciers, given the glaciers themselves are not being preserved.
In March through July we worked with the Global Glacier Casualty List to the tell the story of specific glaciers in the United States that are disappearing, including Ice Worm Glacier in the North Cascades, Darwin Glacier in the Sierra Nevada, Twins Glacier in Wyoming and Burroughs Glacier in Alaska.
In August our field season coincided with a Seattle Time report, on Melting Mountains in the Pacific Northwest means, that we collaborated on.
Joining us in the field on the Lower Curtis Glacier, Mount Shuksan was KING5 NBC-Seattle affiliate, led by Meteorologist Leah Pezzetti who backpacked with us into her first glacier. The logistical preparation for this by KING5 was thorough, and we provided guidance and support to them. The resulting feature was released while we were still in the field.
Upon returning to the trailhead from Lower Curtis Glacier a CBS Sunday Morning News team met us and travelled into the field with us to Sholes Glacier, Mount Baker. The overnight trip into the backcountry was a first for this news team and required extensive collaborative support. The results were shared just two weeks after the filming, and right after our field season.
We worked for a second year with Dan MacComb on a short film for the UN International Year of Glaciers’ Preservation called “Shaped by Ice”. This film published by Protect our Winters has been featured in tfour film festivals during 2025.
In January through February a second “Shaped by Ice” gallery event was held in at the Confluence Gallery in Twisp WA. This was spearheaded by Jill Pelto, Margaret Kingston, and Claire Waichler.
A poor winter snowpack will certainly lead to another year of extensive glacier loss across the Pacific Northwest and we will be there to observe it.
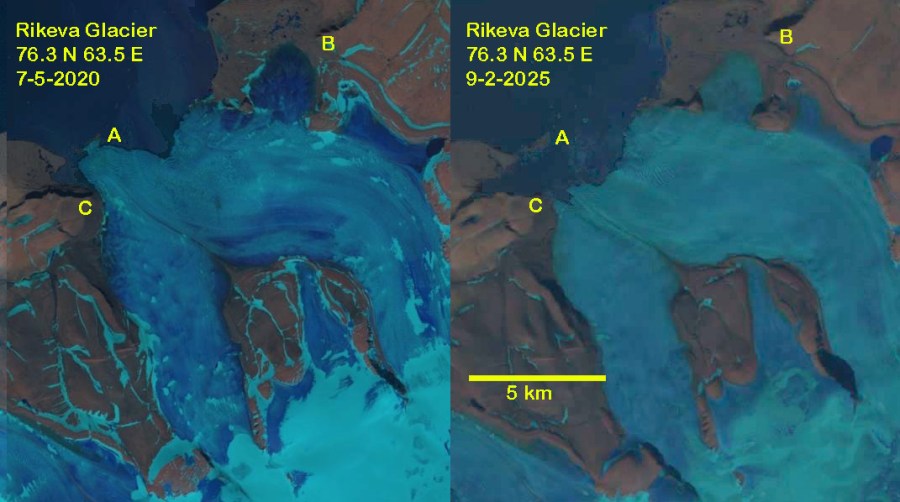
Rikeva Glacier retreat in Landsat images from 2020 and 2025. Illustrates new island at Point A and retreat of land terminus at Point B and from headland at Point C.
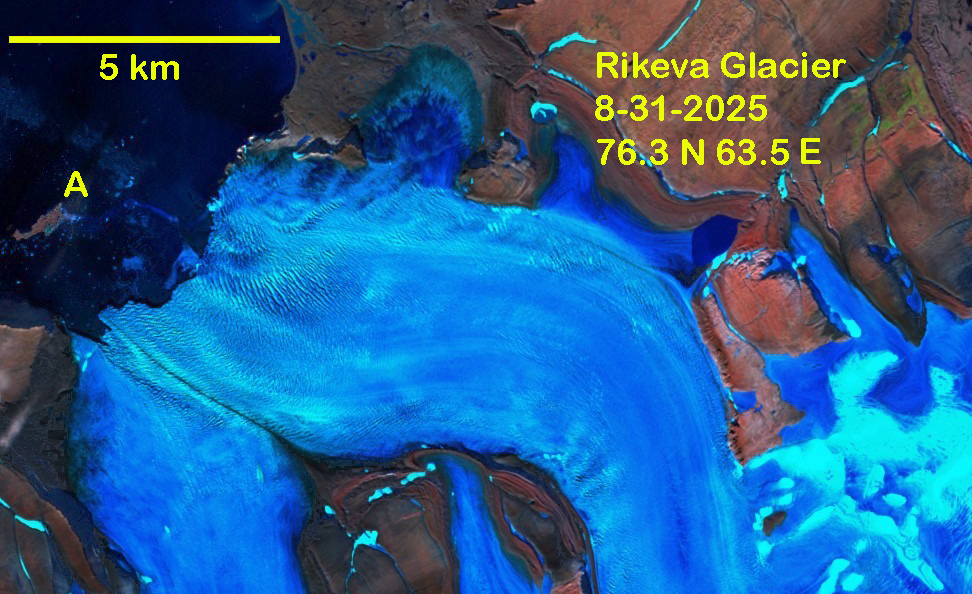
Rikeva (Rykacheva) Glacier flows from the Northern Novaya Zemlya Ice Cap to the west coast and the Barents Sea. The glacier has been retreating rapidly like all tidewater glaciers in northern Novaya Zemlya (Pelto, 2016) (Carr et al 2014) identified an average retreat rate of 52 m/year for tidewater glaciers on Novaya Zemlya from 1992 to 2010. Maraldo and Choi (2025) identified frontal retreat rate of Novaya Zemlya glaciers from 1931-2021 and found an increased each decade since the early 1970s, reaching a peak retreat rate of 65 m/year between 2011 and 2021. We have observed the impact at Vilkitskogo Glacier and Krayniy Glacier,
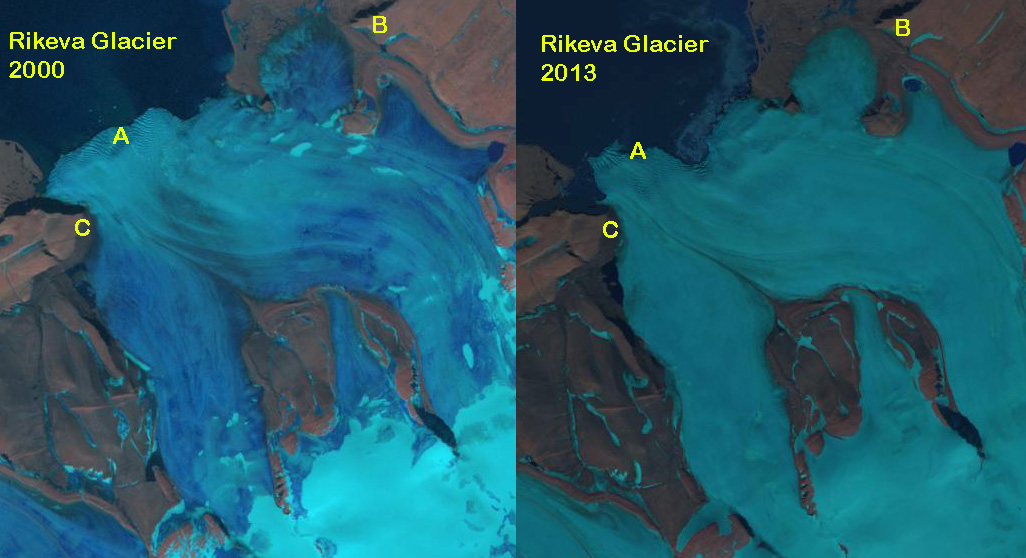
In 2000 Rikeva Glacier extended beyond the island that would emerge at Point A. The landbased terminus lobe extended just beyond Point B. By 2013 the glacier had retreated adjacent to the island, with the island acting as a stabilizing point for the terminus. The terminus lobe had retreated just south and east of Point B.
Rikeva Glacier in Landsat images from 2000 and 2013 illustrating retreat to island at Point A and retreat of land terminus at Point B.
In 2018 Rikeva Glacier terminus rested on an island at Point A that acted as a buttress for the glacier terminus. By 2025 the glacier had retreated from the island with 4.5 km2 of glacier retreat since 2018 and 8 km2 of retreat since 2000.
Rikeva Glacier in Sentinel images from 2018 and 2025 illustrates retreat from Island at Point A.
Twins Glacier in Sentinel 2 images late in the melt season in 2021, 2023, 2024 and 2025. The darker blue is bare ice and the light blue is snow cover. This illustrates the lack of significant snow covered area each of these summers.
Twins Glacier in the Wind River Range of Wyoming is nestled on the north side of a ridge extending from Winifred Peak to The Buttress, in Titcomb Basin. Titcomb Basin is high alpine basin that lacks trees and has many alpine lakes. The basin was named for brothers Charles and Harold Titcomb, who were some of the first to explore the area in 1901. The Wind River Range was inhabited by the Sheepeater Shoshone (Tukudika) tribe as far back as 2000 BC. This tribe relied on bighorn sheep as a key staple and did not utilize horses, both adaptations useful for alpine terrain. Fur trappers were active in the region going back to the 1830s including Charles Fremont for which Fremont Peak on the east side of the basin is named. Titcomb Basin remains popular with climbers today.
Devisser and Fountain (2015) identified Wind River Range glaciers lost 47% of their area from 1900-2006. Li et al (2025) indicate a thinning rate of 0.58 m/year on Wind River Range glaciers from 2000-2019, representing a cumulative loss of 11.6 m. The loss from 1968-2000 had been -0.08 m/year. This accelerated thinning this century has led to rapid area losses across the range. The mean June-September temperature for the Wind River (Wyoming-Division 9) rose 1.2oC from 1900 to 2024. The mean June-September temperature exceeded 16.5oC five times from 1900-1999 and nine times from 2000-2025. During the 1900-2024 period there is no trend in November-April total precipitation for the Wind River Division. It is the frequent warm summers that have accelerated glacier loss.
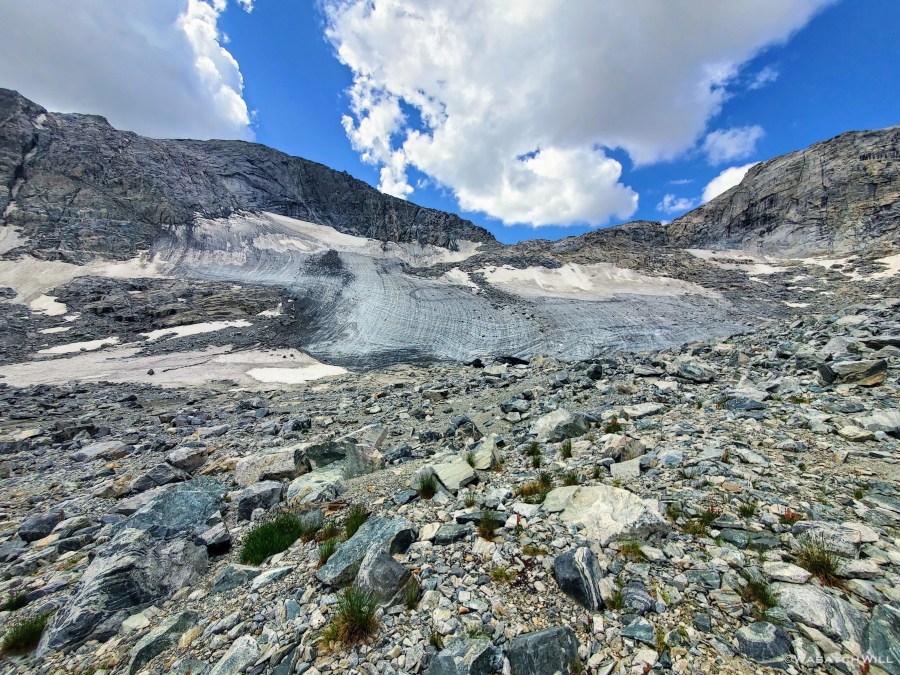
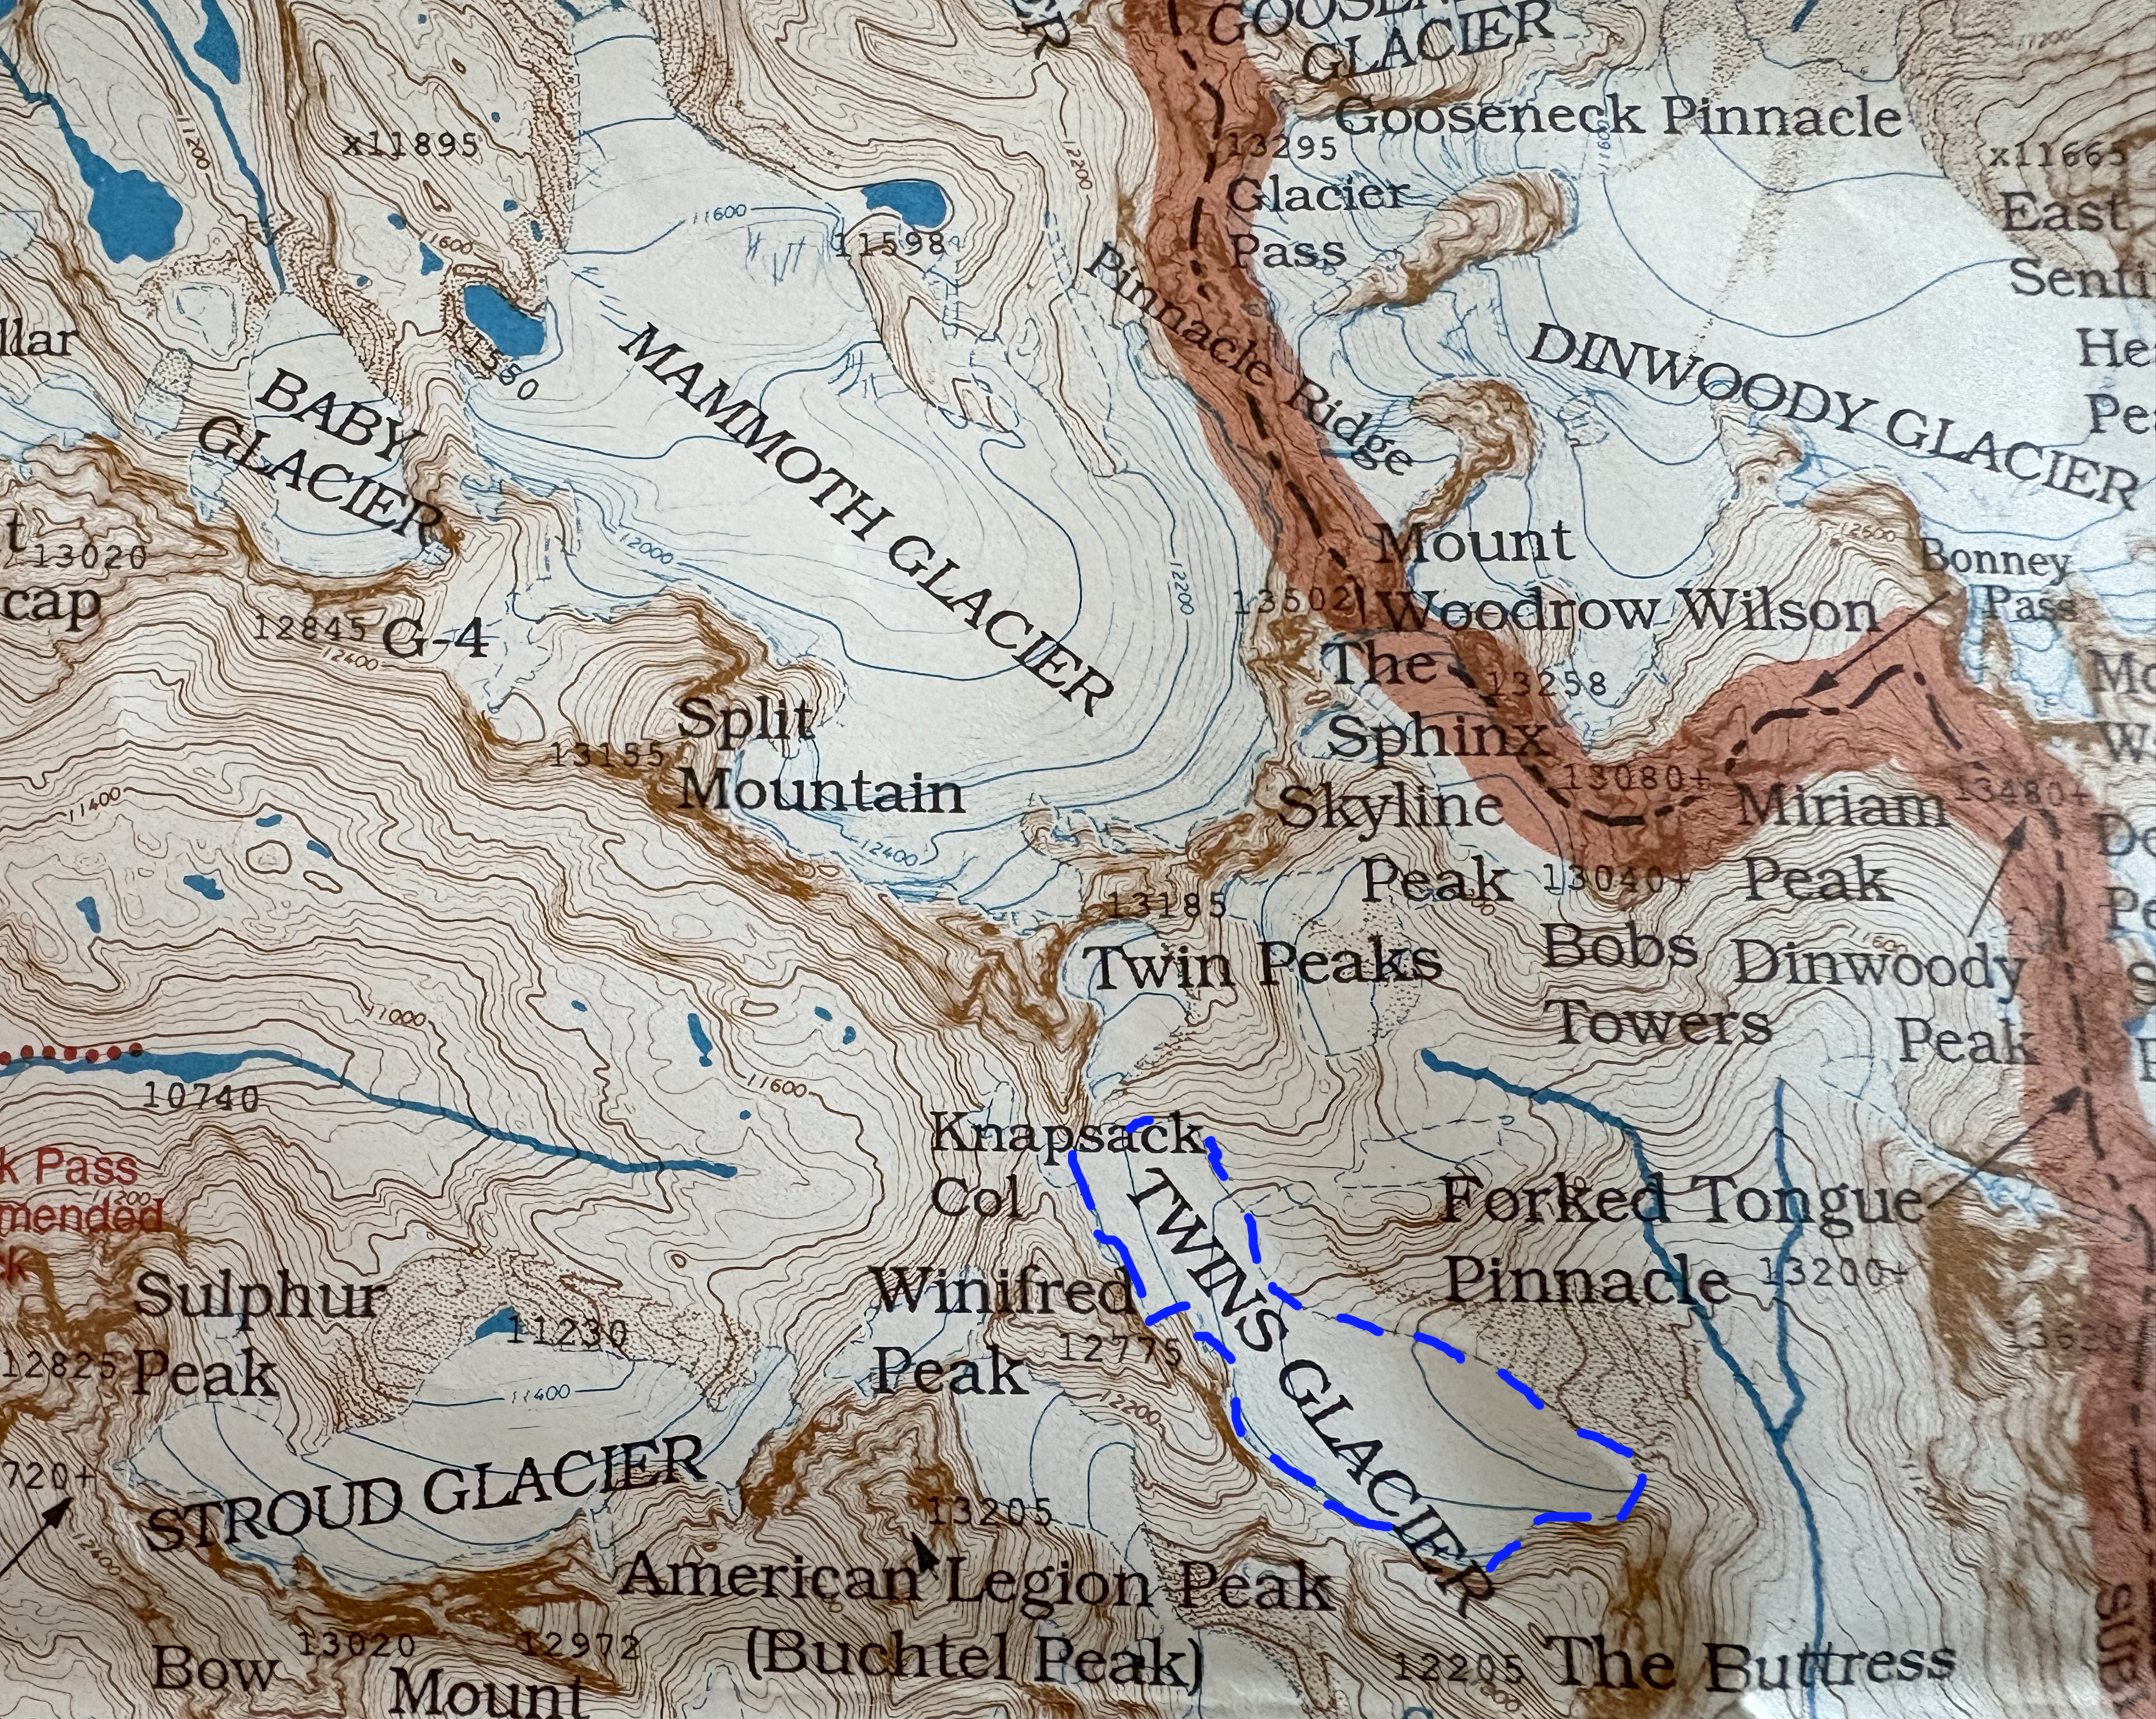
Twins Glacier in 1966 spread broadly across the mountain slope from Knapsack Col to The Buttress and had an area of 0.49 km2 (GLIMS). The glacier extending close to the top of a rounded ridge does recieve wind enhanced snow deposition, but no avalanching. By 2015 the area had declined 75% to 0.13 km2 and was primarily confined to an area below The Buttress (Fountain et al 2023). The 2013 image (from Bob Sihler) below illustrates a lack of snow or firn cover which indicates there is no longer a persistent accumulation zone, without which a glacier cannot survive (Pelto, 2010). From 2021-2025 each summer the glacier has lost all snow cover indicating it no longer has an accumulation zone. This has led to rapid thinning and development of a bedrock ridge that has nearly separated the glacier, note 2021 image (from Will Wickert). In 2025 the glacier lost all snowcover and was fragmenting into two sections with an area of 0.05 km2 and 0.03 km2 respectively. The ~50 visible annual layers indicates ice in the glacier is all from the last 75 years. The glacier is almost disappeared. The fragmentation and acceleration of area loss indicates this glacier cannot endure several more years of warm conditions that eliminates snow cover.
Twins Glacier outline in blue on USGS map based on 1966 aerial photographs. Glacier extends from Knapsack Col to east end of The Buttress.
Twins Glacier in 2013 seen from the northeast nestled below The Buttress. The diagonal bedrock ridge that is now fragmenting the glacier is not yet evident. The lack of snow or firn cover illustrates the glacier is not retaining snow cover. This image taken by Bob Sihler.
Twins Glacier in 2021 indicating rock rib extending diagonally across the glacier. There is limited retained snow or firn cover with a month left in the melt season. There are ~50 visible annual layers. The thin nature of the glacier is also evident. This is an image taken by Will Wickert.
Core field team in 2025 Emmett Elsom, Mauri Pelto, Jill Pelto and Caitlin Quirk.
We hiked into North Cascade glacier to complete detailed observations for our 42nd consecutive year. These annual observations provide a detailed assessment of their response to climate change. For the third consecutive year North Cascade glacier on on average lost more than 2 m of glacier thickness. This cumulative loss of 7-8 m on most of the ranges glaciers that average 25-40 m in thickness represents 20% of their volume lost in just three years. On a few of the largest glaciers, such as those on Mount Baker that average 40-60 m in thickness the loss represents 12% of their volume lost.
The consequence is an acceleration of the collapse of the North Cascade glacier system. This landscape that has for long been shaped by ice is rapidly losing that glacier element. The rate of retreat for the glaciers we work on has accelerated so quickly that we are faced each year with changing terrain and new challenges. Beyond that, we are starting to really see the effect this retreat and the decrease in water has on the ecosystems both near the glaciers and further downstream. During the field season we love seeing the wildflowers, eating blueberries, and counting mountain goats. These are all parts of a habitat that is built around glaciers and snowpack. Seeing these shifts has been really difficult, but it helps to still return to these landscapes and continue to tell their stories through science and art. Below the story is told in images with captions by each of us who participated.
Two things that stood out during the 2025 field season were the strength of our collaborations, and the changing resources the glaciers are able to provide to the surrounding ecosystem. This visible change attracted the attention of KING5-Seattle NBC affiliate and CBS Morning News. At the bottom of this post the resulting footage is embedded. The film “Shaped By Ice” Jill and I worked on with Dan McComb has been a finalist in two recent film festivals, this footage also at bottom of this long read post.
Working on Rainbow Glacier from left-Katie Hovind, Caitlin Quirk, Claire Seaman, Jill Pelto and Margaret Kingston
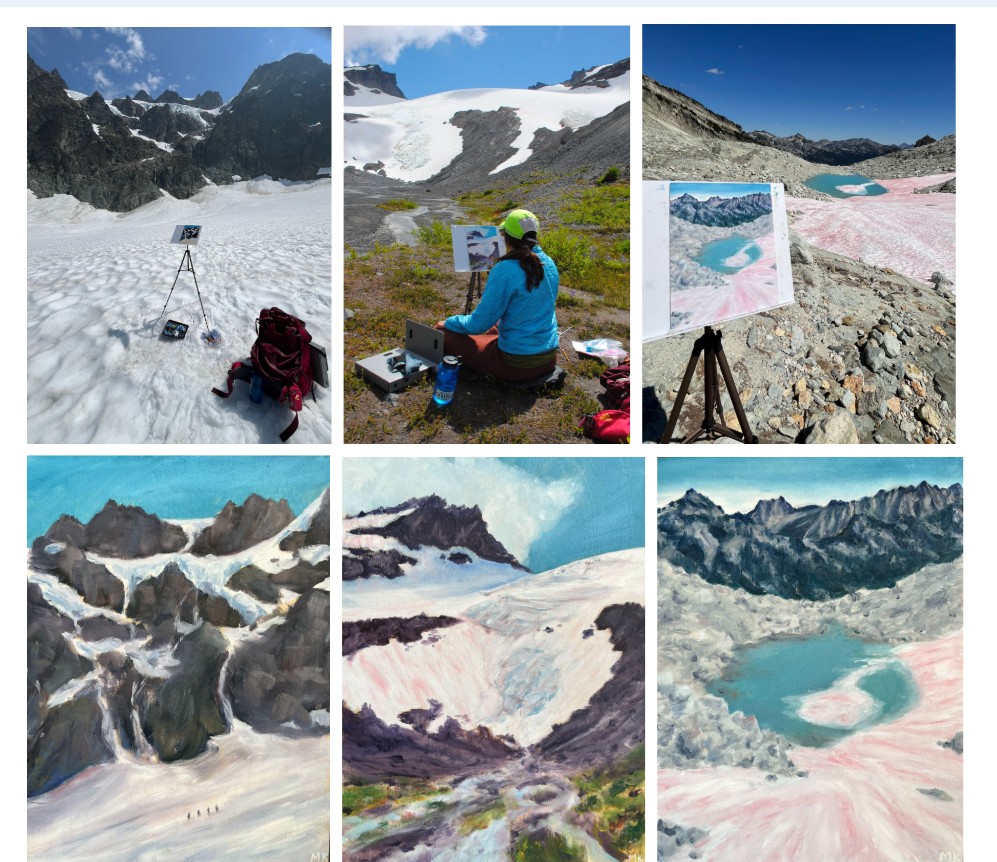
We worked with two oil painters, one watercolor painter, one printmaker, two news film crews, a team of botanists, and more. The result of all these collaborations has led to so many great stories being created and shared about our collective work. It also meant our core group of field assistants had to be flexible to a changing group and the sometimes difficult and imperfect logistics that accompany that. -Jill Pelto
This photograph of an icefall at 2000 m (6700 ft) on the Easton glacier encompasses the wide range of emotions that I felt working on these glaciers this summer. The focal point of the picture is the wound inflicted upon the glacier by our changing climate. Bedrock and sediment creep through the gaping wound in the lowest icefall of the Easton, the opening visible for the first time in the project’s 42-year history. The place also holds a beauty, a sense of majesty that cannot be diminished by the tragic context of our work. The seracs at the top of the scene lean at impossible angles, destined to crash down onto the slope below, piercing the quiet of the snowy expanse in dramatic fashion. The dark annual layers in the glacier speak to the age of the ice, flowing down the flank of Mt. Baker over decades. The landscape has been a facet of my life for the past few years, as it falls upon the Easton Glacier route to the mountain’s summit. The icefall has always drawn me in as I pass, sparking a profound sense of wonder. It makes me deeply sad to see the beauty of such special places diminished, sad in a way that little else does. Over the past few years, I’ve come to like visiting these places to visiting an elderly loved one. While time may change them and even take them away from us, their beauty and meaning to me will hold true.-Emmett Elsom
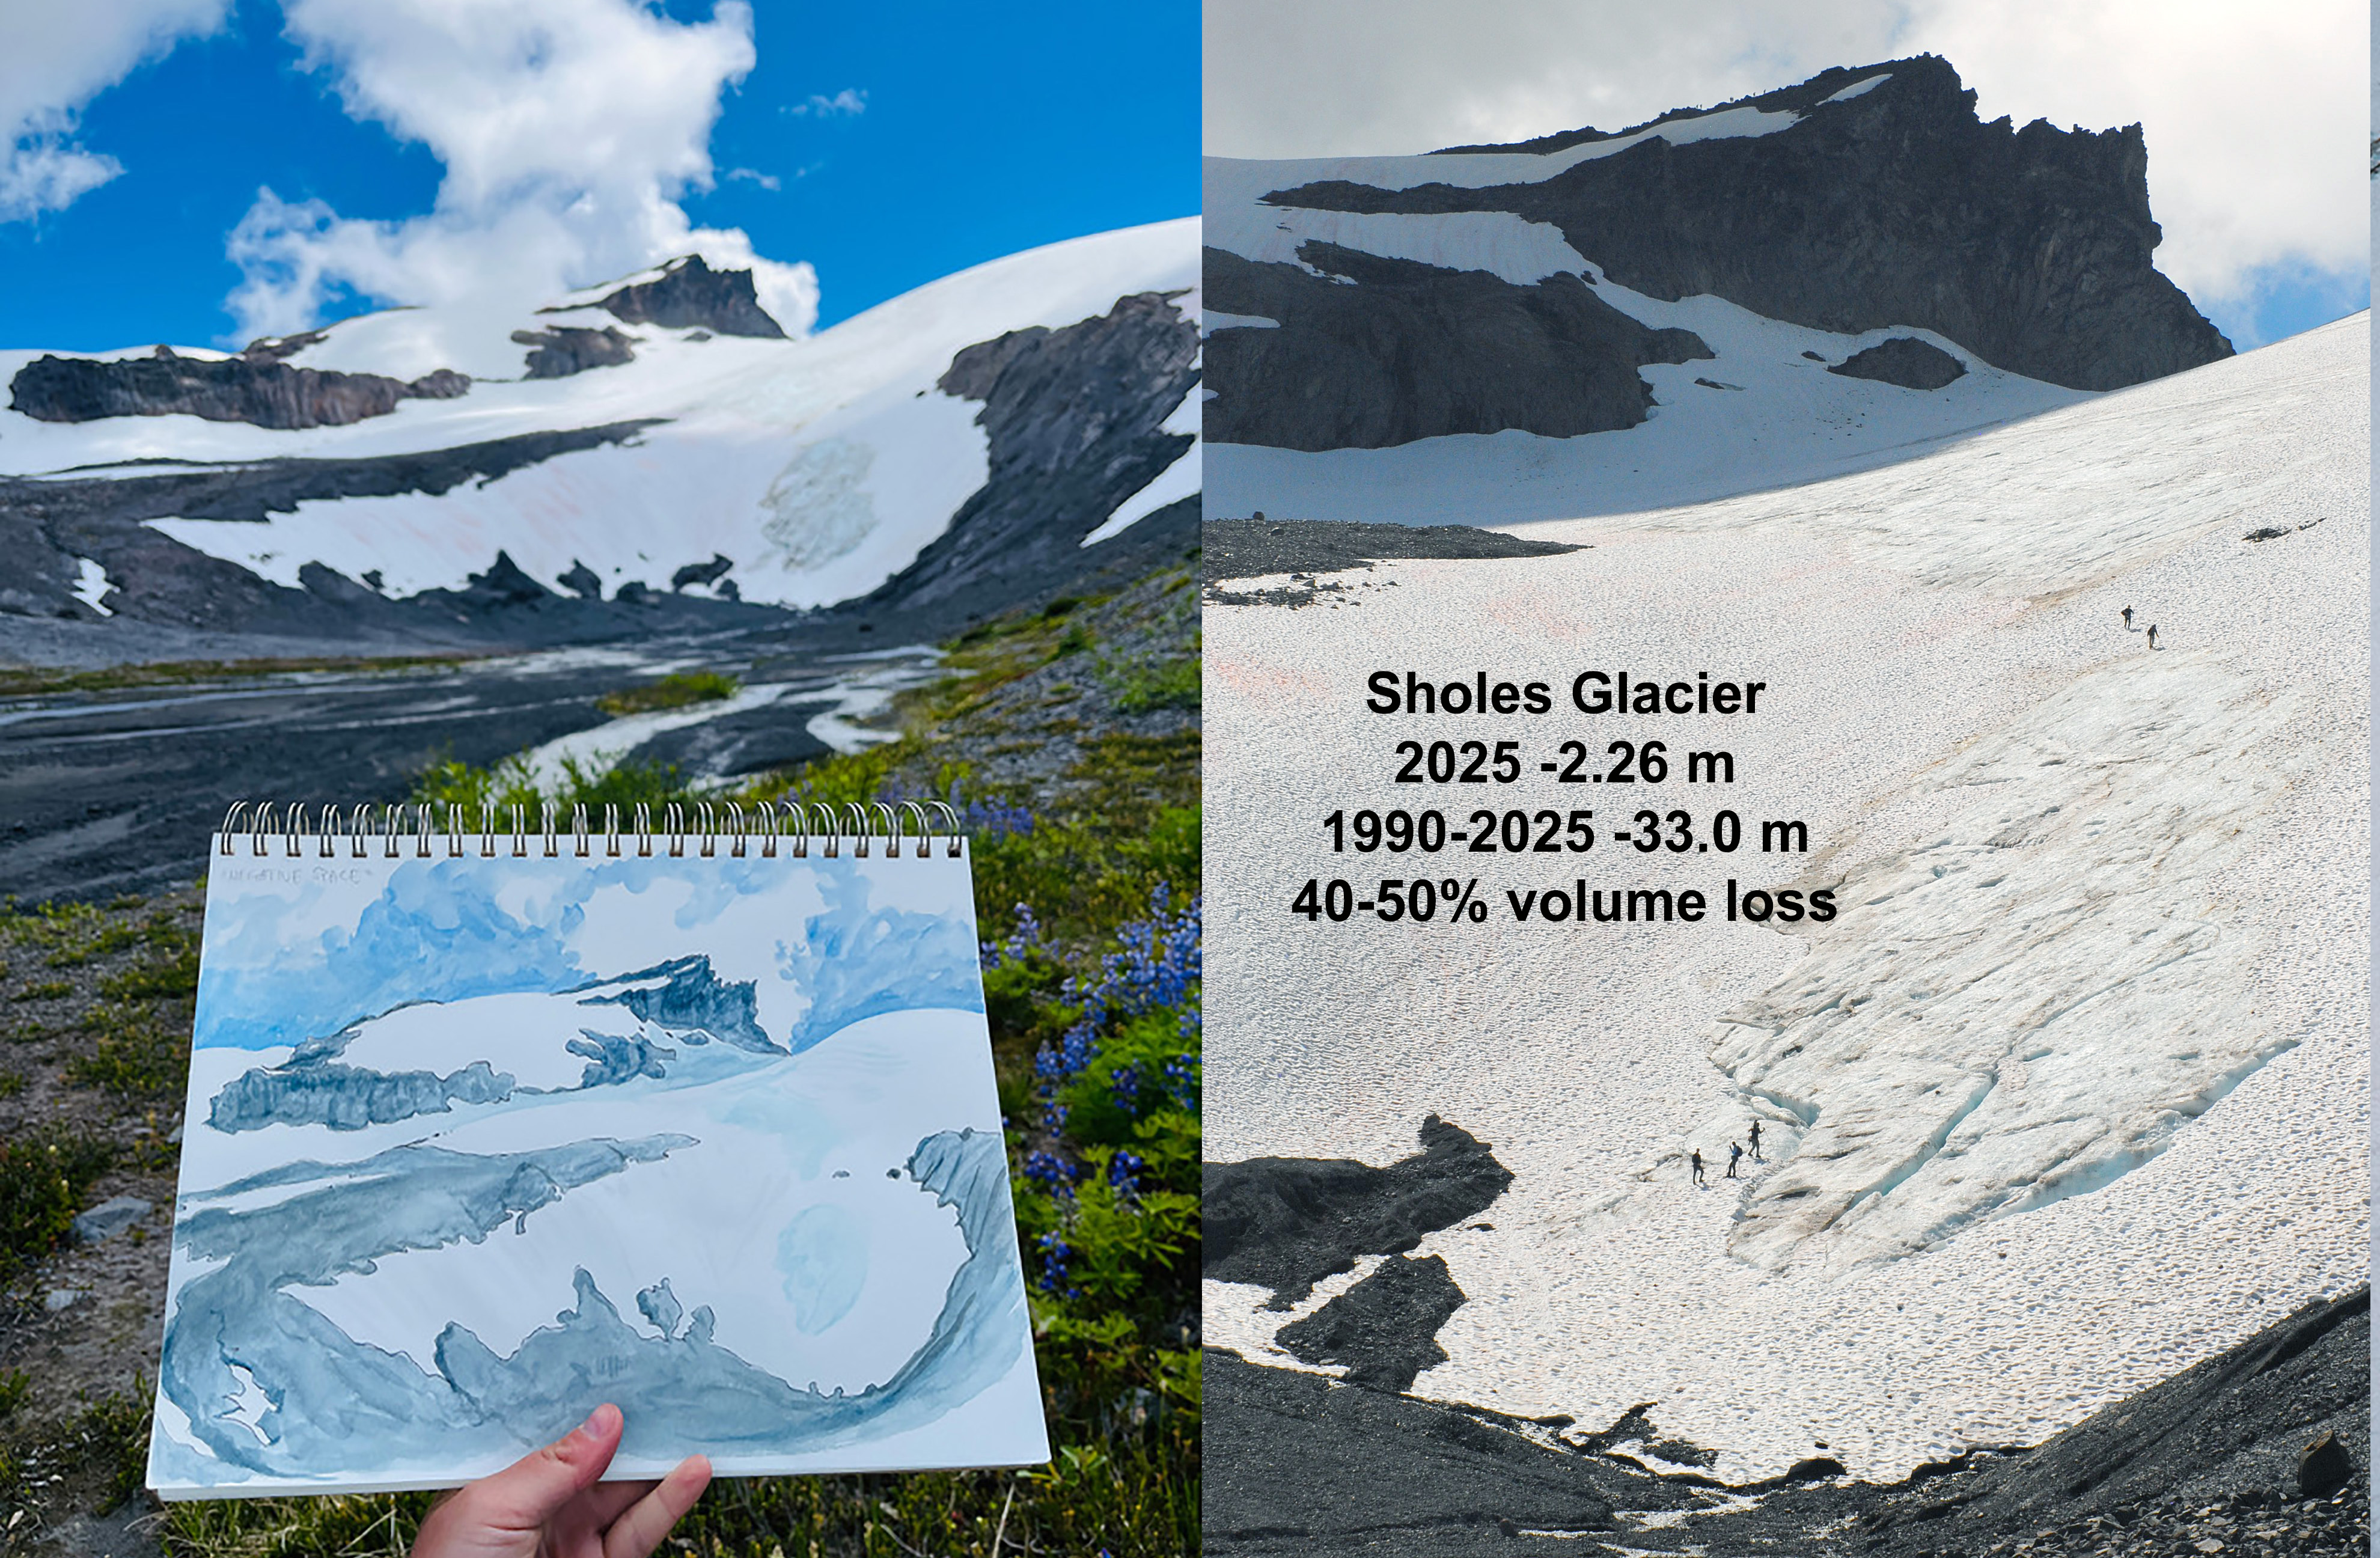
How does being present in a place shape our understanding? To the left is a view of Sholes Glacier, complete with my on-site rendition. I can’t express how lucky I feel to have had the chance to experience these places first hand. To interact with a place by attempting to capture its likeness — paying attention to the negative space not only between the white snowpack and black exposed rock, but in the empty, carved-out area that used to be filled with ice. Experiencing the texture of the glacier under your feet, the cool air drifting off the snow, the good tired feeling of your body after physically traversing top to bottom. This is what you don’t get from a photo. To know places such as these is to love them and see their role in the world, and want to protect them. But so many never get the chance to understand them this way.-Claire Seaman
This field season I focused on exploring the once-barren foreland a glacier leaves behind. Studying the plants growing in the wake of the Easton Glacier made me reflect on the way life responds to these major changes. This photo of a bright monkeyflower cluster in the streambed of the nearby Sholes Glacier exemplifies this resilience and optimism to me. The Sholes, in the background, drains a lifeblood that will feed the watershed downstream into the Nooksack, supporting people, fisheries, and a whole riparian ecosystem. The eventual loss of glacial ice feeding the river will be catastrophic, yet the scarred space left behind will blossom with vegetation. Witnessing firsthand how staggering the extent of glacial retreat is can be overwhelming, but that bright patch of flowers stands as encouragement. Alone in an altered landscape, those flowers will pave the way for more to follow. Change is nuanced, and as we watch it occur we can change, sharing stories of the beauty of this environment supported by ice, and adapting our lives and policies in a way that can be the difference which keeps glaciers flowing.-Katie Hovind
As a backcountry skier and oil painter focused on winter landscapes of the North Cascades, the idea of painting glaciers in the field was a dream come true! I knew what we would see and learn about the health of our glaciers from the scientists would be highly emotional, but the power of these environments disappearing in our lifetimes is something my words fail to communicate how devastating that feels. During the study on Rainbow glacier I caught on film the moment a serac collapsed, loudly crashing, crumbling from a newly melted out rock knob down the mountain splitting into smaller and smaller pieces. It looked sickly as it broke before our eyes. Another unique experience was going into a teal, translucent, otherworldly ice cave. I have started 2 paintings to capture this vanishing environment. My goal is to assist the project in translating the study’s findings through landscape paintings that communicate the beauty of these places with titles that call attention to the retreating glaciers in the North Cascades. We all have a responsibility as humans to make individual changes to combat climate change and vote like fresh water and air depends on it, because it does. -Margaret Kingston
The pace of glacier change struck me hard this summer. Never before have humans lived with such a deglaciated Cascades mountain range. Not the settlers, not the fur trappers, not the first people who have been here for 13,000 years or more. Cultures and ecosystems spawned from the retreating edge of the Cordilleran Ice sheet into the Puget Sound area. Alpine glaciers fed streams, rivers, salmon, all kinds of human projects in Washington State. Our societies are shaped by the ice and now we are experiencing glaciers disappear.
I write this at the end of the 2025 hydrological year, waiting for winter snow to shelter the land I love in a cool white blanket. The devastation of the alpine glaciers has surfaced so frequently in conversation these last couple months. Those who have seen the mountains are alarmed as beds of ice they once knew to be hundreds of feet thick look shallow and frail, ice pitches that were once climbed are now grey gullies of rock, and volcanoes which have always been white are unnervingly gray and shrouded in smoke. The realities of climate change in the Northwest are clear.
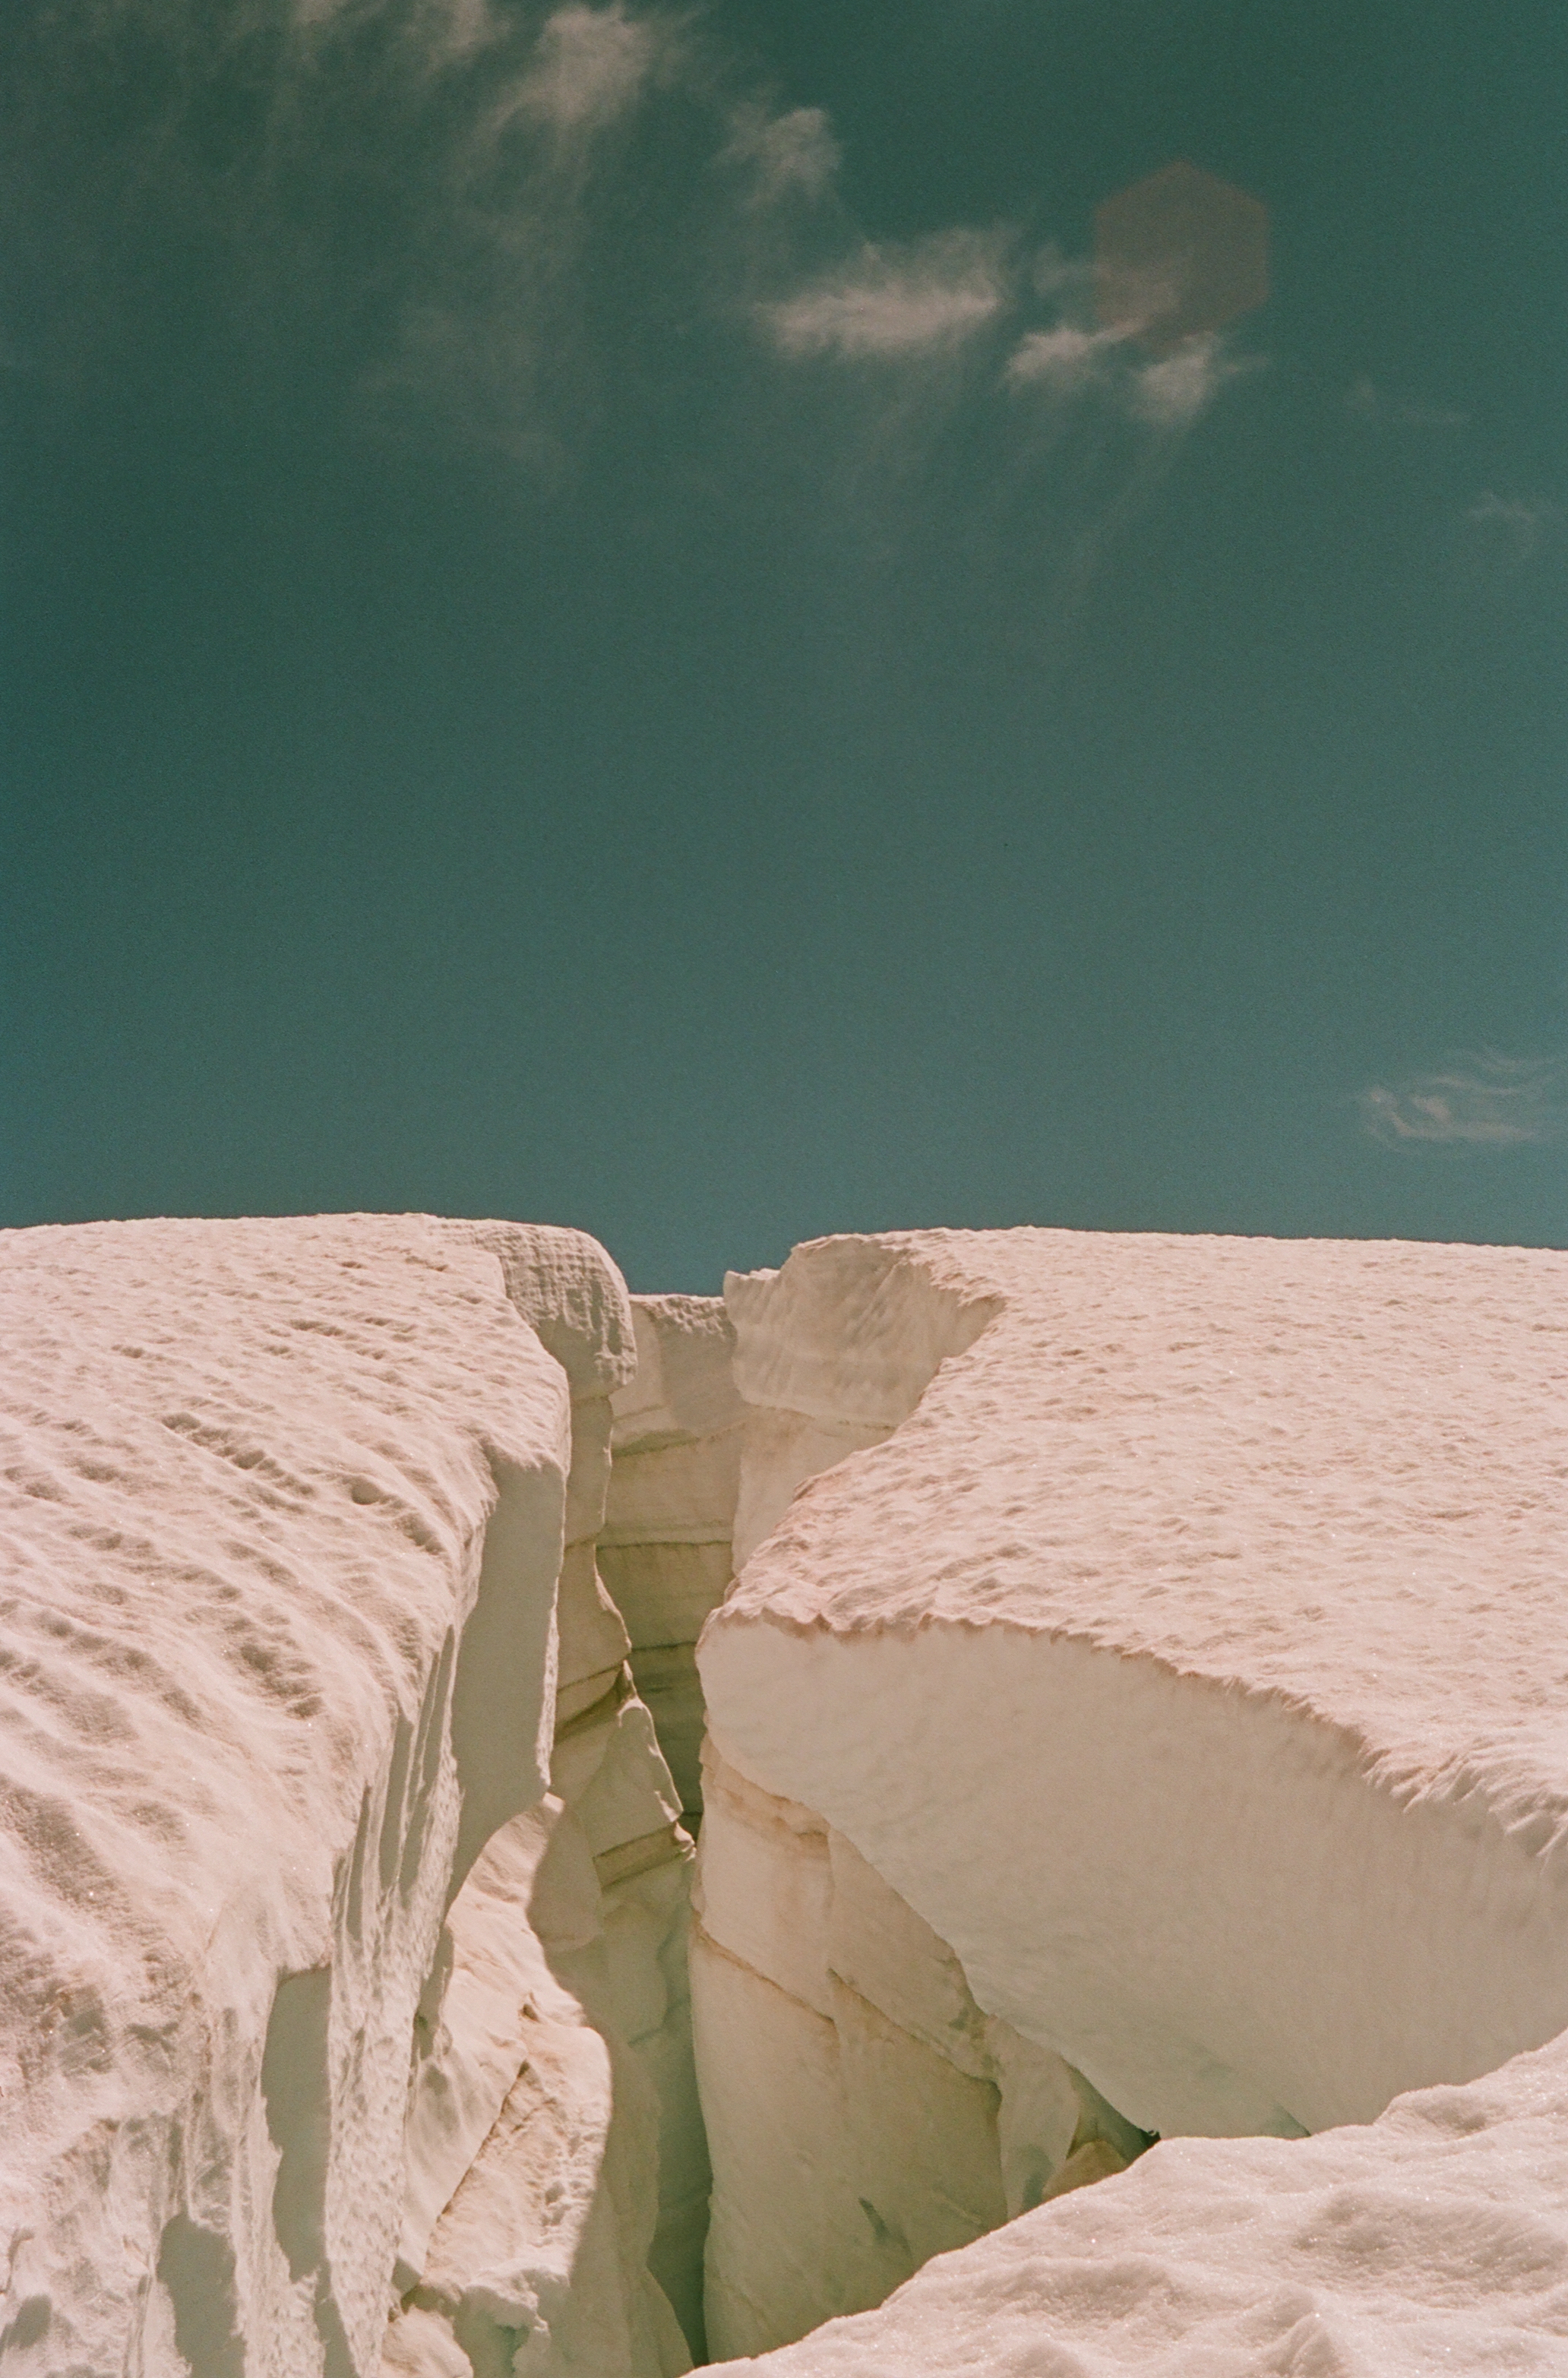
It is a painful time to care about the glaciers of the Cascades. Witnessing the erosion of something so much older and bigger and impactful than myself is staggering. There is much action to be done in this new terrain but for now, I come back to this: I sit in the dying glaciers warm light as the sun rises, summon the deepest snowfall in years and tell the glacier that we care, that we were grateful for all the help watering our food and feeding our oceans and making sure our salmon had somewhere to live. We are here because of you. -Cal WaichlerImage description: This image shows a crevasse on the Easton Glacier of Mount Baker. The saturation is distorted because I shot this photo on 35mm and pre-exposed the film to light and heat to parallel the material effects of global warming on our glacier systems. The Easton glacier is a source of water for Baker Lake, which provides recreation and hydropower to the region. When I see this photo, I think of the impacts of glacial melt to water, energy, cultural, and economic resources in Washington. -Caitlin QuirkColumbia Glacier is one of sixty global reference glaciers. This summer it lost 5% of its volume.Lower Curtis Glacier continues to rapidly thin at the top of the glacier as well as at the terminus. The glacier retained additional avalanche accumulation, leading to a less negative balance than other glaciers.Rainbow Glacier is one of the sixty global reference glaciers. This year new bedrock began to emerge and expand in several icefalls, leading to serac fall.Easton Glacier has retreated 700 m since 1990 and has a number of bedrock areas emerging in icefall up to 2500 m.Lynch Glacier east and west side are separating. The upper basin did retain some snow in 2025.Daniels Glacier lost all snowpack by the end of the summer and bedrock is quickly expanding amongst the glacier.
The trajectory for most North Cascade glaciers is one of fragmentation. This is illustrated by Foss Glacier on the east flank of Mount Hinman, that we began observing annually in 1984 but stopped measuring as it fragmented.Foss Glacier from the top was a 1 km long and nearly 600 m wide glacier. In Sept. 2025 Cal Waichler captured view from the top with the two main fragments now less than 50 m wide and 300 m long.-Mauri Pelto
Leah Pezzetti KING5 meterologist hiked in with us to Lower Curtis Glacier.
The CBS team hiked into Sholes Glacier with usspending the night, and we had three generations of Pelto’s.