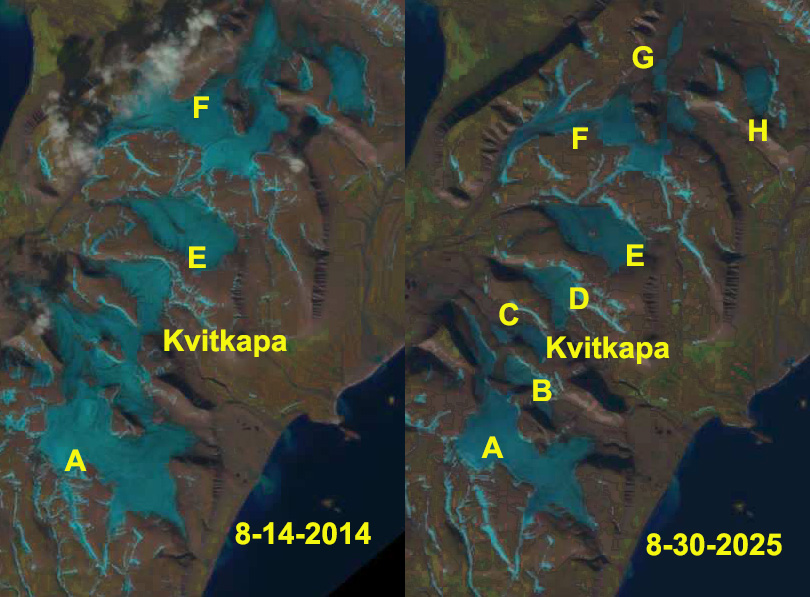
Kvitkapa in Landsat images from 2014 and 2025 indicating the fragmentation from 3 to 8 different glacier parts.
In 2022, 2023 and 2024 a number of ice caps and glaciers across Svalbard lost all snow cover, ie. Edgeøya 2022. The result by 2024 was that all firn cover had been lost as well on many of the ice caps of Edgeoya, such as on Digerfonna. This largely removes the ability of meltwater to refreeze. In 2025 we again see this playing out on the ice caps of Edgeøya. This all too familiar story indicates these glaciers lack a consistent accumulation zone that is essential for their survival
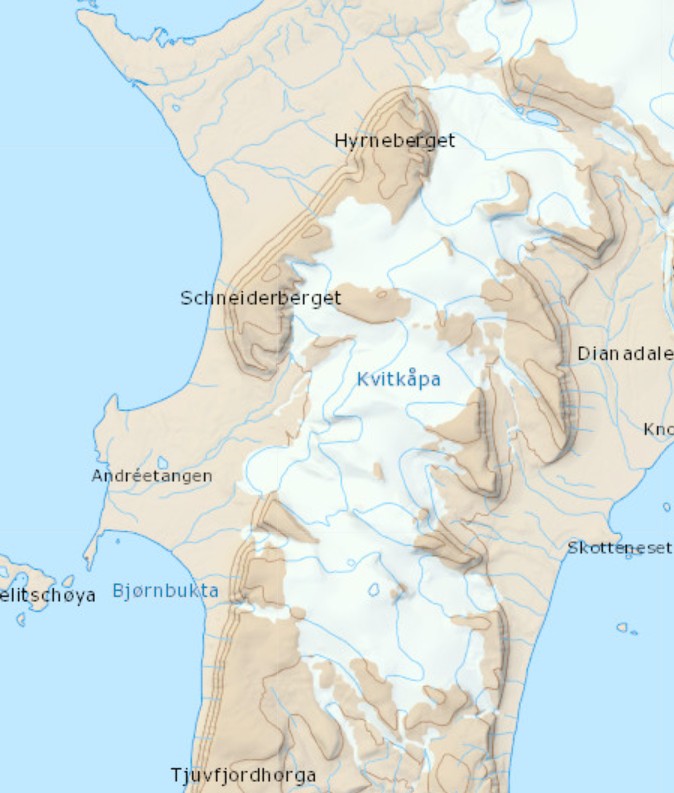
Map of Kvitkapa from TopoSvalbard indicating one interconnected ice cap in 2000.
Kvitkapa is an ice cap on a peninsula on the south coast of Edgeøya Island. In a map of this region from TopoSvalbard this is a single interconnected system of glaciers. By 2014 Landsat imagery indicates the ice cap has separated into three sections. By 2025 the ice cap has fragmented into eight different parts.
On the next peninsula to the east Kvalpyntfonna has also lost all snow cover again 2025.
Kvalpyntfonna in Landsat image from 2025 having lost all its snow coverand has no residual firn from previous winters either.
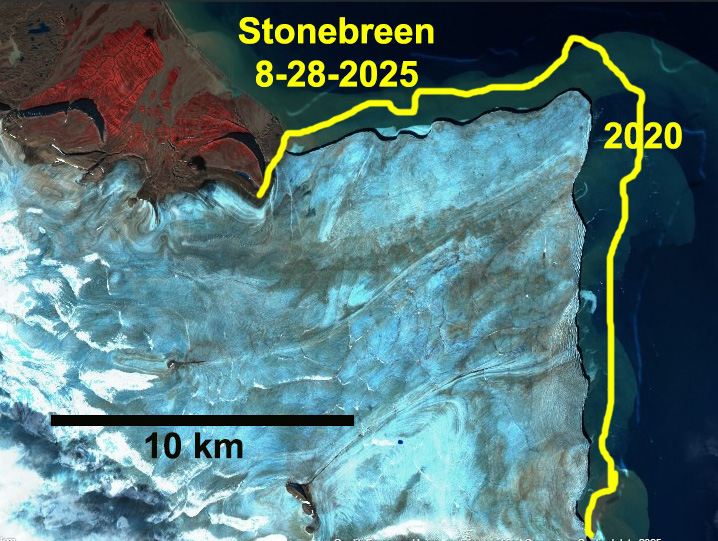
Further north and east on Edgeøya the Stonebreen ice cap has also losts its snow cover and firn cover driving thinning and retreat. The consistes loss of snow cover and resultant loss of firn cover, indicates that most ice caps Edgeøya cannot be sustained.
Stonebreen in false color Sentinel image illustrating retreat from 2020-2025. The lack of retained snow cover and residual firn will lead to continued rapid thinning and retreat.
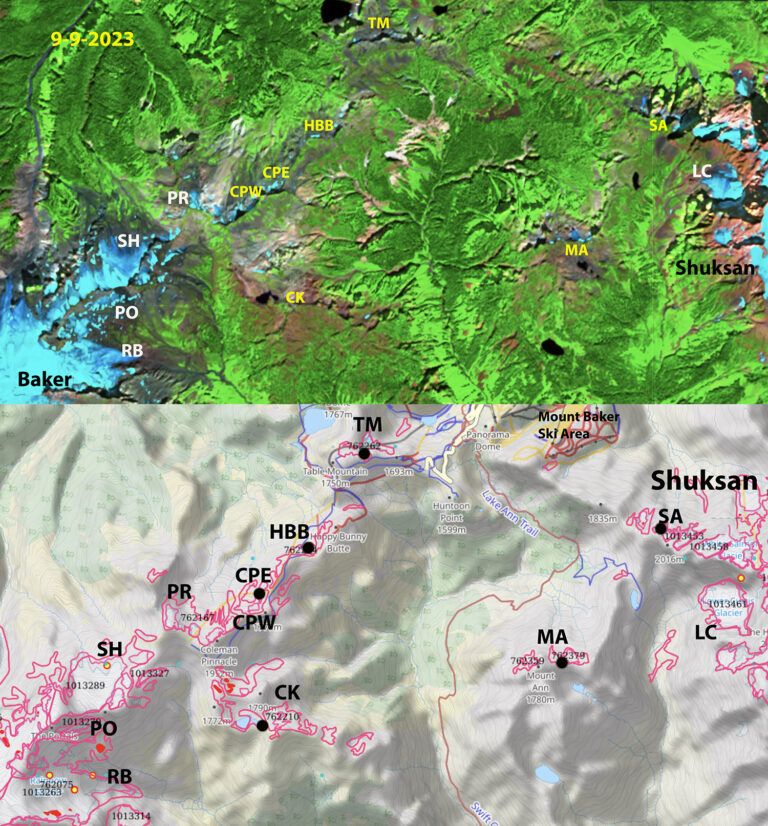
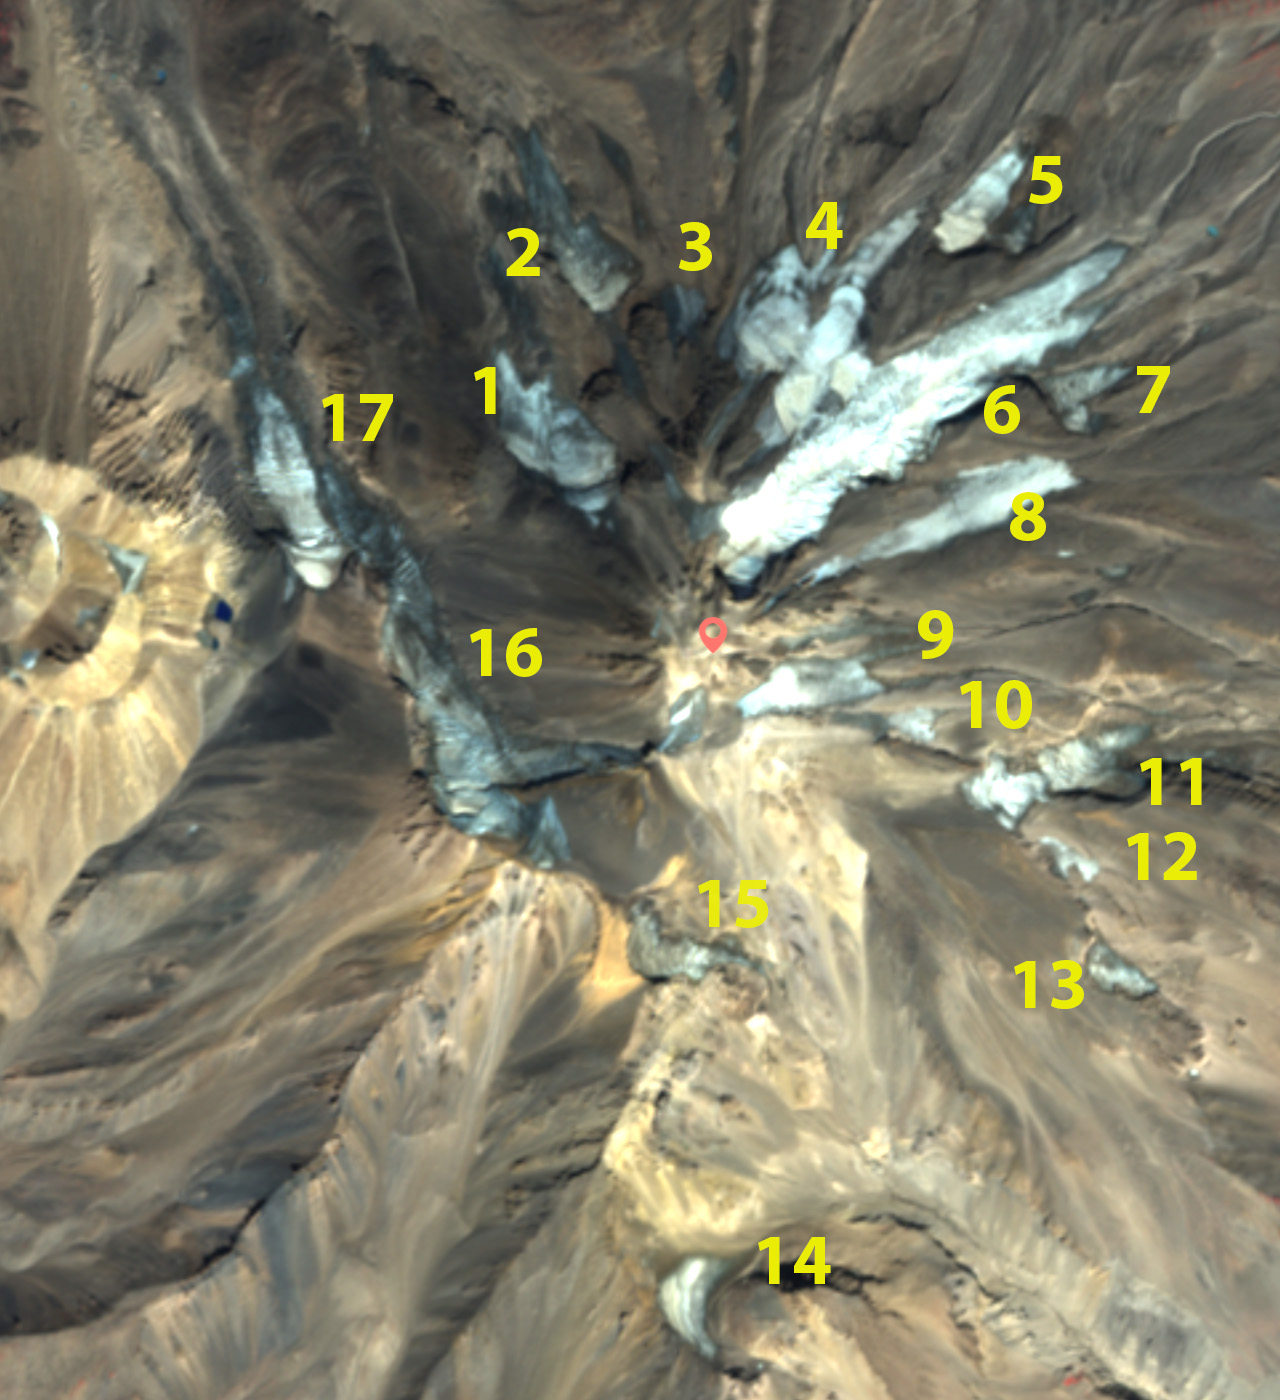
Glaciers on the ridge from Moutn Shuksan to Mount Baker that we observed to be active in mid 1980s, identified in GLIMS map below. Above Sentinel image from 9-9-2023. Glaciers that are no longer glaciers in yellow, seven of them including Mount Ann=MA, Shuksan Arm=SA, Coleman Pinnacle East/West=CPW/CPE, Camp Kiser=CK, Table Mountain=TM and HBB=Happy Bunny Butte. We still monitor each year Lower Curtis, Rainbow and Sholes.
The two most prominent mountains of the North Cascades Mount Shuksan and Mount Baker are connected by a ridge from Shuksan Arm to Ptarmigan Ridge. We visited 12 glaciers along and close to this ridge in the mid-1980s, to decide which to monitor annually. At that time each of these had active crevasses and significant area of glacier ice. We By the end of 2023 seven of the twelve glaciers are gone. We continue to monitor Lower Curtis, Rainbow and Sholes Glacier in detail. Portals and Ptarmigan Ridge Glacier which we visit every year, but do not assess in detail, will likely disappear in the next few years. Below is the evolving area and the date the glacier was lost, the area reported in the 1958/84 period and 2015 are from GLIMS and the 2023 area we determined from Sentinel imagery.
Glacier
GLIMS ID
Year Lost
1958/84 Area
2015 Area
2023 Area
Camp Kiser
G238275E48809N
1993
0.22
0.03
0
Happy Bunny Butte
G238277E48834N
2005
0.166
0
0
Table Mountain
G238295E48850N
2015
0.158
0
0.008
Coleman Pinnacle
G238269E48826N
2018
0.56
0.031
0.018
Mount Ann
G238341E48818N
2022
0.12
0.07
0.01
Shuksan Arm
G238362E48838N
2023
0.16
0.07
0.03
1963 image of Ptarmigan Ridge sent to me by Austin Post.
Ptarmigan Ridge glaciers in 1993-all small but still all nearly joined.
In 2024 the lack of glacier ice or perennial snow along Ptarmigan Ridge is evident.
As April ends there is a sharp snowline ranging from 1200 m at Mount Baker to 1400 m at Cascade Pass. Above 1500 m the melt season is just getting started.
As the accumulation season comes to an end for North Cascade glaciers it is worth reviewing this winter and looking ahead with a forecast for glacier mass balance by the end of summer 2025. The winter of 2025 at NOAA’s Washington Cascade Mountain West Division 5 records indicate that this winter was below the declining trendline of total precipitation with a mean of 54.8 inches, down slightly from last year. Winter temperatures were again warm at 33.2o F but close to the expected rising trend line average.
The 1946 to 2025 winter (November-March) mean temperature and total precipitation for the Western Cascade Mountains-Division 5 weather stations.
The mean April 1 snow water equivalent (swe) at the six North Cascade Snotel sites with a consistent long term record was 0.72 m. This is below the declining trend line and 31% below the long term average for the 1946-2025 period. This is above the 2024 value, but in the lowest quintile. Mount Baker ski area has reported 585 inches of snowfall through April 21, which is ~30% percentile. April 1 swe is the key date for asssessment for winter snowpack water resources. For glaciers the accumulation season typically continues until the end or April or early May. This year snowpack depth at Mount Baker Ski Area (1280 m) increased from 148 inches on April 1 to 164 inches on April 9 and then declining to 119 inches by May 1 (80% of normal). A similar pattern was seen at Stevens Pass-Grace Lake station (1460 m) with snowpack depth on April 1 of 107 inches, increasing to 114 inches by April 9 and decreasing to 82 inches by May 1. These stations are several hundred meters below glacier elevations. At Lyman Lake Snotel (1800 m) snowpack SWE which most closely matches the glacier elevations was 40.1 inches rising to 42.5 inches by April 11 and declining to 35.9 inches by May 1, ~60% of normal. At the Middle Fork Nooksack site (1520 m) snowpack was 44.8 inches SWE on April 1, rising to 49 inches by April 11 and declining to 46 inches on May 1, 67% of normal . This illustrates that at glacier elevations snowpack would have also increased in mid-April, before a slow decline in the latter part of the month. There were a number of atmospheric rivers that drove a higher snowline than usual as May starts, but also led to a rapid increase in snowpack above the snowline.
The mean April 1 SWE from 1946-2025 at six long term SNOTEL stations: Stampede Pass, Fish Lake, Stevens Pass, Lyman Lake, Park Creek and Rainy Pass.
As the melt season begins, based on the above the winter snowpack on glaciers on May 1 are 70-80% of normal. Eric Gilbertson measured snowpack on the summit Colfax Peak at 17.3 ft (5.27 m) on April 18, 2025. This is a location that is to some extent wind scoured and would be less than the depth on the adjacent glacier, a normal year there is 8-9 m of snowpack at 2300-2800 m. On Eldorado Peak they found 25.3 feet on April 27, 2025. This is the depth expected for this location in a year with 75-80% of normal snowpack. It is a location that appears to balance enhanced deposition and scour. Weather conditions in the Pacific Northwest are forecast to have above average temperatures for the upcoming 90 day period. This combined with the below average snowpack on glaciers on May 1, will yield another year where ice thickness loss exceeds 1 m across the glaciers, as each of the last four years have. The average from 2014-2024 has been -1.41 m, which is a 1.5 thick slice of the glacier lost each year. The range expected this year is -1.2 m to -2.4 m. How much will depend on the specific weather and the frequency and intensity of heat waves.
Mean mass balance observed in the field annually by the North Cascade Glacier Climate Project.
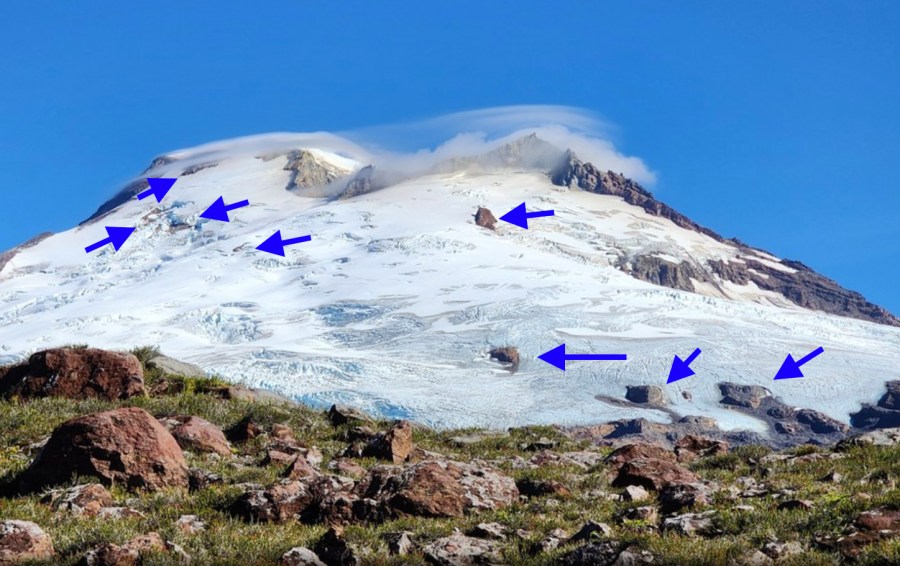
Recent glacier thinning due primarily to warm summers has exposed new bedrock knobs on upper portions of Deming, Easton and Squak Glacier on Mounty Baker, Washington
Find a location where temperatures are cold for at least 7 months of the year. This location also needs to have substantial snowfall and ideally where addtiional snow is added via avalanches or wind depostion. With these ingredients on hand, let stand for a few decades, while the snow accumulates to a thickness of at least 20 m. A key step in the recipe is the transformation of snow to ice under its own weight and with some meltwater percoloation and refreezing. Unlike bread dough you do not need stir or kneed during this period. Once there is a volume . For the glacier to persist the glacier must retain accumulation across a significant portion of its surface by the end of summer. To maintain its size we have observed this percentage to vary from 50-70% on North Cascade glaciers. The lack of a persistent accumulation zone will lead to loss of that glacier. of 500,000 m3 you are either a glacier or at the threshold of being a glacier depending on how steep the underlying slope is. Unlike rolling out a pie crust, this does not need to be an even thickness, or made on a flat surface. As the glacier matures it will develop crevasses indicating movement, which is an essential characteristic of a glacier. It is not a passive feature, its movement allows it to begin to sculpt its landscape.
Current Glacier Loss in North Cascade Range, Washington
Many centuries or millenia later, the glacier has become a critical part of the landscape. Yet, changing climate is leading to the loss of many. In the North Cascades glaciers have been losing close to 1% of their volume annually over the last 40 years, with the rate rising to over 2% in the last decade. The glaciers cover 200 km2 almost all of which are in steep high elevation Wilderness areas not proximate to roads. In 2010 we noted that 2/3 of North Cascade glaciers could not survive current climate. Today this percentage has increased to more than 90%. There are 31 glaciers in the range that I completed observations on in the 1980s that are now gone. Our annual field expedition has noted the glaciers losing ~1.5 m of thickness annually in the last decade.
Deglaciated area below Easton Glacier, Mount Baker, WA in 2023.
Are there any Preservatives we can add to the Recipe?
What would it take to preserve the Easton Glacier in the North Cascades?
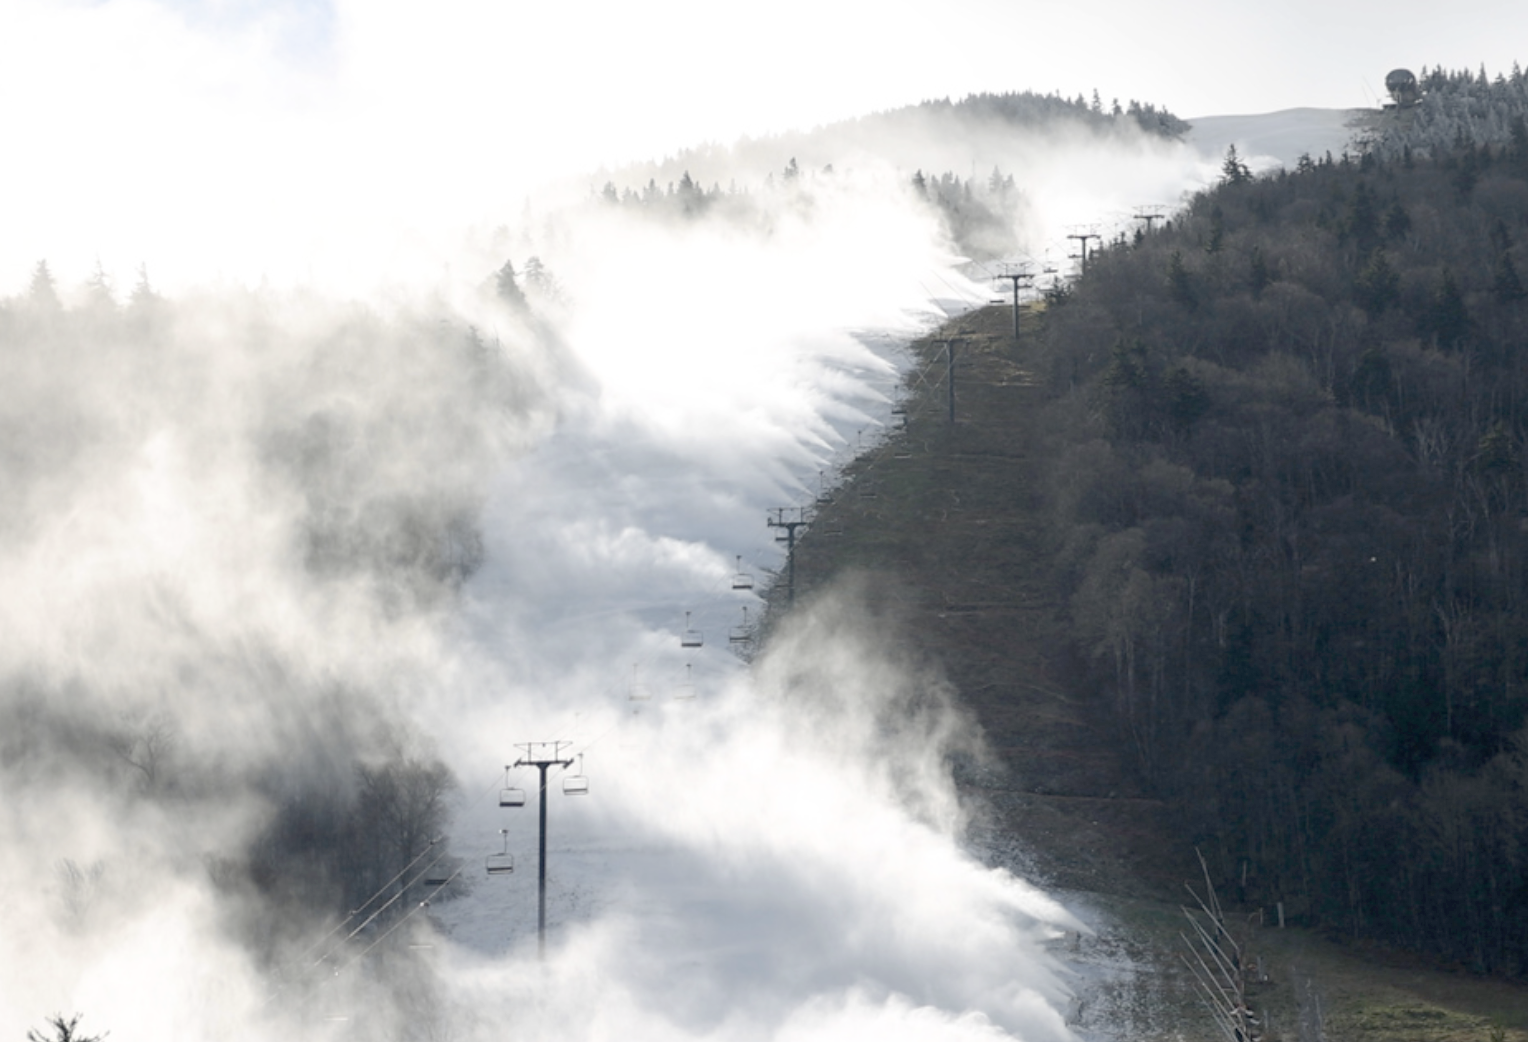
The largest snowmaking operation in North America is at Killington Ski Area, VT. At maximum capacity they can convert 35,000 m3 of water into snow per day. Given that Easton Glacier has an area of 2.5 km2 and has been losing 1.5 m water equivalent thickness per year, 3.75 million m3 of water equivalent snow has to be produced.This would take 108 days at maximum capacity of the more than 2000 snow guns. This ignores enviornmental laws and the logistics of water supply, piping, snow gun placement and electricity. This all in an environment of harsh weather with avalanches and crevasses.
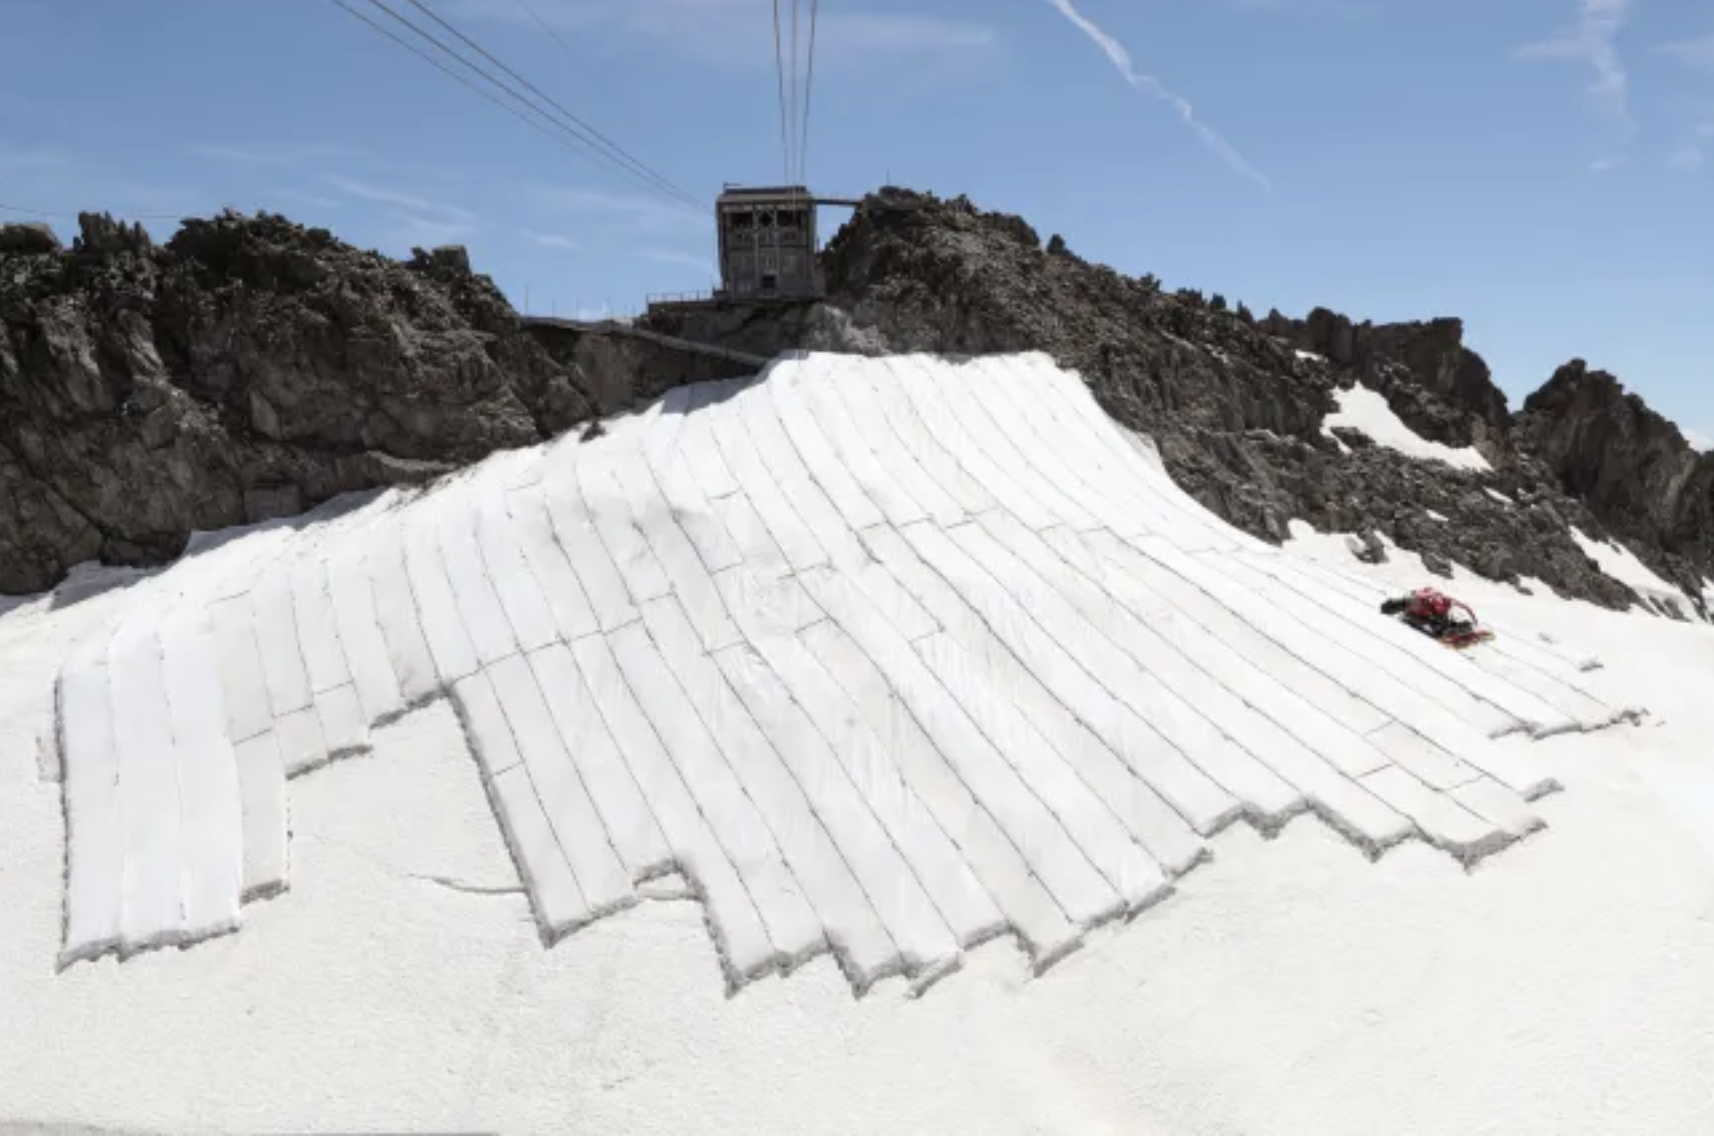
To cover the glacier with geotextiles during the summer, requires 2.5 million square meter of material that would be to installed each summer and removed each winter to allow accumulation, of course summer recreation would not be practical on the glacier. The geotextiles do not last long in these conditions and cost ~$2 per square meter. How to anchor these in place and connect on a crevasse glacier would be very difficult, which is why usually only a portion of the glacier near the terminus is covered, which does not help the overall situation of glacier loss.
There are many more glaciers in this range and around the world where this same confounding logistical challenges make any artificial attempts at preservation ridiculous beyond a few isolated glaciers that are already close to existing infrastructure.
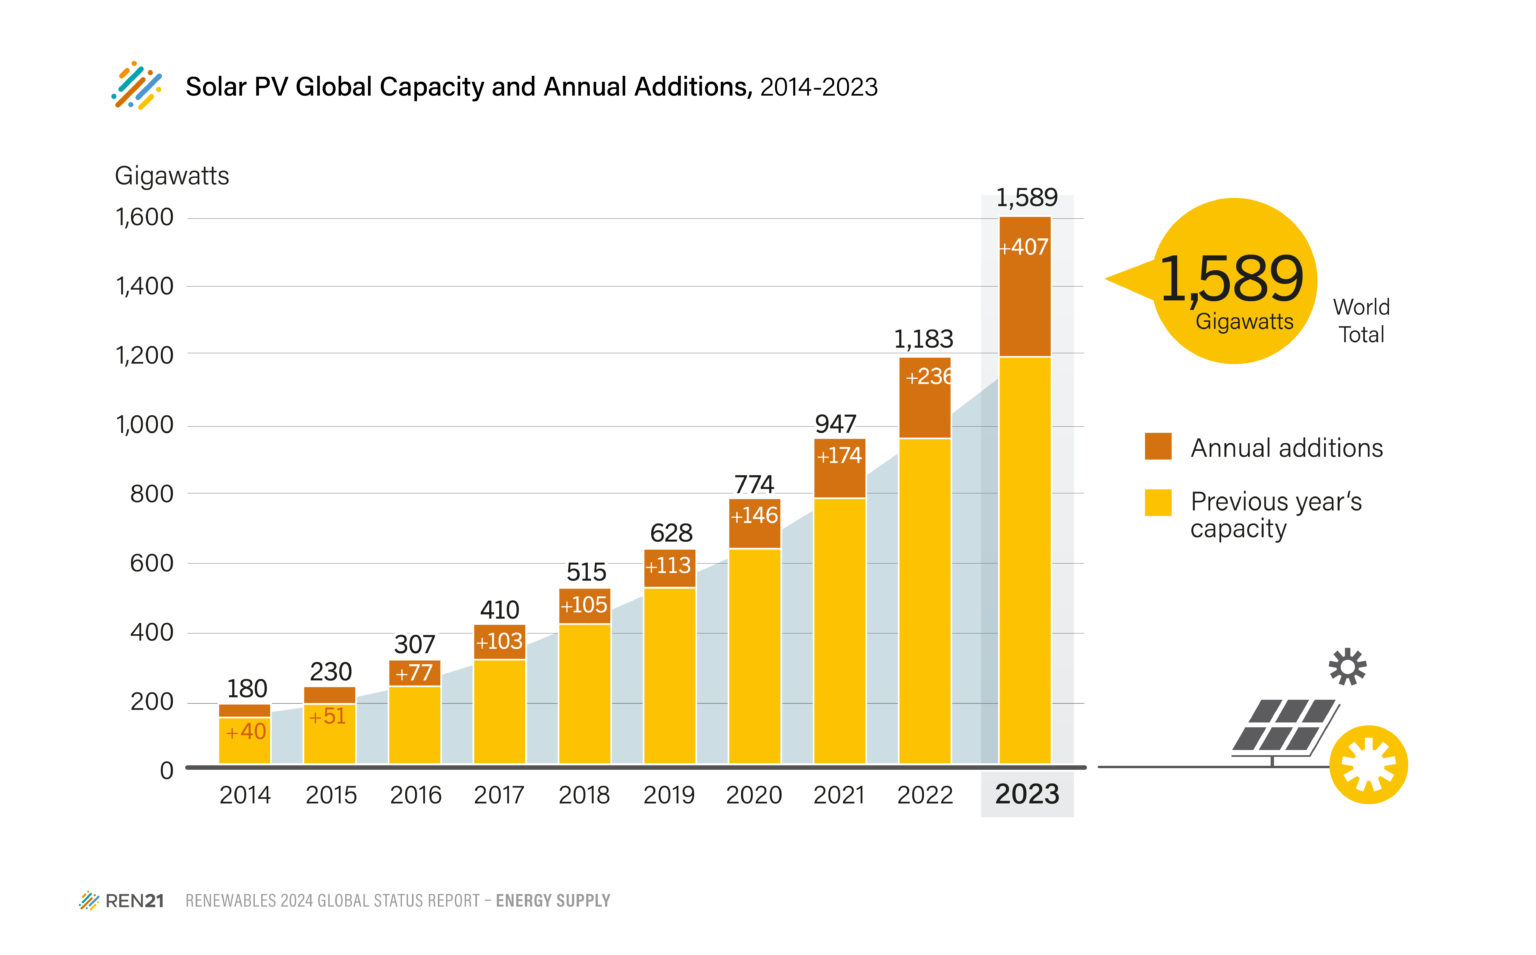
When I began this work in 1984 solar power and wind power did not exist, these are not the only renewable sources of power, and just one of many approaches to reducing CO2 emissions, but they are illustrative of rapid growth from insignificance. The Renewalbes 2014 Global Status Report and the Renewables 2024 Global Status Reports provides measures of renewaable energy production over the last decade. Global capacity for Solar Photovoltaic energy production has risen from 4 GW in 2004 to 190 GW in 2014 and then to 1600 GW in 2023. Global Capacity for Windpower has risen from 48 GW in 2004 to 370 GW in 2014 and in 2023 was 1020 GW. In 2023 alone over 500 GW was added to these two sources combined. See below for charts from this report on increased capacity. This is a preservative under development that can work with continued emphasis and in concert with other items such power grid infrastructure improvement and electric/hybrid automobile manufacturing expansion.
Yakutat, Alsek and Grand Plateau Glacier retreat from 1984 to 2024 has led to the three lakes expanding from 130 km2 to 240 km2 as illustrated by this pair of Landsat images. Fastest lake expansion in the nation in this period.
Three adjacent glaciers terminating on the coastal plain near Yakutat, Alaska have had a spectacular retreat in the last 40 years leading to rapid lake growth; Yakutat Glacier, Alsek Glacier and Grand Plateau Glacier. This is the story of the most rapid area of lake growth in the United States this century also shared at (NASA, 2024).
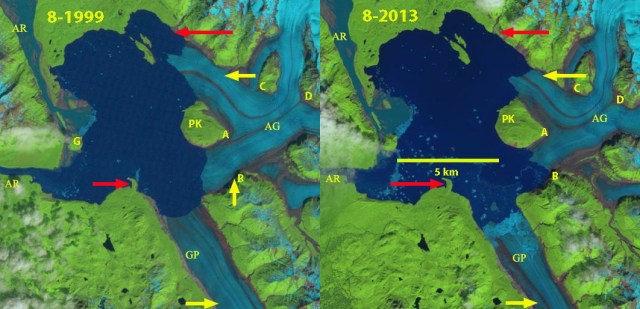
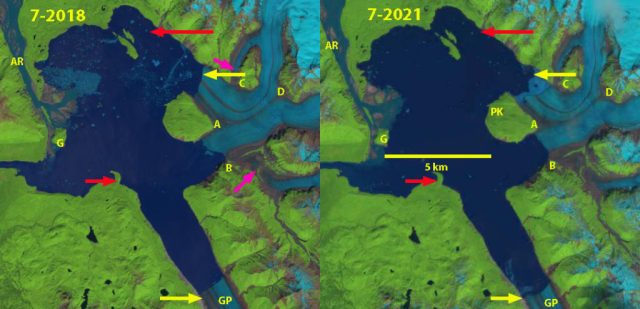
Alsek Glacier descends from the Fairweather Range terminating in Alsek Lake on the coastal plain. In the early part of the 20th century the glacier terminated at Gateway Knob (G) near the outlet of Alsek River from Alsek Lake, with just a small fringing lake present (Molnia, 2005). At that time it had a joint terminus with Grand Plateau Glacier. In 1960 the glacier had a single terminus downstream of an unnamed island in Alsek Lake, that Austin Post (USGS Glaciologisst) told me reminded him of a boats prow. This “Prow Knob” (P) much like Gateway Knob a century ago stabilized the terminus (Pelto, 2017). The glacier retreated 5-6 km by 1984 from Gateway Knob with the lake growing to an area of 45 km2. From 1984-2024 the retreat has been: 5.3 km for the northern terminus, 5.5 km for the southern terminus and 7.8 km for the northern arm of Grand Plateau Glacier. Alsek Lake has grown from 45 km2 to 75 km2 since 1984. In Octobrer 2024 there remains a narrow connection to Prow Knob that will not survive another year.
Alsek Glacier retreat from 1999-2013 in Landsat images. Red arrows mark the 1984 terminus location, yellow arrows the 2022 terminus location, AR=Alsek River, GP=Grand Plateau, PK=Prow Knob, G=Gateway Knob, A=glacier junction, B=tributary separation, C=tributary separation, D=tributary confluence.
Alsek Glacier retreat from 2018-2021 in Landsat images. Red arrows mark the 1984 terminus location, yellow arrows the 2022 terminus location, pink arrows indicate tributary separation, AR=Alsek River, GP=Grand Plateau, PK=Prow Knob, G=Gateway Knob, A=glacier junction, B=tributary separation, C=tributary separation, D=tributary confluence.
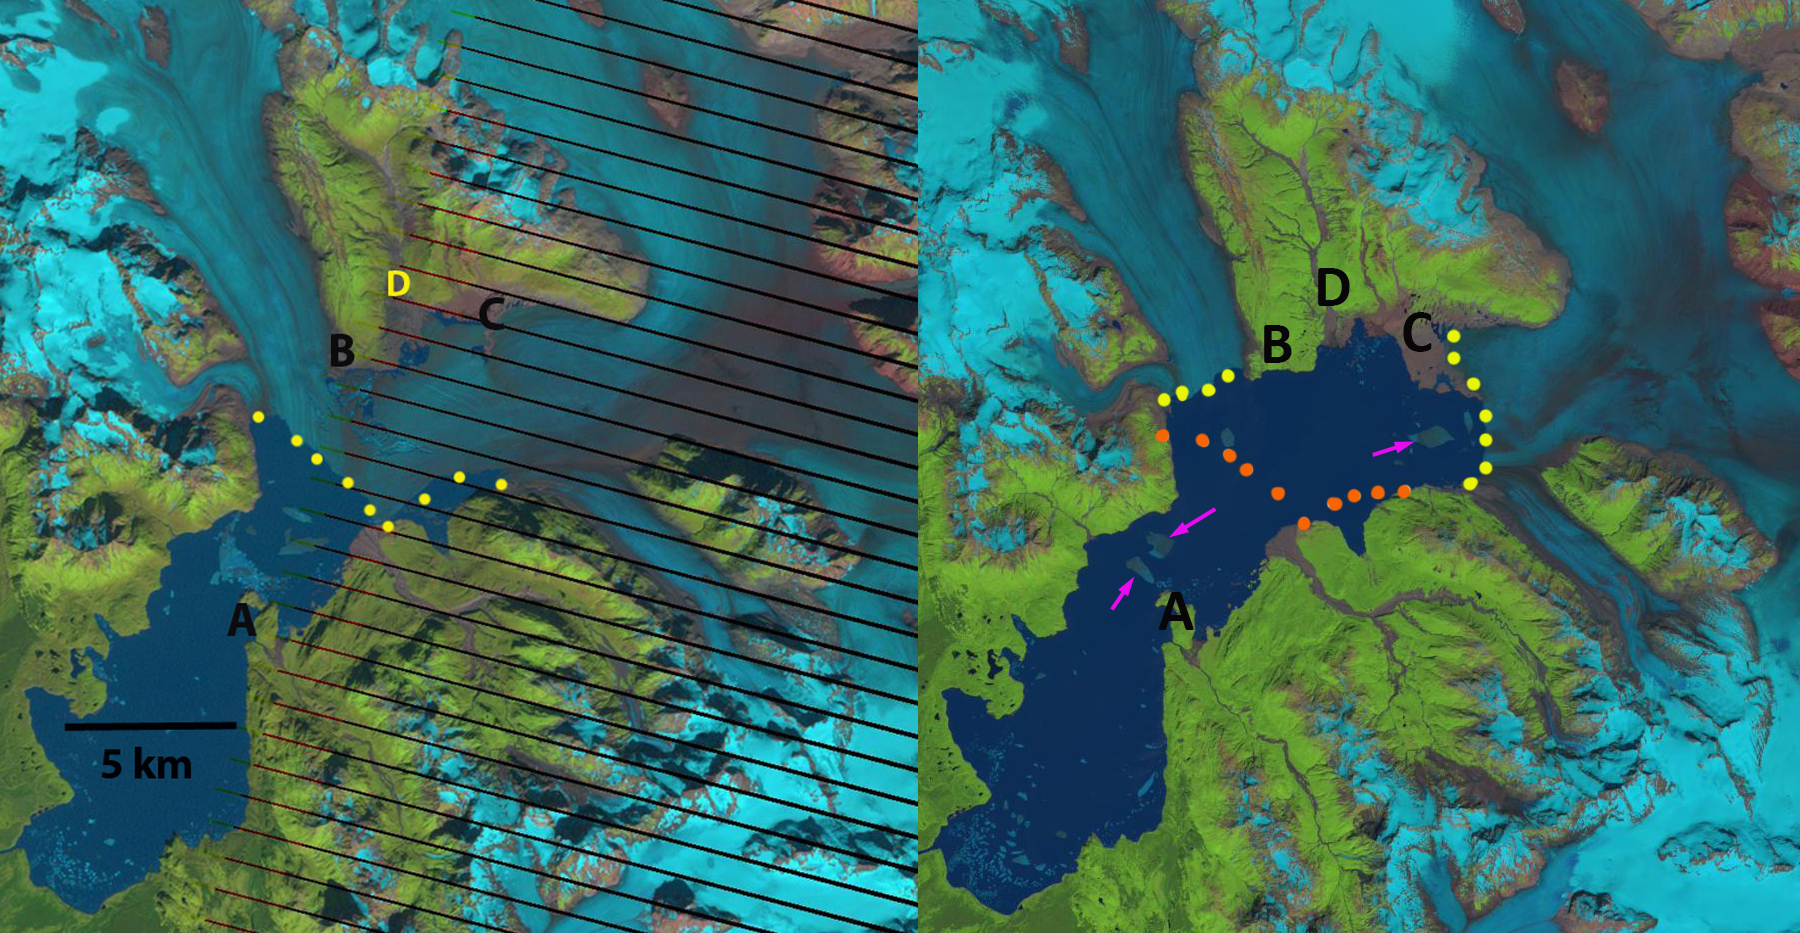
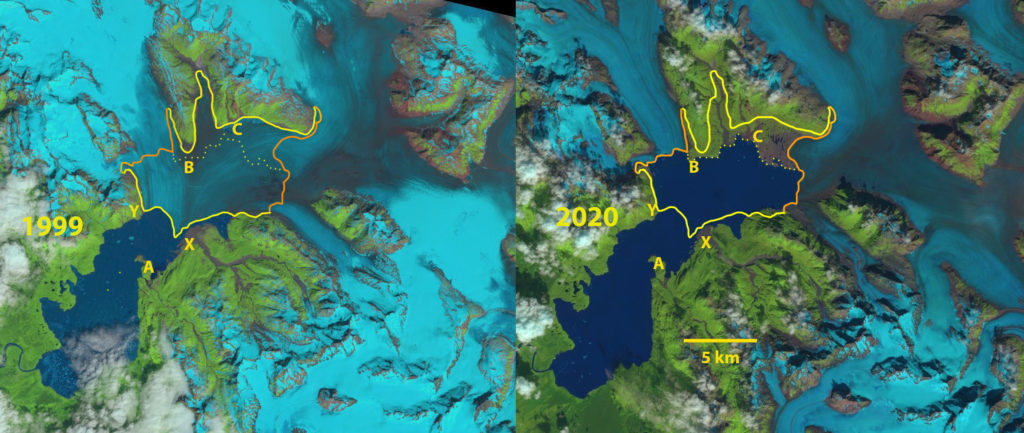
Yakutat Glacier, Alaska experienced a spectacular retreat losing 45 km² from 2010-2018, as a result of rising ELA leading to rapid thinning of the lower glacier (Truessel et al, 2013). The Yakutat Glacier during the 1894-1895 Alaskan Boundary Survey ended near a terminal moraine on a flat coastal outwash plain. By 1906 the glacier had retreated from the moraine and a new lake was forming, Harlequin Lake. By 1984 the lake had expanded to an area of 50 km2. The 2018 image compares the 2010 position (yellow dots) with 2018 (orange dots), indicating an area of 45 km² lost in less than a decade (NASA EO, 2018). There are some small icebergs in 2018. By 2024 further retreat has expanded the total lake area to 105 km2. The main terminus retreated 7 km. The ability to produce icebergs as large as in 2015 has been lost as the calving front has been restricted by the Peninsula which is now 3 km long, leaving less than a 3 km wide calving front. The narrower calving front and reduced water depth should in the short term reduce retreat. Truessel et al (2015) modelling indicated a reduced rate of retreat from 2020-2030, which supports the expected reduced calving. Their model also indicates the glacier will disappear between 2070 and 2110 depending on the warming scenario.
Expansion of Harlequin Lake due to retreat of Yakutat Glacier indicated on these 2010 and 2018 Landsat images. Yellow dots mark the ice front, orange dots the 2010 margin in 2018.Expansion of Harlequin Lake due to retreat of Yakutat Glacier, yellow boundary marks the deglaciated region on these Landsat images from 1999 and 2020.
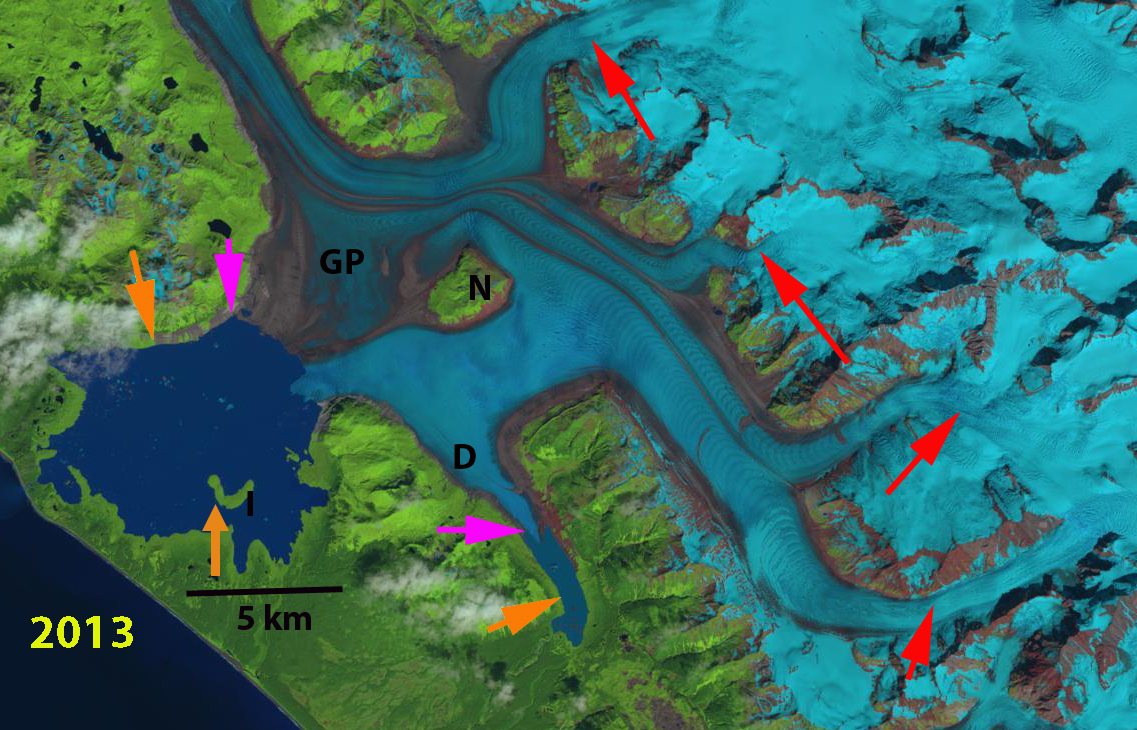
Grand Plateau Glacier drains southwest from Mount Fairweather in southeast Alaska. The glacier advanced during the Little Ice age to the Alaskan coastline. Early maps from 1908 show no lake at the terminus of the glacier. The 1948 map (below) shows three small distinct lakes at the terminus of the main glacier and a just developing lake at the terminus of the southern distributary terminus (D). The distance from the Nunatak (N) to the terminus was 11 km in 1948. The lake at D is 400 m wide.In 2024 the lake area has grown further to 49 km2, as a result of a retreat of 8 km since 1948 and 5.5 km since 1984. Today a second island is emerging at the terminus, Point A. The distributary tongue to the southeast now terminates in a lake that is now 5.2 km long, a 4.8 km retreat since 1948 and 2.6 km since 1984. The combination of higher snowlines and increased calving into the terminus lake will continue to lead to retreat of this still mighty river of ice (Pelto, 2024).
There will be continued glacier retreat and lake expansion in 2025, as the new lake district continues to expand as a result of climate change. Loso et al (2021) note that retreat of Grand Plateau Glacier will change the outlet of Alsek Lake from Dry Bay to the Grand Plateau Lake, creating one larger lake.
Grand Plateau Glacier retreat from 1984 to 2013 in Landsat images. Main tributaries indicated by red arrows also showing snowline. Orange arrows indicate 1984 terminus and pink arrows 2013 terminus.
Burroughs Glacier in 1986 and 2022 Landsat images. The red arrow marks the west margin and the yellow arrow the east margin in 1986. Yellow dots mark the outline of the glacier in 2022. Glacier area declined from 12.5 km² to 1.5 km² during this 36 year period.
Burroughs Glacier in Glacier Bay National Park, Alaska has been retreating without pause since 1892 when it was part of the Muir Glacier complex. The glacier is unusual in that it has not had an accumulation zone over the last century, where snow persists through the year. Without an accumulation zone a glacier cannot survive (Pelto, 2010). Mickelson (1971) summarized the retreat of the glacier from 1892-1960. In 1892 the Burroughs ice plateau was assessed as a 10 km by 25 km ice cap. By 1960 it had thinned by as much as 750 m and its calving margin had retreated 27 km.. By the 1970’s the glacier was essentially stagnant (Molnia, 2008). In 1982 I briefly visited the western terminus, which provided a still imposing slope, made more so by the rain and clouds lowering onto its surface.
Here we examine the glacier in Landsat imagery from 1986 to 2022 to illustrate the retreat, the lack of snowcover and the thinning. In the 1948 map of Burroughs Glacier, the glacier is 12.1 km long, and much of the glacier is already stagnant, the glacier has both a north and south terminus, purple arrows. To the west of Burroughs Glacier is Plateau Glacier (P).
Burroughs Glacier in 1948 USGS map.
In 1948 Burroughs Glacier has an area of 22 km² and is 12.5 km long, with the crest of the glacier at ~1500 feet. In 1986 Burroughs Glacier has an area of 12.5 km² and has no snowcover by mid-summer. The glacier terminates in proglacial lakes at both the north and south terminus red and yellow arrow respectively, and is 9 km long, purple arrows indicate 1948 terminus. By 1986 Plateau Glacier has only three small remnants marked by P, surrounding these vegetation is still limited, with considerable expanse of bare glacial sediments. By 2003 Plateau Glacier is gone and vegetation is filling in most of the area that was still bare sediment in 1986. In 2003 Burroughs Glacier again lacks any snowcover. The southern terminus has retreated 2.2 km from the lake, and the northern terminus has retreated into a second lake basin. The glacier is 6.3 km long, half of its length in 1948. In 2004 snowcover is again lacking anywhere on the glacier. In 2010 snowcover is lacking and retreat has continued shrinking the glacier to 5.4 km in length. The glacier was assessed with an area of 2.8 km² and a median elevation of 313 m (1025 feet) by GLIMS. In 2013 the glacier lacks snowcover in this September Landsat image even though snow has returned to the surrounding mountains. This indicates how far below the snowline the glacier lies. Portions of a glacier are supposed to be the first locations that receive snowcover. The terminus has continued to retreat and the glacier was 4.6 km long in 2013. The northern terminus was retreating into a third basin of the proglacial lake. Vegetation has reclaimed almost all of the Plateau Glacier area and has reclaimed the region deglaciated by Burroughs Glacier before 2003. By 2022 the glacier area has been reduced to 1.5 km², this is just 12% of its area remaining from 1986 and 1% of the 1892 area. The length of the glacier in 2022 is 2.3 km, only 50% of the lenght just a decade ago, and ~20% of the 1948 length.
Thinning of this glacier from 1948-2016 is evident from a comparison of topographic maps. Thinning in remaining glacier are averages 225 m during this period, that is a rate of ~3.3 m/year. Larsen et al (2007) had found a thinning rate of ~3 m/year for the 1948-2000 period.
Overlay of 1948 (blue labeled contours) and 2014 elevation map (Brown labeled contours) for Burroughs Glacier.
Burroughs Glacier has not been in equilibrium with climate since the end of the Little Ice Age. Its retreat has been hastened by the rising snowline of the last decade note by Pelto et al (2013) on Brady Glacier. This glacier area has declined by 88% since 1986, with volume loss being even larger. Retreat usually increases as elevation declines and as the size of the remnant ice declines. There is no debris cover or persistent snowcover to slow the loss. Thus, it seems likely this glacier will be gone within 25 years. The 2011 Google Earth image at bottom indicates no snow, the reduced albedo from the dirty surface and a few crevasses near the margin that are collapse features. This is unlike nearby glaciers that are retreating significantly but not disappearing, like Brady Glacier, Geikie Glacier,Yakutat Glacier and Riggs Glacier.
1986 Landsat image of Burroughs Glacier. The purple arrows mark the 1948 margin, red arrow the west margin in 1986 and the yellow arrow the east margin.
2003 Landsat image of Burroughs Glacier. The red arrow marks the west margin in 1986 and the yellow arrow the east margin.
2004 Landsat image of Burroughs Glacier. The red arrow marks the west margin in 1986 and the yellow arrow the east margin.
2010 Landsat image of Burroughs Glacier. The red arrow marks the west margin in 1986 and the yellow arrow the east margin.
2013 Landsat image of Burroughs Glacier. The purple arrows mark the 1948 margin, red arrow the west margin in 1986 and the yellow arrow the east margin in 1986, pink arrows the 2013 margin.
2022 false color Sentinel image of Burroughs Glacier. The ice is dirty but not debris covered at this point.
Suru Basin glaciers in 1998 and 2022 Landsat images. Red arrow marks the 1998 terminus location, yellow arrow the 2022 terminus location. S=Shafat Glacier, D=Dilung Glacier. Glacier 1-4 are unnamed glaciers that lost almost all snowcover in 2022.
Glaciers of the Suru Basin, draining the Ladakh Range, a drier region of the Himalaya, was significantly by the 2022 pre-monsoon and monsoon season warmth. Here we focus on a group of glaciers near Shafat and Dilung Glacier that lost snowcover in 2022. We also look at the retreat of Shafat and Dilung Glacier. Shafat Glacier occupies the northeast flank of Nun Kun Peak in Ladakh India and drains into the Suru valley. The main valley glacier has suffered from detached tributaries leading to terminus area stagnation (Pelto, 2021). Dilung Glacier retreat has led to an expanding proglacial lake. Shukla et al (2020) identified an increase in annual temperature has driven a 6% loss in regional glacier area and a 62% expansion in debris cover from 1971-2017. Here we compare Landsat imagery from 1998-2022 to identify this glaciers response to climate change.
In 1998 the terminus of Shafat Glacier was at the red arrow near a junction with a key tributary, with clean active ice reaching to the terminus. By 2022 the active ice is 2.5 km upglacier from this point at the yellow arrow, though there is stagnant debris covered ice below this point. Dilung Glacier in 1998 terminates in a 1.1 km long proglacial lake. By 2022 the glacier has retreated 900 m, resulting in a 2.0 km long lake. Rashid and Majeed (2018) indicate nearby Drang Drung Glacier has retreated 925 m since 1971, with a sharp increase after 2014.
For an alpine glacier to have a balanced annual budget it has to be 50-60 snowcovered at the end of the melt season. On Sept. 1, 2022 there are four glaciers 1-4 in this region that have 0-10% snowcover left. The snowcover is above 5300 m. This is illustrative of significant mass losses in 2022. On Dilung Glacier and Shafat Glacier the snowcover is ~20% and is confined to the regions above 5300 m. There is some cloudcover over the top of the Shafat Glacier in the 9-1-2022 Landsat image.
Suru Basin glaciers in September 1, 2022 Landsat image. Glacier 1-4 are unnamed glaciers that lost almost all snowcover in 2022. S=Shafat Glacier, D=Dilung Glacier. The snowline is above 5300 m.
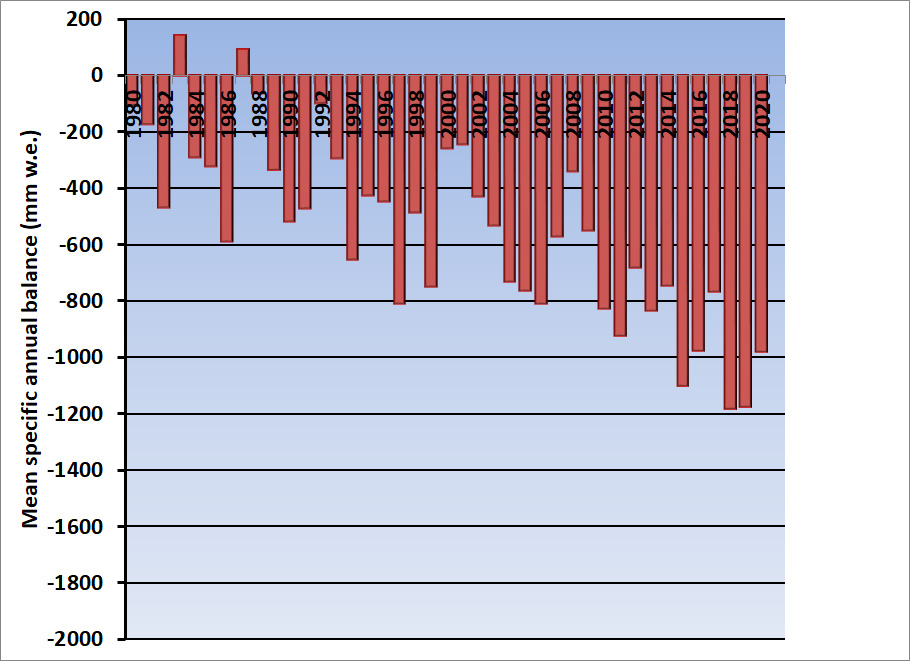
The 32nd annual State of the Climate report was published today. For the 14th year I have written the Alpine Glacier section chronicling their response for the the hydrological 2020/21 utilizing the World Glacier Monitoring Service (WGMS) data sets. WGMS reference glaciers (30+ years of continuous observation) experienced a mass balance loss of -900 mm w.e., compared to -700 mm w.e. in 2019/20. From 1970-2021 the eight most negative mass balance years were recorded after 2010.
Figure 1. illustrates glacier mass balance for the WGMS global reference glaciers with more than 30 continued observation years for the time-period 1970-2020. Global values are calculated using a single value (averaged) for each of 19 mountain regions in order to avoid a bias to well observed regions.
In 2021, a negative annual mass balance was reported from 31 of the 32 reference glaciers reported to the World Glacier Monitoring Service (WGMS). The mean annual mass balance of the 32 reference glaciers reporting is -900 mm w.e., this includes data from 12 nations on four continents. This value is not the final regionally averaged global value. This will make 2021 the 34th consecutive year with a global alpine mass balance loss, and the 13th consecutive year with a mean global mass balance below -500 mm w.e..
The rate of thinning increased from –527 mma−1 for 2000-2009 to – 896 mma−1 for 2010-2019 (WGMS, 2021). This agrees well with the satellite survey of 200,000 alpine glacier by Hugonnet et al (2021) who identified a thinning rate excluding ice sheet peripheral glaciers of 360 ± 210 mma−1 in 2000 to 690 ± 150 mma-1 in 2019. Alpine glaciers lost a mass of 267 ± 16 Gta-1 from 2000-2019, equivalent to 21 ± 3 per cent of the observed global sea-level rise (Hugonnet et al, 2021). More frequent and intense heat waves continue to take a toll on alpine glaciers.
All 17 reporting glaciers in the Alps had a negative mass balance averaging – 682 mm in 2021. In Austria in 2020, of the 92 glaciers with annual terminus observations 85 (93.4%) withdrew and seven remained stationary (Lieb and Kellerer-Pirklbauer, 2021). This retreat trend will continue in 2021, with another year of mass balance loss.
In Norway the six reporting glaciers all had a negative mass balance yielding an average mass balance of -671 mm in 2021. On Svalbard the mean loss of the four reporting glaciers was -227 mm. Iceland completed surveys of nine glacier, all nine had negative balances with a mean mass balance of -1160 mm.
In the Western Canada and the United States and Washington all 14 glaciers observed in 2021 had a negative mass balance averaging -1635 mm. The exceptional heat wave during late June and early July set the stage for the large glacier mass loss. In Alaska three of the four glaciers had a negative mass balance with a mean annual balance of -528 mm.
Upper portion of Easton Glacier with a month left in the melt season
In South America, 2021 mass balance data were reported from three glaciers in Argentina, two glaciers in Chile, and one in Columbia, all were negative with a mean of -861 mm. This is greater than the 2000-2018 average loss observed in the Andes of −720 ± 220 mma-1 (Dussaillant et. al., 2019).
In the High Mountain Asia fifteen of eighteen glaciers reported negative balances in 2021. The average mass balance was-468 mm. Early winter of 2021 was warm and dry across the Himalayan Region. This was capped off by record warmth in the Mount Everest region leading to the snow line on glaciers rising and snow free glaciers up to 6000 m (Pelto, et al., 2021). This illustrates that the ablation season no longer always ends when winter begins. The importance of winter conditions was further noted by Potocki et al (2022) who report on an ice core drilled on South Col Glacier on Mount Everest at 8020 m revealing a contemporary sublimation driven thinning of ~2000 mma-1.
References
Dussaillant, I., Berthier, E., Brun, F., Masiokas, M., Hugonnet, R., Favier, V., Rabatel, A., Pitte, P.and Ruiz, L.,2019: Two decades of glacier mass loss along the Andes. Nat. Geosci.12, 802–808. https://doi.org/10.1038/s41561-019-0432-5
Hugonnet, R., McNabb, R., Berthier, E. et al 2021: Accelerated global glacier mass loss in the early twenty-first century. Nature592, 726–731. https://doi.org/10.1038/s41586-021-03436-z
Lieb, G.K. and A. Kellerer-Pirklbauer 2021: Sammelbericht über die Gletschermessungen des Österreichischen Alpenvereins im Jahr 2020. Letzter Bericht: Bergauf 2/2020, Jg. 75 (145), S. 6–15, https://www.alpenverein.at/
Pelto, M.; Panday, P.; Matthews, T.; Maurer, J.; Perry, L.B., 2021: Observations of Winter Ablation on Glaciers in the Mount Everest Region in 2020–2021. Remote Sens.13, 2692. https://doi.org/10.3390/rs13142692.
Potocki, M., Mayewski, P.A., Matthews, T. et al, 2022: Mt. Everest’s highest glacier is a sentinel for accelerating ice loss. Nature Clim. Atmos. Sci.,5, 7. https://doi.org/10.1038/s41612-022-00230-0.
WGMS 2021: Global Glacier Change Bulletin No. 4 (2018-2019). Zemp, M., Nussbaumer, S. U., Gärtner-Roer, I., Bannwart, J., Paul, F., and Hoelzle, M. (eds.), ISC(WDS)/IUGG(IACS)/UNEP/UNESCO/WMO, World Glacier Monitoring Service, Zurich, Switzerland, 278 pp., doi:10.5904/wgms-fog-2021-05.
World Glacier Monitoring Service: Fluctuations of Glaciers (FoG) Database
DOI for current scientific data (Identifier): 10.5904/wgms-fog-2021-05
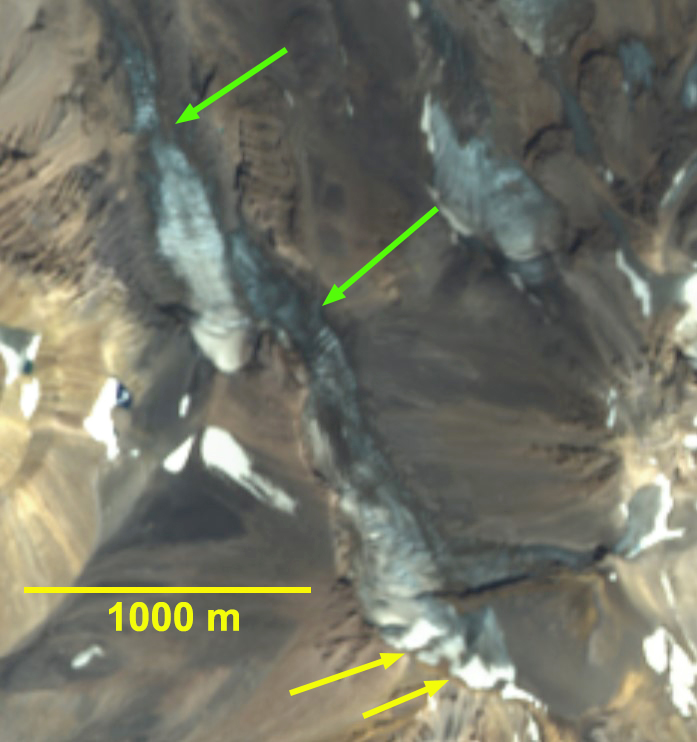
Whitney Glacier on August 25, 2022 in Sentinel image. Green arrows separation points, yellow arrows remaining snowpack
The summer of 2021 proved to be catastrophic for Whitney Glacier on Mount Shasta, California in terms of volume loss, ~15% leading to long term impacts, such as the 50% area reduction and 1000 m retreat since 2005. The glacier lost 100% of its 2021 snowpack and was in the process of separating into three segments. In 2022 it was important for the glacier to offset some of this loss with a healthy retained snowpack through the sumer. Unfortunately by mid-August it is evident that the glacier will again be snow free by end of summer in 2022. This will continue the rapid area and volume loss and continue the separation process.
Here we examine local weather records and Sentinel imagery to illustrate the conditions in 2022. The winter of 2022 started off well with near record December snowfall, followed by limited snowfall and temperatures averaging +3 C in Shasta County, until another big month in April. The results was well below average snowpack in early spring. A cool wet April and May preserved the limited snowpack. July experienced average temperatures 2.2 C above normal in Shasta County (NCEI-NOAA County Mapping)
Whitney Glacier in Sentinel images from 8-30-2020, 8-31-2021 and 8-15-2022. Green arrows separation points, yellow arrows remaining snowpack and T=terminus location,.
Fragmentation of the glaciers is evident in the comparison from 9-4-2018 and 9-4-2022, there are seventeen fragments left, six fragments that have melted away also.
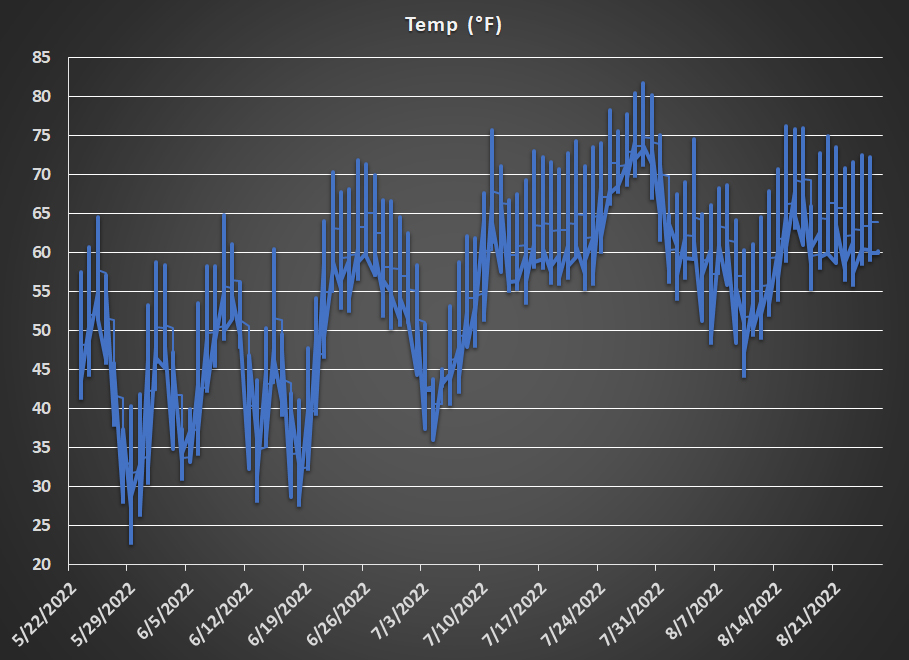
A comparison of August snowcover from 2020-2022 illustrates the small patch that remained in 2021, yellow arrow, and the small patches left in mid-August of 2022. The ongoing separation is evident at two locations sho.w with green arrows. From August 2020-August 2022 the glacier area has declined from 0.72 km 2 to 0.57 km 2 a ~20% loss. The width of the glacier at the two arrows has been reduced by ~50% to 50 m at the lower elevation of 3250 mand 100 m at the upper elevation of 3600 m. A key issue this summer again has been the high temperatures in July and August, in particular the high minimum temperatures, preventing the snow surface from freezing at night and shutting off the melt. At Gray Butte, 2450 m, the remote weather station indicates a period from July 9-August 7 where the temperature never dropped below 10 C (50 F).
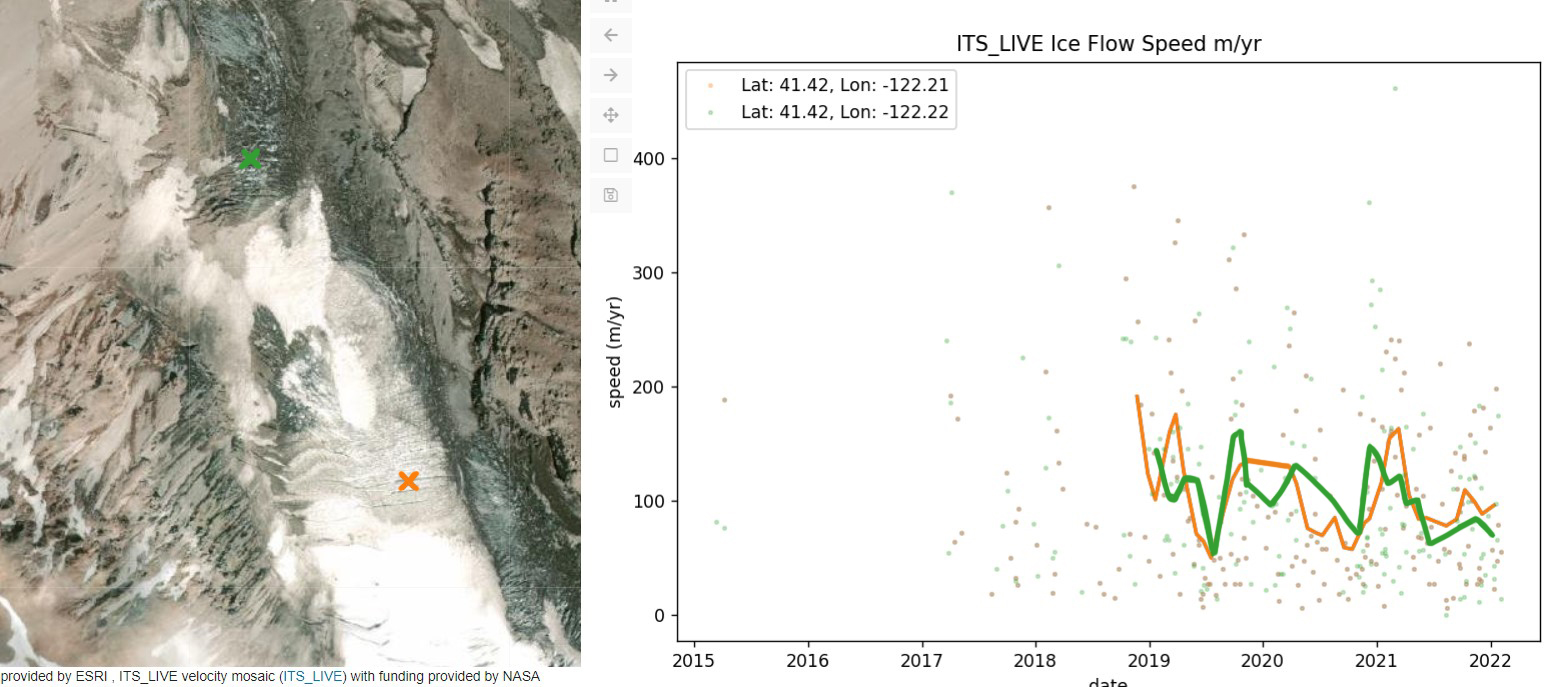
The velocity in two primary icefalls above each of the separation points is declining based on the NASA_IT’s LIVE application. The reduced flux combined with high summer melt in 2021 and 2022 will continue to accelerate the separation.
Velcoity data for two icefall locations on Whitney Glacier 2019-early 2022, from NASA_ITs-LIVE application
Whitney Glacier Icefall at the green arrow seen on 8-15-2022 ( Mount Shasta Avalanche Center). Note the thin upper arm of the glacier.
Bare glacier ice exposed with months left in the melt season enhances melt. Down slope ice bands and surface roughness on Sholes Glacier.
Heat waves and glaciers don’t usually go together; however, in the last several years an increasing number of heat waves have affected alpine glacier regions around the world. This is true from Arctic Canada to the Himalayas from the Andes to Alaska. Here we review a number of these heat waves from 2018-2022, that I have been involved with assessing and observing. In particular heat waves leave a greater portion of the glacier snow free, which enhances melting and mass balance losses. This is most pronounced when the heat wave occurs prior to or early in the melt season exposing bare glacier ice for the bulk of the melt season. This occurred in summer 2021 in the Pacific Northwest, in summer 2022 in the Central Andes of Chile and Peru, and during the pre-monsoon season in 2022 in the Himalaya. In the summer of 2022 heat waves impacted the glaciers of Svalbard and Europe. In the summer of 2023 the Central Andean glaciers have again been stripped of snowcover.
Lowell Glacier in Landsat images from 7/4, 7/26 and 8/11 with Sentinel images from 7/22 . The snowline is shown with purple dots. Point A-F are fixed reference locations. The snowline migrated upglacier 20 km and 300 m in elevation. A significant snow swamp is between the yellow and purple dots on 7/26, that was not present on 7/22.
The beginning of this “wave” of observations of heat wave impacts on glaciers, was on Lowell Glacier, Yukon where a large snow swamp formed in a matter of days during a Yukon/Northwest Territories Heat Wave. On July 26, the slush covered an area of more than 40 square kilometers, with the rapid development of such a large melt area on Lowell Glacier coinciding with four days where daily temperatures at nearby Haines Junction (~60 km northeast of the glacier) reached 29 degrees Celsius. The only way to generate an extensive snow swamp is to have the snow saturated with water all the way to the surface NASA’s Earth Observatory (NASA EO).
Taku Glacier transient snowline (purple dots) in Landsat images from 7/21 and 9/16/2018.
This same heat event led to the observation that the snow lines on Taku Glacier in Alaska were the highest they had been since tracking began in 1946, 200 m higher than previously observed, with the snow line rising +10 m/day during the heat wave (Pelto, 2019).
Fork Beard (F) and Nerutusoq Glacier (N) Baffin Island on June 1, 2019, June 18, 2019 Sentinel images and June 30 Landsat image. Purple dots indicate the snowline.
During June 2019 on Baffin island Pangnirtung featured four days with record temperatures for that date June 5 (15.1), June 11 (13.5) and June 12 (13.6), and June 19 (14.4). There were 14 days with a maximum temperature above 10 C. On Fork Beard Glacier and Nerutusoq Glacier this drove a snowline rise from 800 m on June 1 to 1100 m by June 18 and 1150 m on June 30. A rate of over 10 m/day for the month.
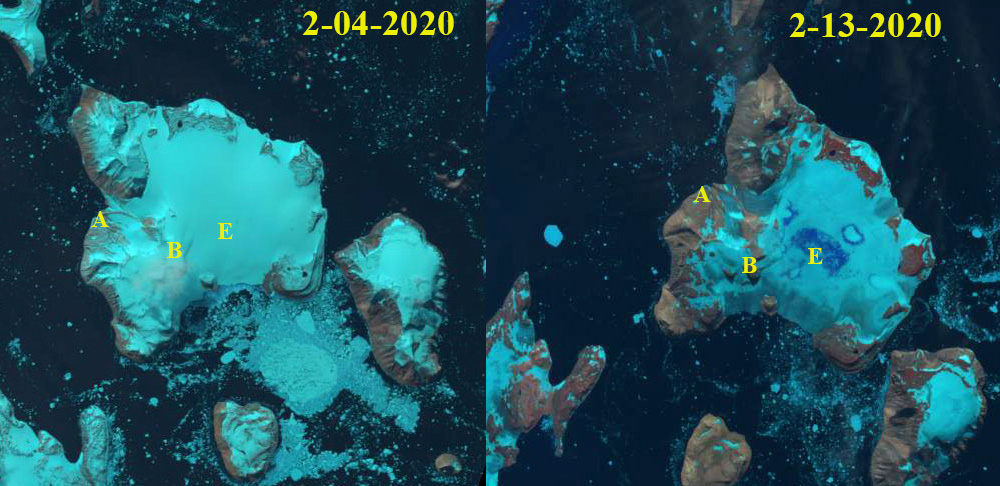
Eagle Island Ice Cap, Antarctica in Landsat images from Feb. 4, 2020 and Feb. 13, 2020. Point E indicates an are area of snow/firn that is saturated with
An all-time temperature record for Antarctica in February 2020, a high-pressure ridge and a blocking high in the Drake Passage caused anticyclonic circulation bringing warm moist air from the Pacific Ocean to the Antarctic Peninsula Xu et al (2021). This led to vertical air flows in a foehn warming event dominated by sensible heat and radiation made generating abrupt warming Xu et al (2021). The visible impact of this heat event were the rapid rapid formation of melt ponds on Eagle Island Ice Cap I reported to NASA EO. On Eagle Island Ice Cap melt averaged 22 mm/day from Feb. 6-11 based on MAR climate model output forced by the Global Forecast System (GFS) generated by Xavier Fettweis. Rapid melting generating significant snowline rise on Coley Galcier, James Ross Island as well (Pelto, 2020).
Nanpa La (NPL) and Nup La (NL) in October 13, 2020 and January 17, 2021 Landsat imagery indicating the snow line rise that has persisted into mid- winter. Snow line indicated by yellow dots.
When record warmth spread over the Mount Everest region in January 2021, the snow lines near Mount Everest rose durng the October-December 2020 period, and remained at nearly 6,000 meters, including the key glacier passes from Nepal into China being snow free into late January. The National Geographic Perpetual Planet Expedition weather team, led by L. Baker Perry and Tom Matthew, had installed weathers stations at high elevations on Mount Everest in 2019 (Matthews et al 2020). These stations provided field observation of how warm it was during this period, which explained the snow free glaciers in winter. Temperature observations and reconstructions of daily weather conditions, dating back to 1950, indicated that the region had experienced the five warmest winter days since 1950 during a short period in January 2021. Prajjwal Panday examined the decline of snow cover area and rise of sthe snowline on glaciers from Oct. 2020 -January 2021 finding a 15% depleation and 200 m rise respectively. Even in the highest mountain range in the world, we are seeing melt conditions during the winter. This study was first published by NASA EO within a month of the event, and then in the journal Remote Sensing.
Easton Glacier has limited snowpack with two months left in the melt season in 2021. Dots indicate the firn line.
The next warm weather event was the Pacific Northwest record heat in late June 2021, setting all-time records across the region. Thompson et al (2022). comparison of daily summer maximum temperaturesthat were 3.6 SDs from the mean.. This heat wave quickly melted away much of the winter snowpack on many glaciers. The heat wave and ensuing warmth stripped the snowcover from glaciers right to the summit on the highest mountains from Mount Shasta, California to Mount Baker, Washington by mid- August exposing the dirtier ice that lies underneath the snow and melts more rapidly than snow under the same weather conditions, to the summit of these mountains. The led to increased discharge in glacier fed streams, while non-glacier fed streams in the region had significant declines in discharge. For the Nooksack River heat waves generate a 24% increase in discharge in the glaciated North Fork and a 20% decline in the unglaciated South Fork (Pelto et al 2022). For water temperature the mean increase was 0.7 °C (±0.4 °C) in the North Fork and 2.1 °C (±1.2 °C) in the South Fork (Pelto et al 2022). The resulting volume loss during the summer season has been the highest we have observed in our 38 years of monitoring North Cascade glaciers. We observed stunted alpine plant growth, experienced days of smoky air limiting visibility and had to navigate and measure more open crevasses than usual.
Whitney Glacier on Mount Shasta in 2021 Sentinel Images.
Jackson and Blackfoot Glacier in early September Sentinel 2 false color images. Point A indicates exposed ice showing annual layers. Point B indicates exposed firn that had been retained through previous summers. The gray color of the firn indicates how dirty it is and that its albedo would enhance melting.
Mount Shasta in California fared even worse, losing all snow cover on its glaciers by September 6. The largest glacier on the mountain and in California, Whitney Glacier, began to separate. In all, the glaciers there had lost 50 percent of their area and volume this century, including ~10-15 percent this summer, and had fragmented from 6 into 17 glacier pieces (Patel, Washington Post, 2021).
The summer of 2022 in the Central Andes of Argentina and Chile glaciers experience a near total loss of snowpack in January due to early summer warmth, leading to dirty/dark glaciers. The darker surfaces of the glacier melt faster leading to more rapid area and volume loss. This includes fragmentation and rapid expansion of bedrock areas amidst the glacier. The snow free conditions lasted until the end of March, extending the impact from the January observations emphasizing that this was a regional issue this summer with snowpack lost from Bajo del Plomo Glacier, Cortaderal Glacier, Palomo Glacier,Volcan Overo Glaciers,Volcan San Jose Glaciers , Cobre Glacier and Olivares Beta and Gamma Glaciers across the Central Andes of Chile and Argentina.
Volcan San Jose glaciers in Feb. 17, 2022 Sentinel image. This highlights just how dirty the ice surface is and how limited the retained snowcover is.
Cobre Glacier, Argentina in false color Sentinel 2 images from Jnauary 13, 2022 and March 16, 2022. Note the expansion of bedrock area amidst the glacier at Point A, glacier fragmenting at Point B and Point C.
Volcan Overo in Sentinel image continues to fragment with no retained snowcover this summer, and bedrock expansion at Point A.
Sentinel images the loss of all snowcover on Sollipulli Glacier that continued from January until at least March 13 2022. Note the annual layers preserved in the glacier ice now exposed at the surface.
Langjokulen (La), Kvitisen (Kv), Bergfonna (Be) and Blaisen (Bl) ice caps on Edgeøya in Sentinel image from 8-20-2022 illustrating the lack of snowcover, limited firn areas and numerous annual layers. This pattern of annual layers due to glaciers being stripped of snow cover is becoming increasingly frequent. Note Andes last winter and Pacific Northwest summer 2021.
During the summer of 2022 Svalbard experienced an extended heat wave in August that led to loss of snowpack on a number of ice caps on Edgeoya.
Rapid snowcover loss on Rhone Glacier early in summer of 2022 in Sentinel images
The European Alps were hard hit in the summer of 2022 experiencing their most negative balances observed during the 70 years of observations.
In the summer of 2023 central Andean glaciers lost snowcover during the February heat waves.
Volcan Overo, Argentina with expanding lakes, blue arrows and fragmenting at yellow arrows.
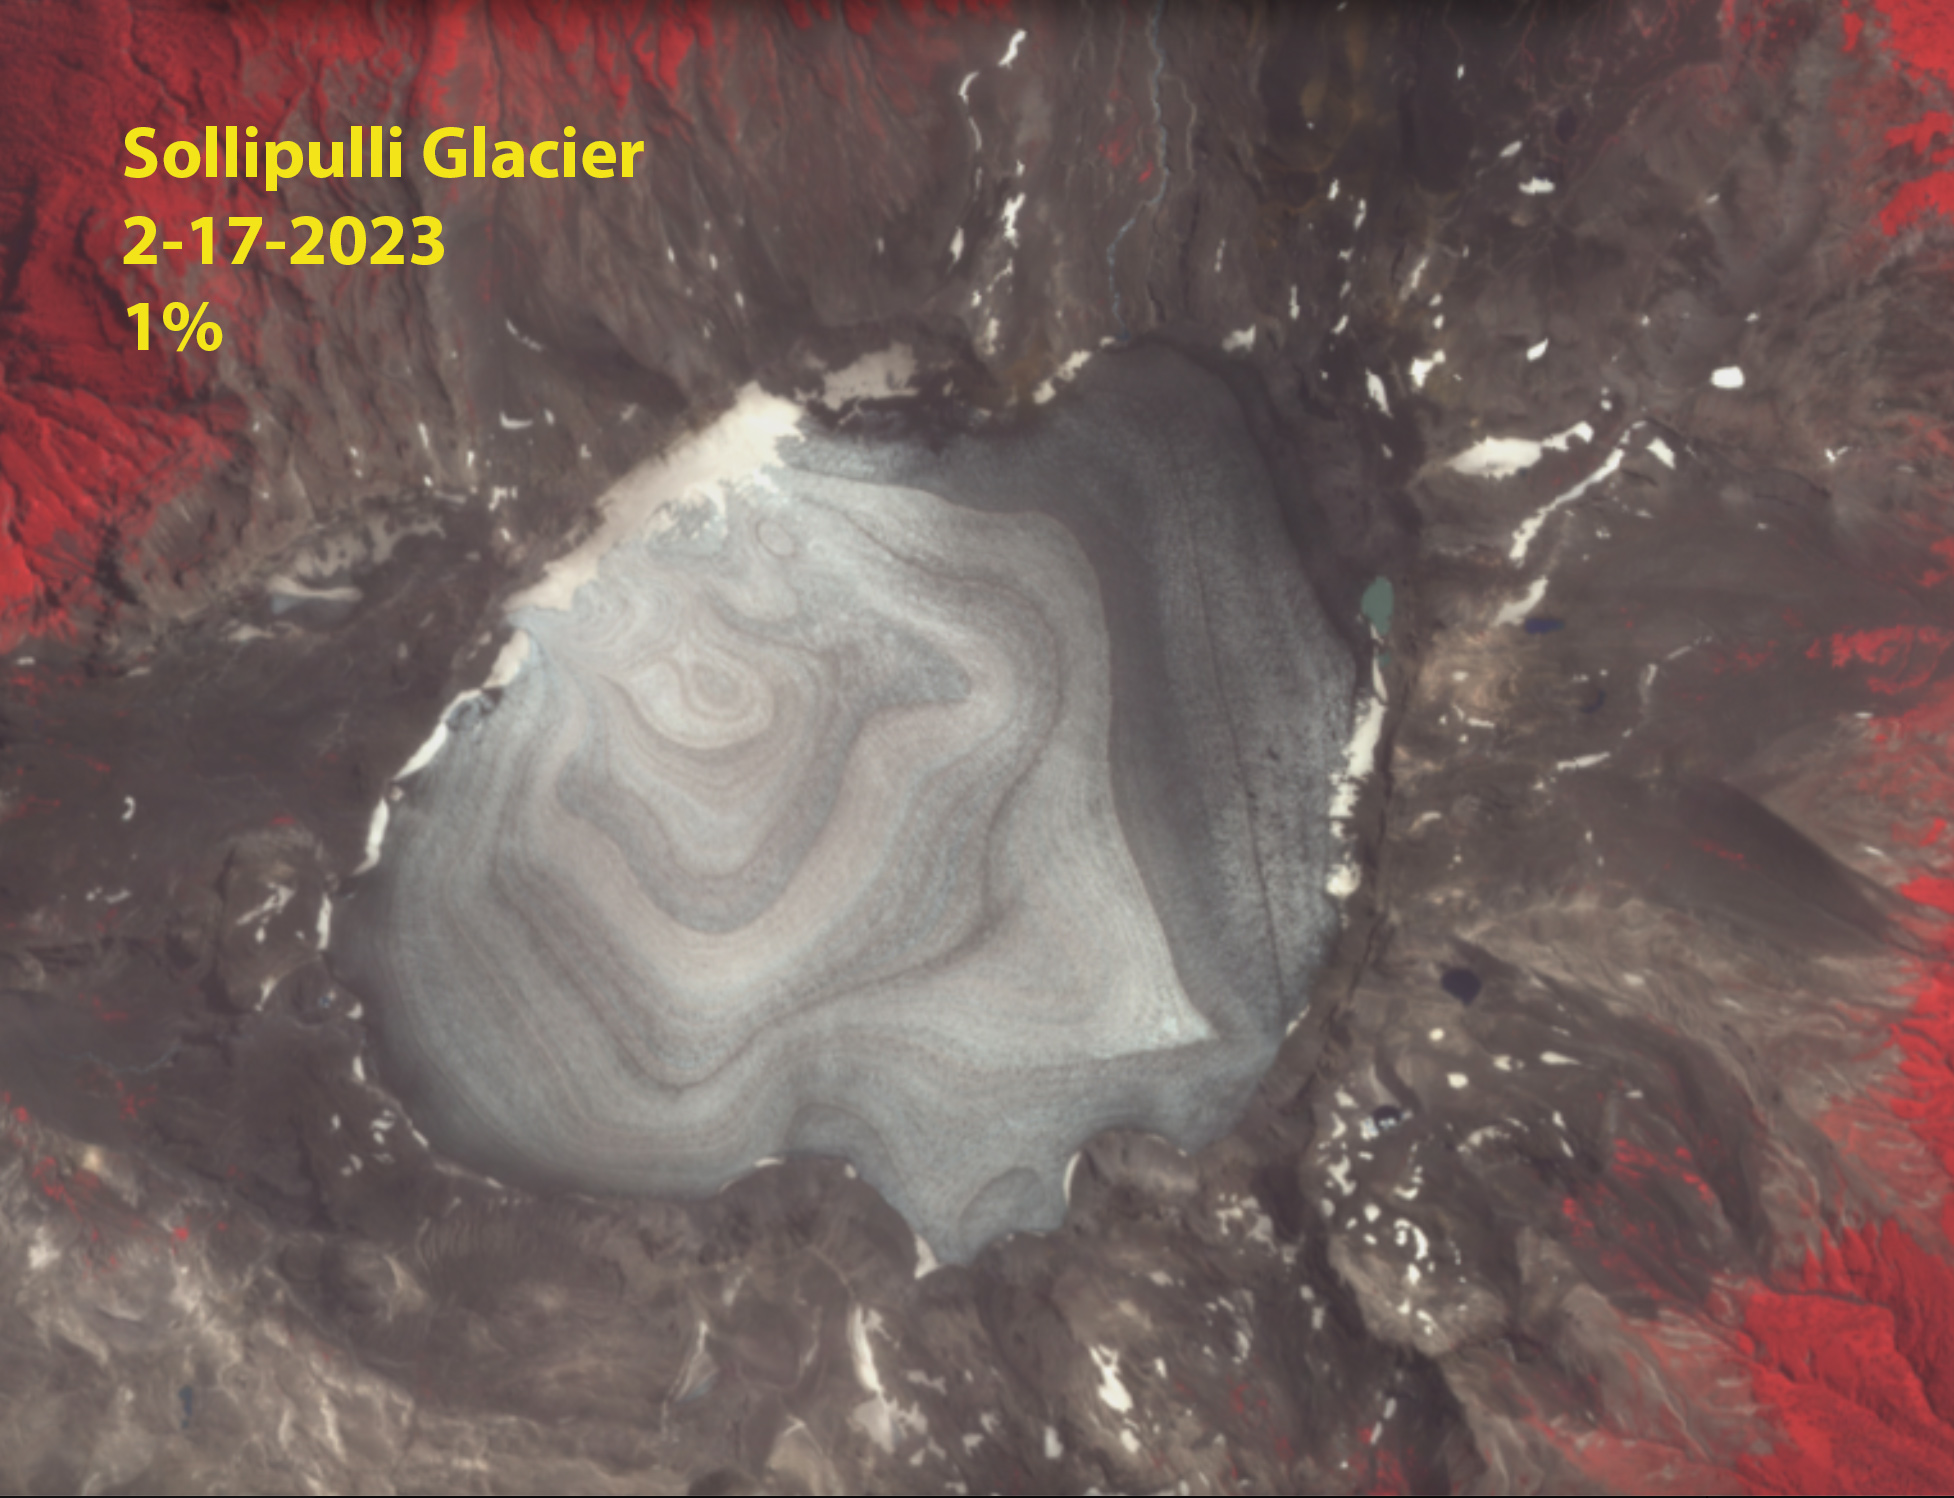
Sollipulli Glacier lost snowcover in February 2023
The bottom line is that glaciers are simply not compatible with recurring heat waves and the intensity and frequency of these is increasing. This is true from Arctic Canada to the Himalayas from the Andes to Antarctica. This year, for the 34th consecutive year, Alpine glacier volume in the world will decline; their business model is not sustainable with our climate.
1984-Landsat 5 is launched. The North Cascade Glacier Climate Project was initiated on Earth Day in 1984 with a goal of observing the impact of climate change on glaciers across this mountain range for 50 years. This was in response to a call to action by the National Academy of Sciences to have a project that monitored glaciers across an entire mountain range in the United States, and from climate scientist Stephen Schneider who challenged glaciologists at an IGS meeting in 1983 to begin the monitoring now, in order to identify the full scope of change. 50-Year Project of Glacier-article in National Geopraphic work
1985- 150,000 year climate record from Antarctic Ice Core . Snow covers the terminus of the glacier at the start of August note lateral moraines it is pressed up against.
1986-Glaciers and Ice Sheets and Sea Level: Effect of CO2 induced Climate Change-Conference Proceedings published. Thinning in 1985 and 1986 is exposing the lateral moraines, which are still ice cored.
1988-IPCC formed. The terminus remains strongly convex, with much better snowcover. The slope is impressive note the skier for scale.
1989-Mean Global CO2 levels exceed 350 ppm. Note the annual layers both paralell to the terminus and in upper right avalanche fan annual layers that are diagonal to the terminus.
1990-First IPCC Assessmenent report , Clean Air Act amended to address Ozone Depletion and Acid Rain. Heavier accumulation nearly barely the lateral moraines at the terminus, indicative of a strong avalanche season.
1991-Mount Pinatubo erupts ejecting 15 million tons of SO2 into stratosphere impacting climate. No bare ice exposed in early August for the first time since we began monitoring the glacier. A strong positive mass balane. Widespread snow in the forest below the glacier.
1992- UN Framework on Climate Change signed by 154 nations. ~50% of the glacier bare ice in early August with 90% exposed by the end of summer, resulting in large mass loss.
1993-Melt ponds observations in Landsat images on Wilkins Ice Shelf leading to breakup event published.Lower half of Columbia Glacier exposed by early August.
1994-Velocity data acquired/published for Pine Island and Thwaites Glacier. Third consecutive year of large mass balance losses, lateral moraine increasingly prominent beyond retreating terminus.
1995- Second IPCC report- Another year of negative mass balance on Columbia Glacier leading to thinning from the top to the terminus of the glacier.
1996-CO2 levels exceed 360 ppm. Columbia Glacier has better avalanching than in the last four years, but still loses mass.
1997-First Prius Produced-Kyoto Protocol adopted. Good accumulaiton is back leaving most of the glacier covered in snowpack right through August.
1998-Super El Nino-First year with a +0.50 or greater Global Land-Ocean Temperature anomaly. A warm summer strips the glacier of 90% of its snowcover and much of the retained 1997 firn is lost too.
1999-World Record Snowfall at Mount Baker (28.96 m-1140 inches)- where we measure glacier mass balance. First Year Arctic Sea Ice minimum is below 6 million km2. We crossed part of Blanca Lake on the ice enroute to the glacier buried in deep snow with avalanches reaching the lake shore.
2005-Hurricane Katrina strikes New Orleans a $240 billion disaster. Globally hottest year yet. Most negative balance of our monitoring program, with the glacier losing 98% of its snowcover.
2006-First year exceeding nine million acres burned in US by wildfires. Impact of continued mass losses is a thinner glacier, with a reduced slope at the terminus.
2007-Fourth IPCC report-Arctic Sea Ice falls below 4 million km2 for first time. The west side avalanche fans, on left now only areas of persistent accumulation, hence their slope expanding across glacier.
2009-37% Increase in US Wind Power Capacity. Glacier retreat since 1984 exceeds 100 m. Field work occurred during a record heat wave. This leads to an increased focus on heat wave impacts on the glaciers.
2011-Global Wind Power capacity exceeds 200 GW. Deep snowpack remained through the summer leading to a signficant mass gain.
2012-Arctic Sea Minimum record at 3.39 million km2. Record loss from Greenland Ice Sheet. Snowpack again persisted through early August, leading to a small positive balance.
2013-Globally 45 Billion dollar weather disasters including 18 flooding events. Extensive summer melt led to snowpack loss and firn exposure from 2011 and 2012.
2014- Global Solar and Wind Power Capacity exceeds 500 GW. Marine Heatwave the Blob in Pacific Ocean. The summer of 2014 was the warmest we had experienced, which led to rapid snowpack removal in late summer.
2015-Paris Agreement-Over 10 million acres burned in US by wildfires. The winter was poor and the summer hot leading to no retained snowpack even in avalanche fans and the formation of a new lake at the terminus.
2017-Global Electric Car sales exeed 1.5 million units. Coral Reef Bleaching event impacts 2/3 of Great Barrier Reef. New lake continues to expand as glacier thins and retreats.
2018- Solar and Wind Energy installed capacity both exceed 500 GW. Retreat since 1984 exceeds 200 m. No snowpack retention except in avalanche fans.
2019-Global Electric car sales exceed 2.2 million units. Only 14% of the glacier retained snowpack by summer’s end.
2021- Over 40 Billion dollar weather disasters in last two years in US. A climax avalanche event in February led to deep snowpack on the glacier. An early season heat wave melted off all snow except in the large avalanche fans.
2022- We will be back in the field for year 39 looking at snowpack depth, melt rate and extent across the glacier.
The southwest side of Kokanee Glacier from the ridge with Cond Peak at the Right and Sawtooth Ridge at center.
By Ben Pelto, PhD, UBC Mitacs Elevate Postdoctoral Research Fellow
Since 2013 I have been working on the Kokanee Glacier. Located just outside of Nelson in southeastern British Columbia (BC), the Kokanee Glacier is due north of the Washington-Idaho border. This work began as part of a five-year study of the cryosphere in the Canadian portion of the Columbia River. This project was carried out by the Canadian Columbia River Snow and Glacier Research Network — spearheaded by the Columbia Basin Trust. The glacier research, which included the Kokanee Glacier, was led by my former PhD supervisor at the University of Northern British Columbia Dr. Brian Menounos and myself. At the culmination of the project, we published a technical report, and a plain language summary of that report. When the five-year project officially ended in 2018, I learned of a BC Parks program called Living Labs, which offers funding for climate change research in BC Parks, particularly research which documents change and guides protected area management. With Living Labs funding in 2019-2021, I have kept the annual mass balance trips going — now a continuous nine-year record — and a winter mass balance trip in 2021. In conjunction with this, Brian Menounos has secured continued funding (continued from our 5-year project) from BC Hydro for LiDAR surveys of the glacier every spring and fall. These surveys are carried out by the Airborne Coastal Observatory team from the Hakai Institute.
During the 2021 spring trip, we found that the Kokanee Glacier had an average snow depth of 4.4 meters. Using snow density measurements collected with a snow-corer, we found that the winter balance for 2021 was 1.91 meters water equivalent (m w.e.). This value was lower than the 2013-2020 average of 2.18 m w.e. (Pelto et al. 2019).
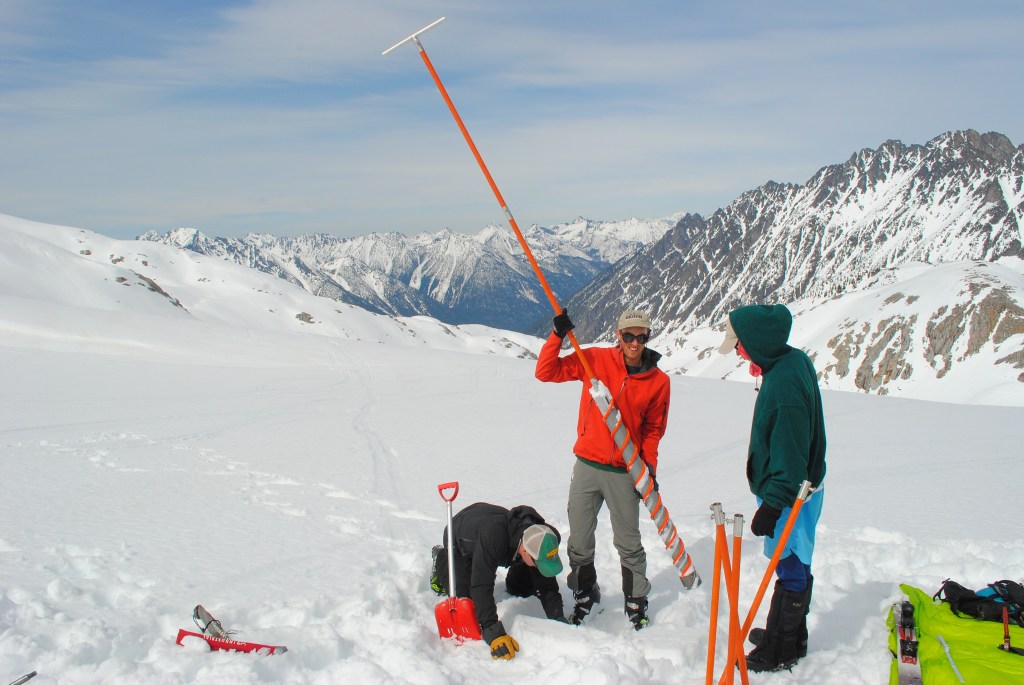
Ali Schroeder probing snow depth on the Kokanee Glacier while Joel McBurney and Drew Copeland look on.
Ben Pelto with the snow corer with Tom Hammond and Micah May on Kokanee Glacier. Photo: Jill Pelto
With a below average winter balance, 2021 would need to feature a cool summer. Instead, multiple heat waves occured, with temperature records being broken across the province. Wildfires burned all over BC and the neighboring US states of Washington and Idaho, swamping the region in smoke for weeks on end. Rather than mitigate for a slightly-below-normal snowpack on the Kokanee, summer 2021 took a blow-torch to glaciers across the region.
We hiked into the Kokanee Glacier on September 12, stopping under a boulder to wait out proximal booms of thunder and flashes in the clouds. We got pelted with bursts of both hail and graupel, and soaked in the rain, before gingerly working our way up boulder field and talus that is climbers route up the Keyhole to the Kokanee Glacier. Like the satellite imagery had shown, there was no snow in sight on the glacier — bare ice only. Instead of my usual camp on the snow, we chose a climbers bivy site to set our tent.
Camp in the Keyhole — a total lack of snow forced us to skip camping on-glacier.
The Keyhole route, a challenging scramble with 43 lb packs.
Stepping out onto the glacier, we immediately ran into difficult terrain, crevasse bridges of snow or firn had collapsed, leaving bedroom-width crevasses gaping open, necessitating an exercise in maze navigation. Our first stop was a stake at 2600 m which typically retains snow (50 to 100 cms), but this year had lost 1.6 meters. In fact, two stakes drilled at the site in 2015 and subsequently buried by snow had melted out, demonstrating that all snow/firn from the intervening years had been lost. This observation clued me in to the magnitude of melt to expect this year.
The first stake visited, showing 1.6 m of melt
Exposed layers of firn in a crevasse by the stake, showing 1.5 m-thick annual layers — now being eaten away by melt.
Travel on the glacier was more challenging in spots, but overall faster, as the total lack of snow meant that most crevasse bridges were gone, requiring less probing of crevasse bridges and roped-travel. Later, using a satellite image from the dates of our visit, I mapped the retained snow cover, limited to two tiny patches high on the glacier’s east side. The accumulation area ratio (AAR), or the ratio of snow cover to bare ice/firn was <0.01, meaning that under 1% of the glacier was covered in snow.
The upper reaches of Kokanee Glacier to Cond Peak (2800 m) with no retained snow in 2021. Bare ice is exposed on the lower half of the image, and firn, or multi-year snow above
The brown surface is multi-year firn, exposed by the loss of snow. In a typical year, the snow line would be visible here. The white surface below the brown is bare glacier ice.
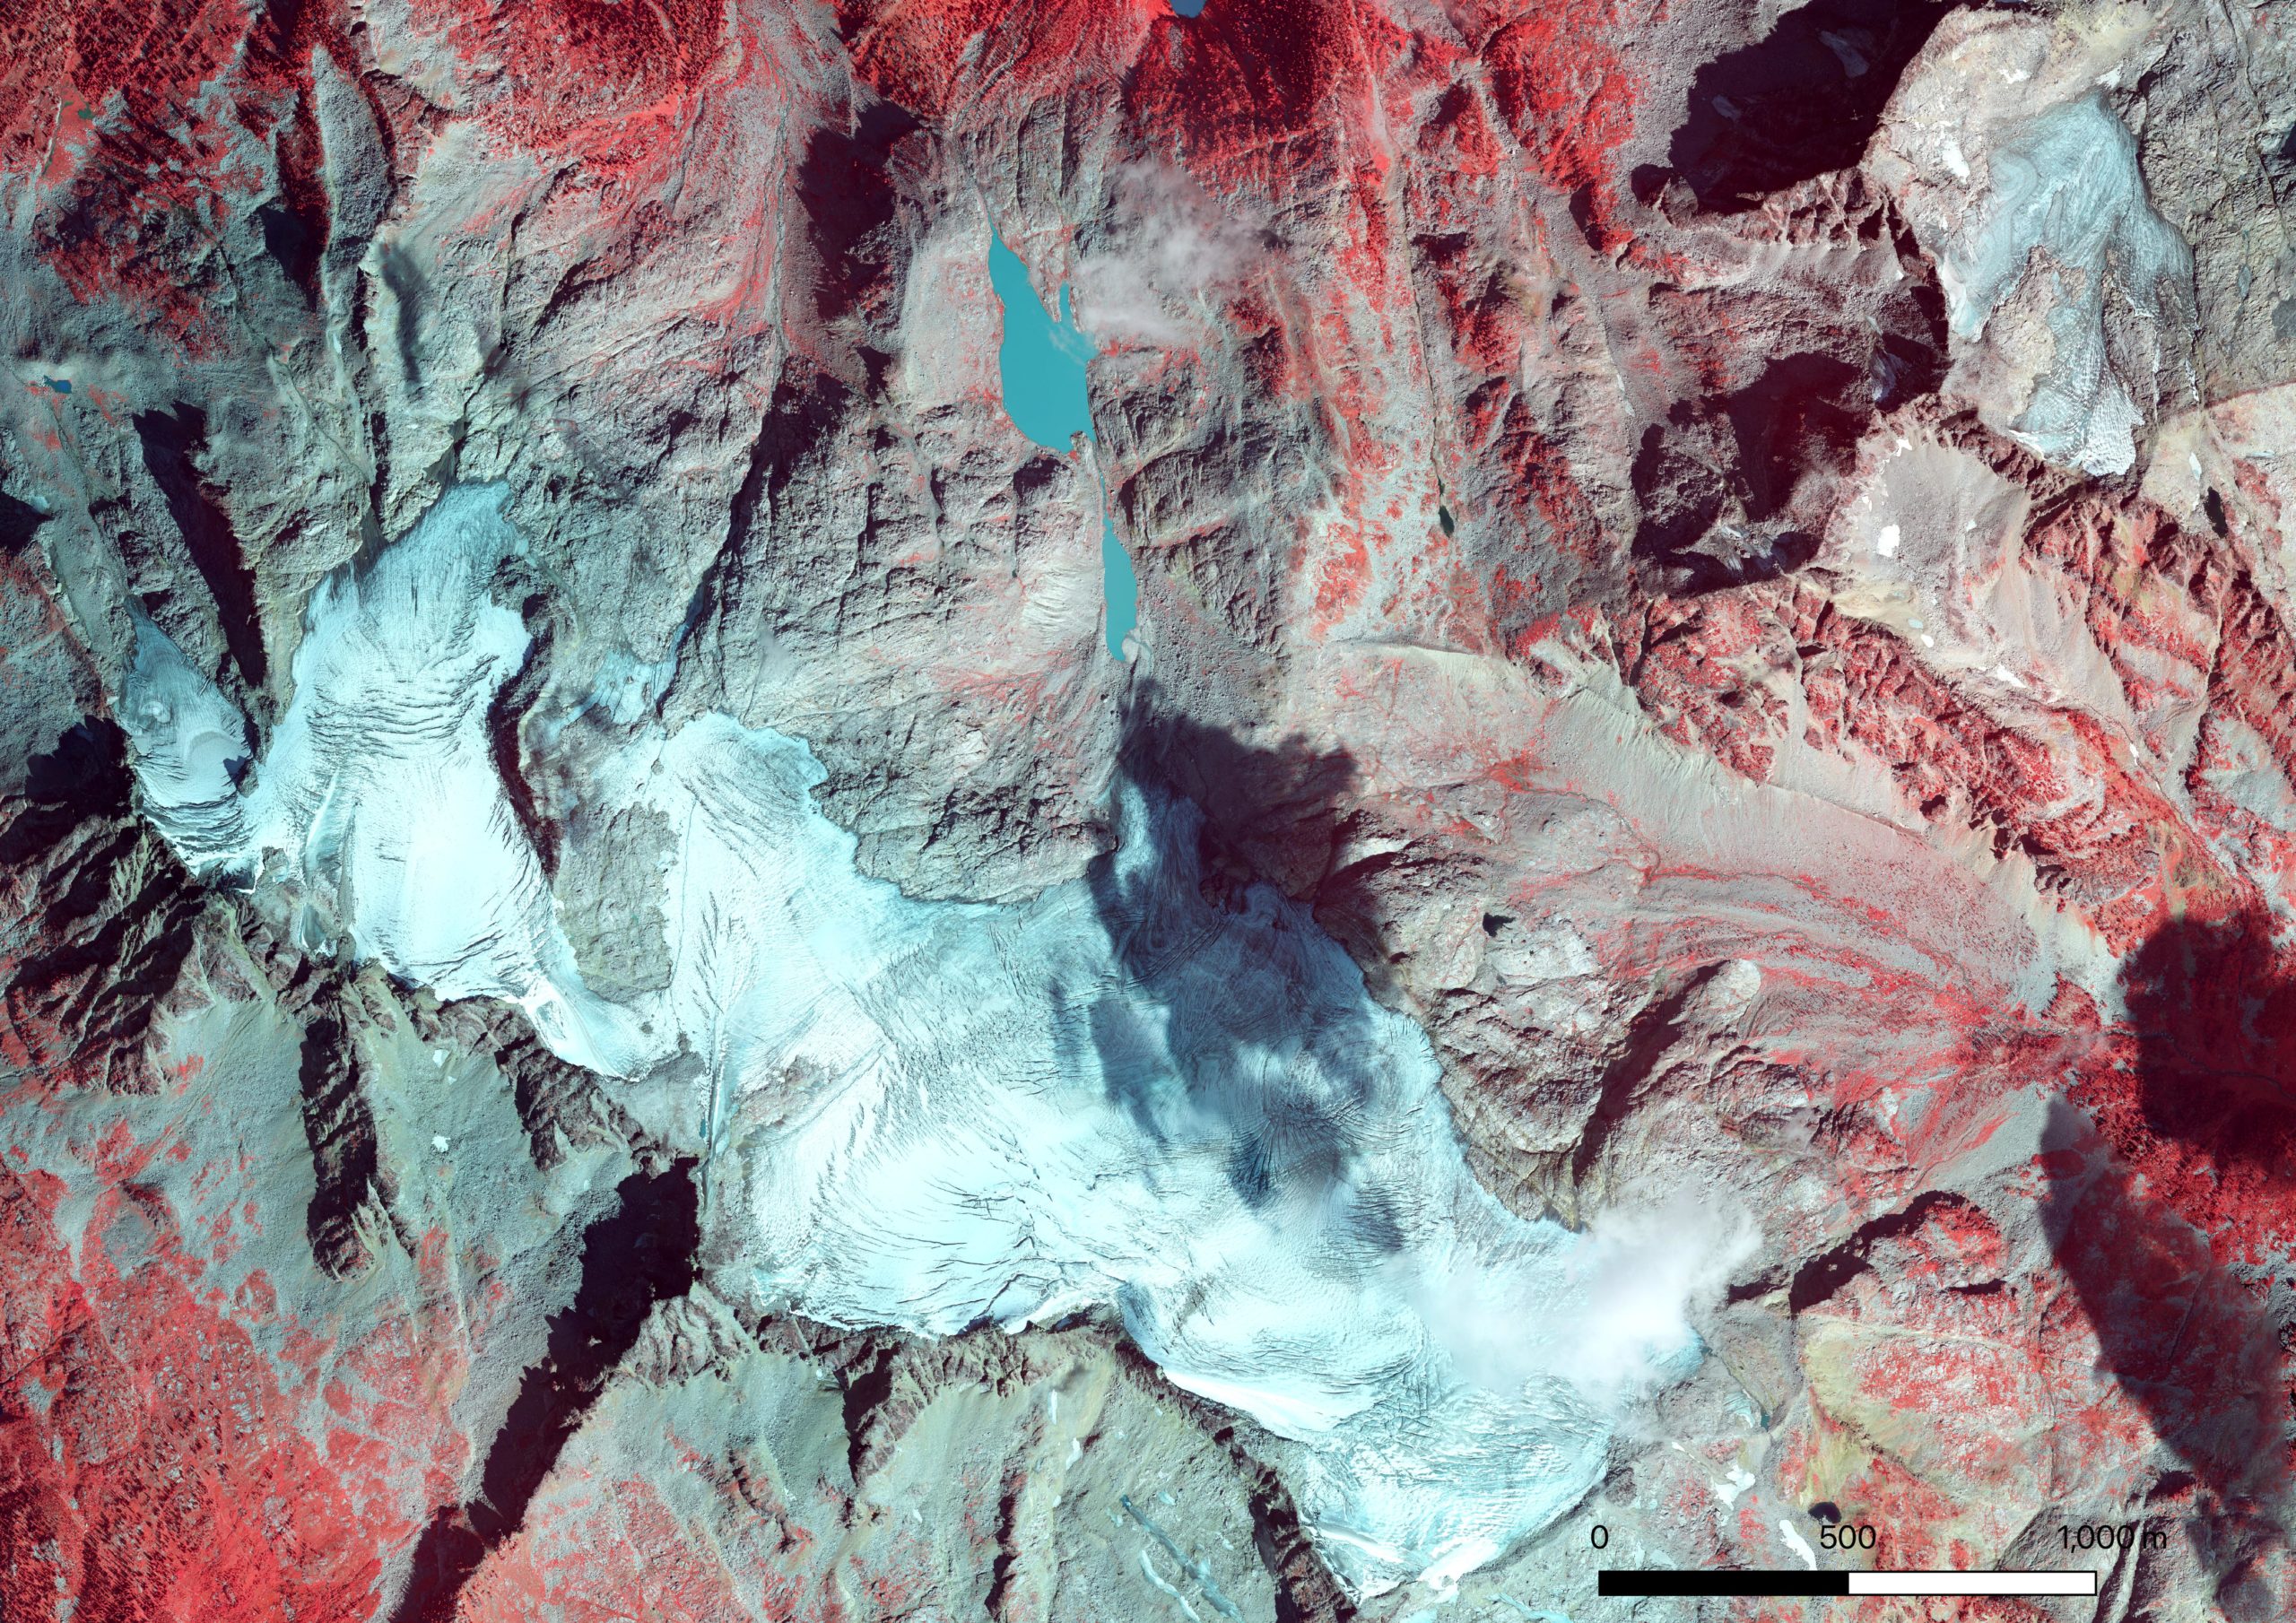
Near infrared-Red-Green 30 cm resolution ortho image of Kokanee Glacier from the Hakai Geospatial/ACO team on Sept. 2, 2021. Note how badly crevassed the glacier is, most crevasses are exposed with no retained snow. The white color and mottled appearance over the upper glacier is a skiff of overnight snow just a few centimeters thick that melted off the next day. Also note bare ice patches exposed under formerly perennial snow patches that have shrunk in recent years and now are disappearing.
Visiting the toe of the glacier, our lowest stake indicated just under 5 m of ice melt, double that of 2020. In May, this location had 3 m of snow; the combined melt of snow and ice (loss of winter snow and glacier ice) is termed the summer mass balance, and at this site was -6.2 m w.e., far higher than the usual -4 m w.e. I also noticed that much of the thin ice along the margin of the toe was gone, and a little rock nunatak (rock island) that appeared in 2015 (images below) became a bite out of the glacier rather than a island. We estimated that the toe experienced 60 m of retreat. Over the past 5 years, the Kokanee has lost an average of 16 m in length annually. Expecting to see above average thinning and retreat, I was still startled to see how diminished and thin the toe looked.
2015: a small hole forms in the glacier margin above the toe, Jesse Milner in the foreground
2021: the hole is now a bite out of the glacier with two prominent rock knobs
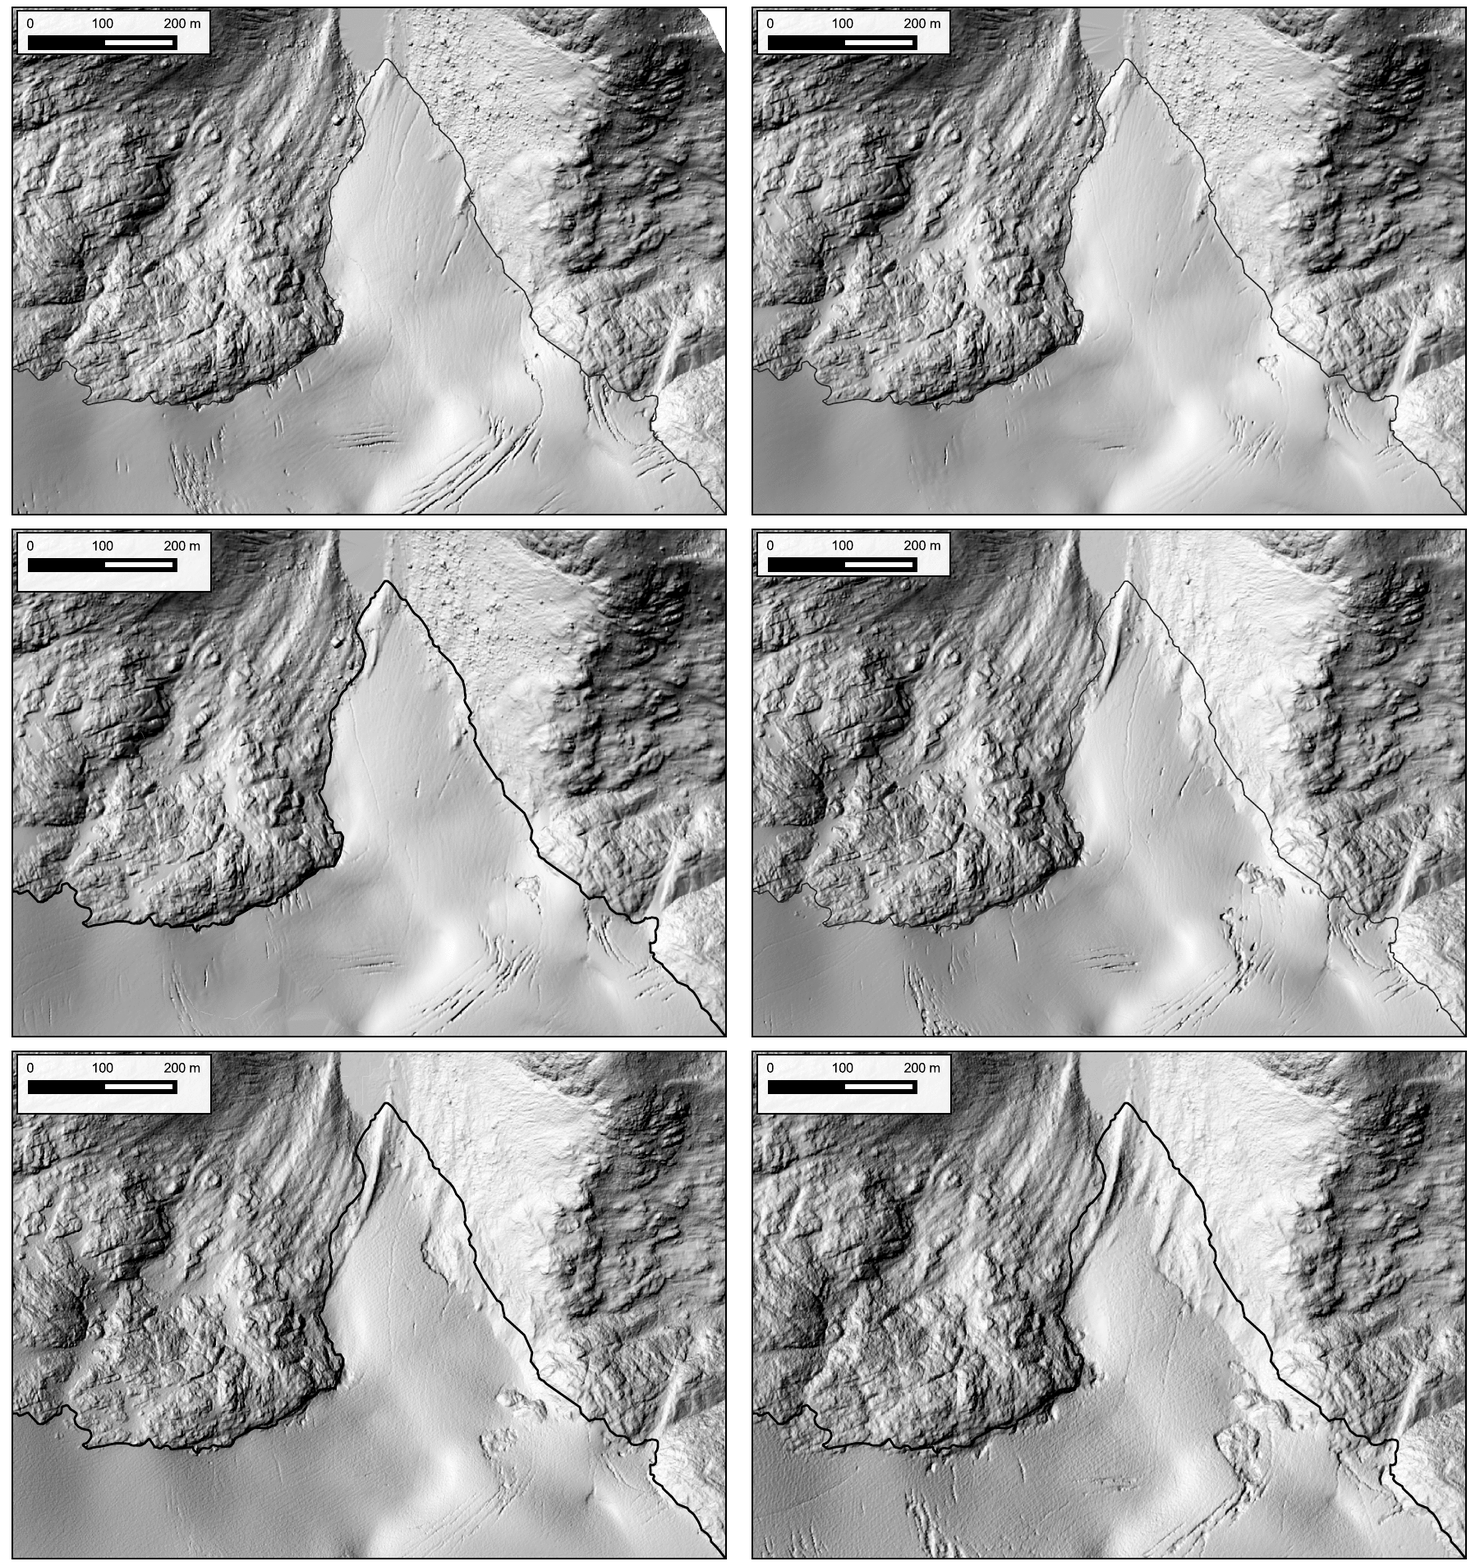
A week prior to my field visit, the Hakai Institute ACO team flew a LiDAR survey of the Kokanee Glacier as part of their work with Brian Menounos at UNBC. Comparing this year’s glacier surface with that from last year’s survey, Brian found a whopping 2.55 m of thinning. After mapping the glacier facies (ice/firn/snow) to represent on the density of the observed thinning, this equates to a glacier mass balance of -2.16 m w.e., higher than the previous record loss of -1.20 m w.e. in 2015.
LiDAR-derived height change 2020 to 2021 from 1 m resolution DEMs from Brian Menounos and the Hakai Institue ACO team. The black line is the 2021 glacier outline, note the bite out of the glacier above the toe to the NE corner of the glacier. Small red patches off-ice are seasonal snow patches losing mass. Points represent mass balance observation locations.
Kokanee Glacier terminus from 2015 to 2021. 140 meters of retreat for 23 m/yr. Data in the GIF are from Hakai Institute and Brian Menounos of UNBC ACO glacier surveys.
Back home, I crunched the numbers from our glaciological observations of mass balance (consisting of 14 ablation stakes this year) and calculated a mass balance of -1.97 m w.e. With Brian, I published a paper in 2019 (Pelto et al. 2019) comparing glaciological (field) and geodetic (LiDAR) mass balance estimates and found them to be similar — if some factors like snow and firn density were carefully considered. The small difference between estimates is likely due to timing (the LiDAR mass balance is from 8/26/2020 to 9/3/2021, while the field mass balance is 9/12/2020 to 9/13/2021), and that there was a skiff of fresh snow (likely 5-10 cms) on the glacier during the 2020 LiDAR survey.
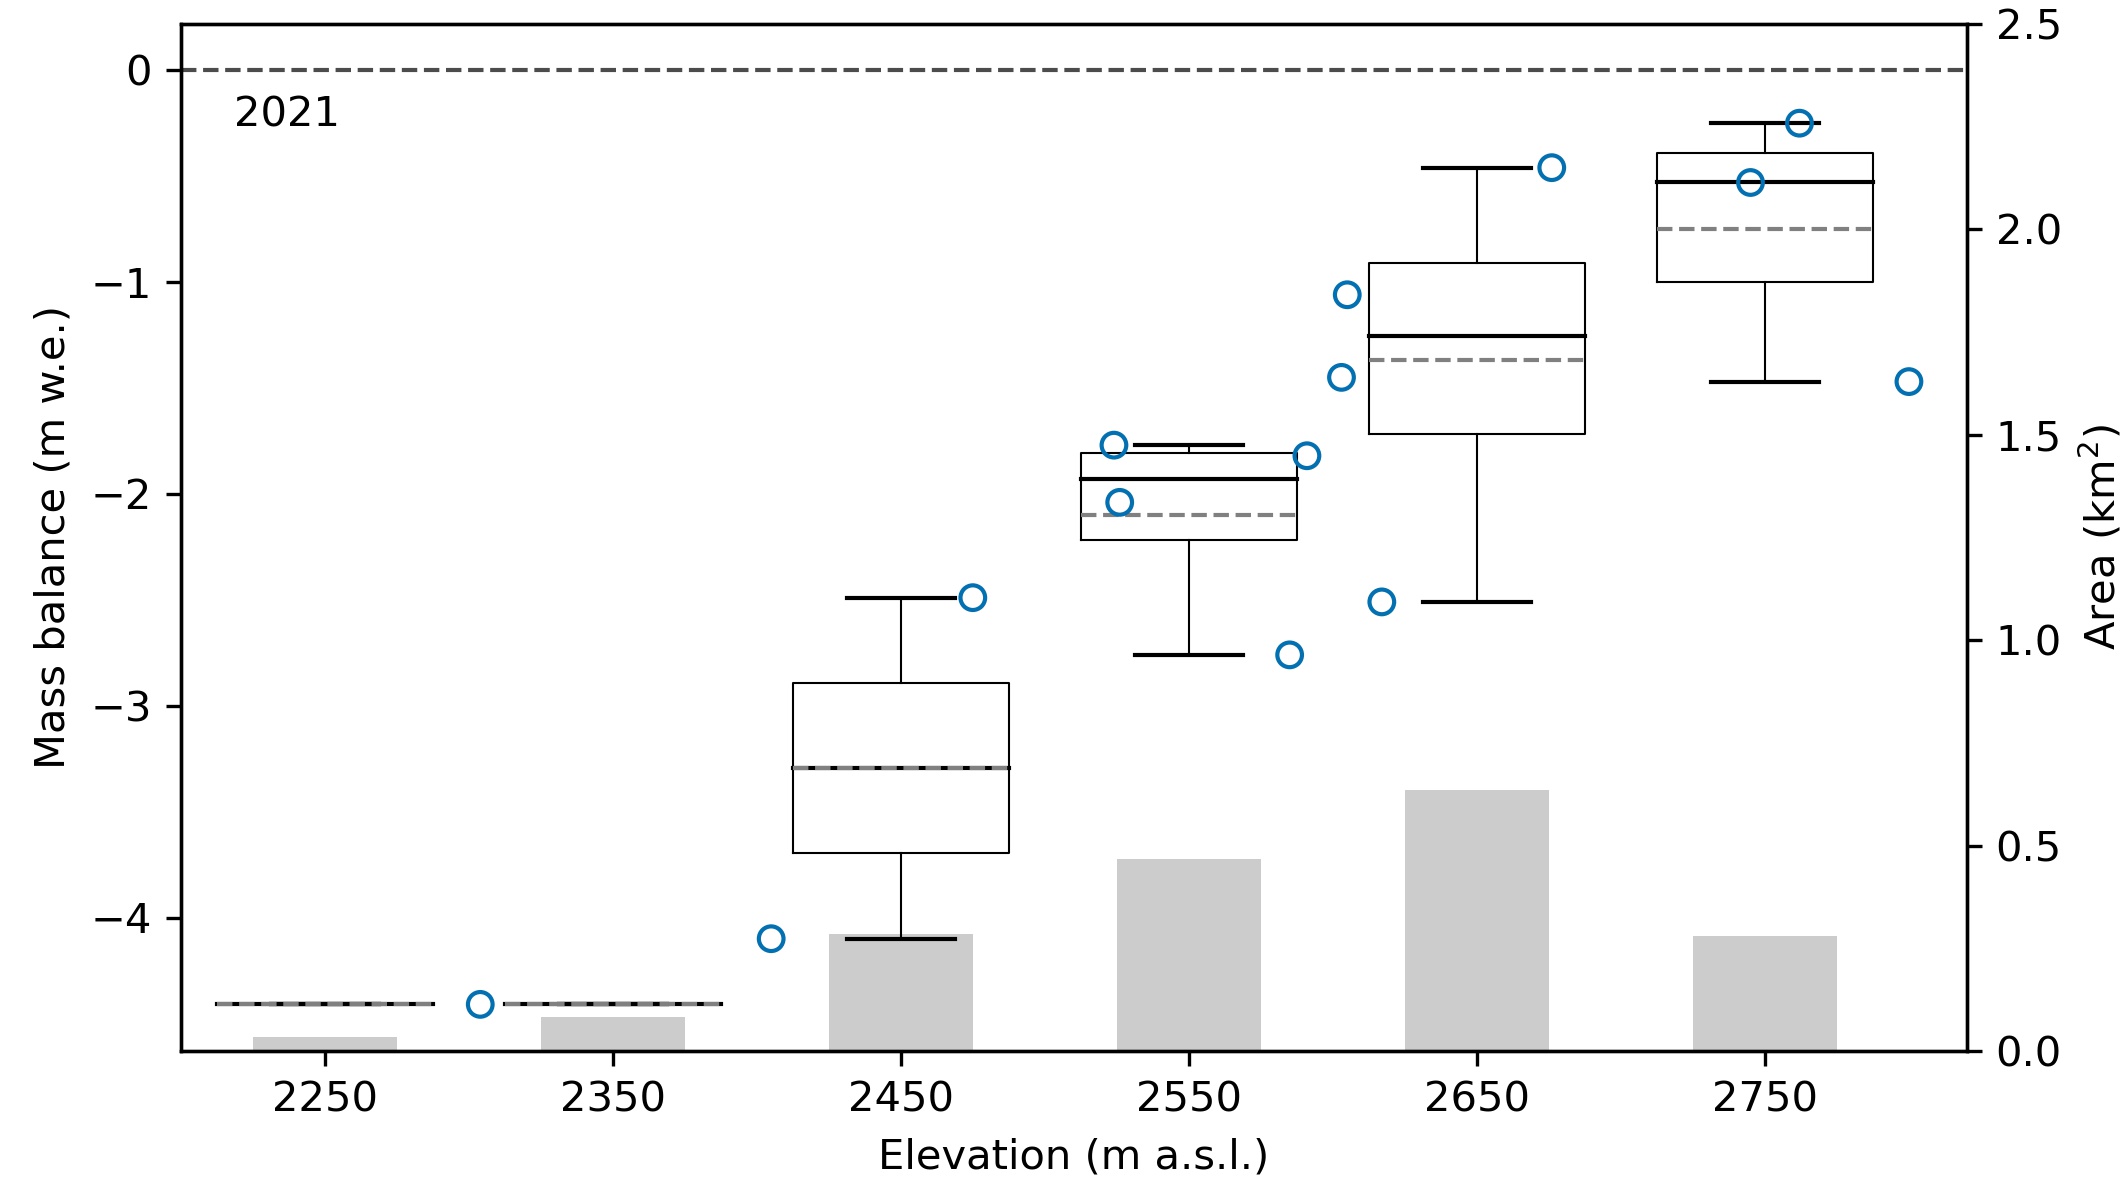
Kokanee 2021 glacier mass balance. Blue dots are observations. The boxplots show the 100 m bins used to estimate glacier-wide mass balance (median line in black, mean dashed grey line). The grey bars depict the area of the glacier for each 100 m elevation-band
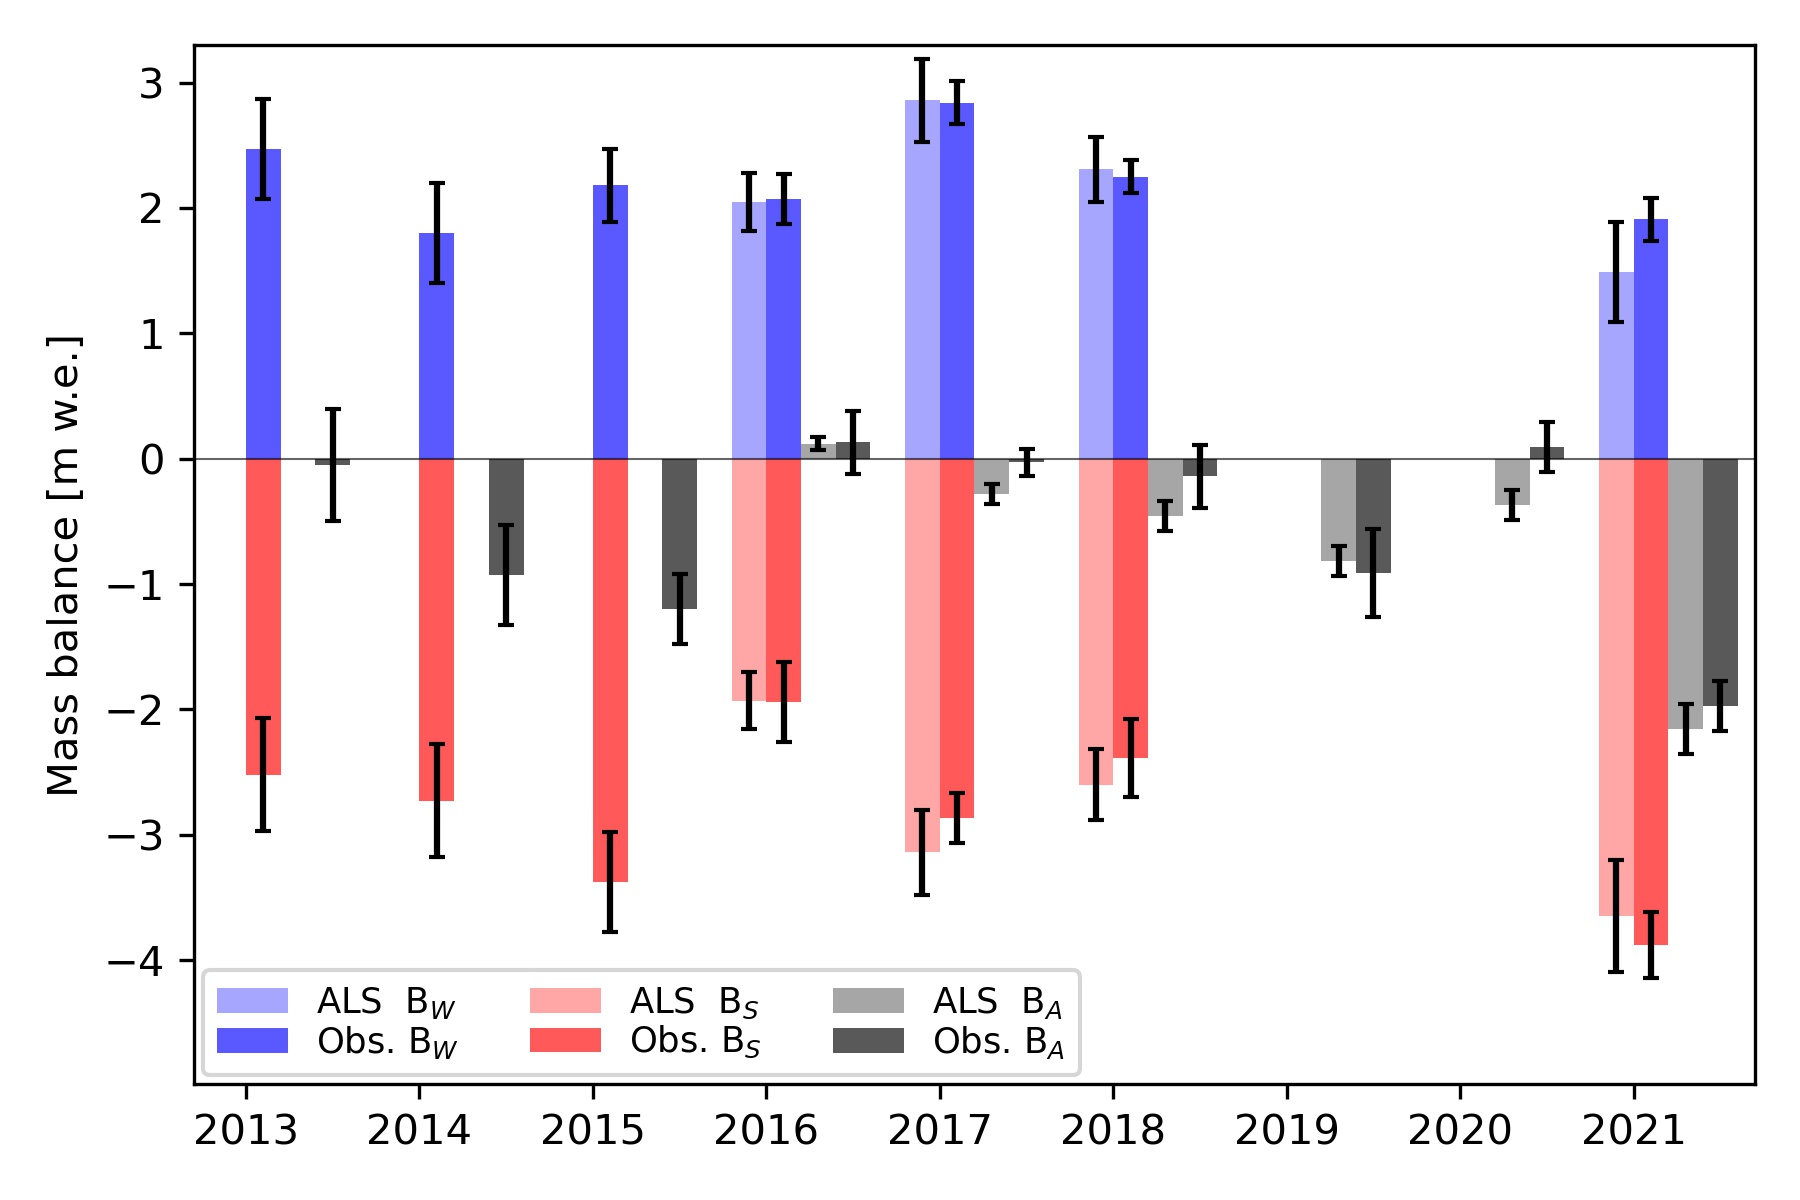
Seasonal and annual mass balance for Kokanee Glacier from LiDAR and glaciological measurements for each balance year from 2013 to 2021 with 2σ uncertainties.
In 2017, I visited the Kokanee Glacier to measure it’s ice thickness using ice-penetrating radar. I found that the glacier on average was 43 m thick using my measurements to tune a glacier model. I published these results in the Journal of Glaciology (Pelto et al. 2020). In the five years since that work, the glacier has lost over 4.8 m of total thickness. That equates to a loss of over 11% of its total volume. 2021 alone wasted away 6% of the glacier’s total volume — an eye-watering number for a single year.
Cumulative mass balance for Kokanee Glacier 2013-2021 from both field and LiDAR measurments. LiDAR-derived mass balance began in 2016.
The heat of 2021 was an outlier, but years like 2021 and 2015 take a toll on the glaciers. Currently, glaciers in western North America are losing around 0.75 m of thickness per year (according to my work in the Columbia Basin (Pelto et al. 2019) and work by Brian Menounos for all of western North America (Menounos et al. 2018)). The better years for Kokanee Glacier (2016 mass balance: +0.12 m w.e.) pale in comparison. That meager surplus was lost the very next year (2017).
Herein lies the issue, positive mass balance years in recent decades are not large enough to offset even average years; hot dry summers take years off the lifespan of glaciers across western North America.
Losing 6% of it’s total volume in 2021, the best we can hope for Kokanee Glacier is a few near-neutral or positive mass balance years to cover back up the exposed firn, to keep the glacier albedo from becoming too dark and increasing the rate at which ice can melt.