Continental Glacier in 1994 Google Earth and 2016 and 2022 Sentinel images, illustrating the separation at the black arrows, into the northern middle and southern parts, with an impending separation at green arrow.
Continental Glacier is a long plateau glacier draped along the continental divide in the Wind River Range, Wyoming. It drains into Torrey Creek and then the Wind River. In 1994 this glacier extended 5 km from south to north with an area of 2.4 km². In 2012 Van Looy et al (2013) used GPR to determine ice thickness and project how long the glacier could last. They found 59% of the glacier was less than 40 m thick, with two cirque depressions filled with deeper ice exceeding 150 m. They found a thinning rate of 0.3 m/year for the 1966-2012 period. They did not include the southern part of the glacier in their study.
In 2016 the glacier is in three parts and glacier area has been reduced to 1.9 km². By 2022 additional fragmentation at the green arrow in the middle segment is imminent. The northern and southern parts are wasting away rapidly. A closeup of the northern section of the glacier in 2022 illustrates how thin, fragmented, and stagnant the ice has become. Point A-E indicate bedrock areas emerging amidst northern part. Point F-I indicate very thin, old, dark ice in the middle part. This glacier is following a similar path to the Grasshopper Glacier just to the south. Van Looy et al (2013) noted that in the next century the volume would be reduced by 43% and the glacier would be lost in 300-400 years. The pace of loss has increased significantly with volume loss of ~2% per year since 2013, which will lead to loss of all areas with less than 40 m of ice in 2012 being lost by 2040. The two areas of deep ice will persist much longer. This same trend has led to the loss of Heap Steep Glacier, Harrower Glacier and Twins Glacier in the Wind River Range since 2015.
Screenshot
Continental Glacier in 9-4-2022 false colar Sentinel image. Point A-E are bare rock areas amidst northern part of glacier. Point F-I dark, old thin ice in the middle part.
Lilliehöökbreen terminus in 2000 was a continuous 11 km front fed by the tributary glaciers Supan (S), Hellman (H), Bjorlykke (B), Kutte (K), Darboux (D), Becqueret (Be), Cailletet (C), Bruckner (Br) and Forbes (F). By 2023 the continuous front was 8 km long having separated from Supan, Forbes, and Bruckner. Landsat images from 2000 and 2023 indicate a 2.5 km retreat resulting in a ~17 km² fjord expansion.
Lilliehöökbreen is a tidewater glacier at the head of Lilliehöökfjorden in Albertland-NW Svalbard. The glacier had retreated at ~50 m/a year during the 1990-2008 period (Nuth et al, 2013). This glacier has a large region below 400 m, Noel et al (2020) observed that a 100 m rise in the ELA from 350 m to ~440 m led to extensive mass losses on Svalbard glacier increasing retreat rates.
The Lilliehöökbreen terminus in 2000 was a comglomeration of input from tributary glaciers Supan, Hellman, Bjorlykke, Kutte, Darboux, Becqueret, Cailletet, Bruckner and Forbes. Lilliehöökbreen’s calving front was a single unit that was 12 km long and typically around 50 m high. By 2013 Forbesbreen and Suppanbreen were no longer part of the continuous front with ridge #2, #3 and #10 reaching the ice front. By 2020 ridge #4 was just reaching the ice front after a period of rapid retreat of the main terminus, ~1 km in seven years. In 2023 Brucknerbreen is completely separated by ridge #4 and the continual calving front is now 8 km long. The glacier has retreated 2500 m in 23 years, more than 100 m/year. This has expanded Lilliehöökfjorden by 17 km². Ridge #9 is nearing the ice front as well. Bjorlykke has experienced the least retreat of the tributaries feeding the Lilliehöökbreen terminus and Cailletet the most.
Screenshot
Toposvalbard map of the region indicating continuous 12 km calving front of Lilliehookbreen in 2005.
Lilliehöökbreen terminus in 2014 was a continuous 12km front fed by the tributary glaciers Hellman, Bjorlykke, Kutte, Darboux, Becqueret, Cailletet, and Bruckner. By 2020 the continuous front was 9.5 km long having separated from Supan, and Forbes. Landsat images from 2000 and 2020.
Hall Peninsula Ice Cap east of Popham Bay is snow free on 8-14-2023. Comparison of Landsat images from 2014 and 2023 arrows indicate four locations where the ice cap is fragmenting and at each Point D is an emerging/expanding bedrock area amidst the ice cap.
Hall Peninsula is host to many glaciers and ice caps, almost all unnamed. Here we examine the largest ice cap on the Peninsula using Landsat and Sentinel images. This ice cap is shrinking like Grinnell Ice Cap and Terra Nivea Ice Cap due to limited retained snowcover most years.
The center of the ice cap is just over 1000 m in elevation. By early August in 2023 the ice cap had lost all snowcover. The emergence and expansion of a dozen bedrock areas amidst the ice cap indicates the ice cap is thinning across most of its extent. At Arrow C and E the ice cap has fragmented. At Arrow A and B the fragmentation is nearly complete. Given the lack of any retained snowcover in several recent years, this ice cap will not survive current climate conditions.
Hall Peninsula Ice Cap on 8-6-2023 in Sentinel images. Arrows indicate locations of fragmentation. Point D marks expanding bedrock areas amidst the ice cap.
Eagle Island Ice Cap in Sentinel image from Feb. 19, 2023 illustrating only small patches of snowcover left, 5-10% of ice cap.
On February 19, 2023 Eagle Island Ice Cap, Antarctica has less than 10% snowcover. This is less snowcover than observed even after the period of record warm weather over the Antarctic Peninsula in February 2020. Temperature when the all time Antaractica temperature record was set at Esperenza Base. That year also led to record melt and ponding on the George VI Ice Shelf (Banwell et al, 2021). Here we examine Landsat and Sentinel imagery of the Eagle Island Ice Cap (63.65 S 55.50W), 40 km from Esperanza, to identify surface melt extent and surface melt feature development in 2020, 2022 and 2023. The summit of the ice cap is at 250-300 m and it has an area of 21 km².
In 2020 we observed blue ice areas (BI) and saturated snow areas (SS) rapidly developed from a snow covered ice cap during the heat wave (NASA EO, 2020). The impact of short term melt events like this on an ice cap like this, is visible and significant for annual mass balance, but not large in terms of long term glacier mass balance (volume change) and area. In 2022 a similar patter nof blue ice developed, but no saturated snow. In 2023 the loss of snowcover is nearly completely yielding a more extensive bare ice and firn surface area. This is the result not of a heat wave but of a consistenly warm summer. At Esparanze Base:
November mean temperature 2.5 C above average
December mean temperature 0.5 C above average
January mean temperature 1.5 C above average
February mean temperature 1 C above average
This yields an mean melt season temperature 1.5 C above average compared to 2020 that had a mean average temperature 0.5 C above average. The most anomalously warm month was November. This led to a mostly snow free ice cap by January 10. The ice cap then experienced a month of mostly snow free conditions with the darker ice melting more rapidly then the snow would. This in particular will lead to marginal retreat of the ie cap along bare rock margins.
Eagle Island Ice Cap in Sentinel image from Jan. 10, 2023 illustrating only 15-20% snowcover left.
Eagle Island Ice Cap, Antarctica in Landsat images from Feb. 4, 2020 and Feb. 13, 2020. Point E indicates an are area of snow/firn that is saturated with meltwater. Point A and B indicate locations where the amount of bare rock/ground and hence albedo have changed dramatically.
Volcan Peteroa glaciers in Sentinel images from March 2016 (below) and March 2023 (above). This illustrates fragmentation, 50% area loss, and a new lake formation. All the result of repeated snowcover free glaciers.
For an alpine glacier to survive it must remain mostly snowcovered throughout the year, even at the end of the summer. This is one reason for the majesty of glaciated mountains, they shine brightly even in summer. This summer in the Central Andes of Argentina and Chile, just as in 2022, I have chronicled the near total loss of snowpack due to summer heat waves, leading to dirty/dark glaciers (Pelto, 2022). The heat wave this summer led to maximum temperature anomalies 3-5 C during the first half of March in the Central Andes of Argentina (SMN Argentina, 2023). An ice surface melts faster than a snow surface and the darker surface of the glacier also enhances melt rate leading to more rapid area and volume loss. This includes fragmentation and rapid expansion of bedrock areas amidst the glacier, other regional glacier obsrvations include: Sollipulli Glacier, Rio Atuel Glaciers, Palomo-Cipreses Glacier and Volcan Overo Glaciers,Here we examine Volcan Peteroa glaciers on its north flanks, which straddles the Chlile-Argentina border during the 2016-2023 period using Sentinel images. Reinthaler et al 2019 observed a ~2% annual area loss of Volcan Peteroa glaciers.
Here we examine the impact of several years of snow cover loss on the Volcan Peteroa glaciers. In 2016 it is evident there are six key ice masses on the north flank of the glacier A-F, with a combined area of 4.5 km². In 2022 early snowcover loss led to rapid glacier thinning and lake formation, see below. In 2023 the glacier at Point A has contracted by 50% to 0.22 km². At Point B and C the glacier has separated and is now two fragments with area of 0.36 km² and 0.12 km² respectively. At Point D a new lake has expanded rapidly in 2022 and 2023, the lake has an area of 0.12 km² and the glacier a area of 1.21 km². At Point E the glacier fragmented and pulled away from D and its two fragments have an of 0.36 km². At Point F the glacier has melted away. The combined area of 2.27 km² is ~50% of the glacier area just seven years prior. This is much faster than the 2% loss of the 1986-2015 period. The significant darkening of the snowfree surface will speed the loss of this glacier that no longer has a consistent accumulation zone.
Volcan Peteroa Glacier in false color Sentinel image continues to fragment with ~2% retained snowcover in 2022. New lake at Point D. A small fragment of ice is apparent at Point F. and bedrock expansion at Point A. New lake has also formed.
Snowcover free glaciers in the Central Andes in 2014 ad 2023 Landsat images. The ongoing fragmentation and retreat is evident at Point A-H, see closeup details below. The glacier as Point B has melted away, At Point G and H glacier tributaries have separated from the Norte Cipreses Glacier in the valley below. At Point D-F expanding bedrock areas amidst glacier driving further fragmentation. Glaciers at Point A and C rapidly melting away.
Palomo Glacier and North Cipreses are three comparatively large glaciers in the Central Andes of Chile. The three glaciers are adjacent to each other with the Palomo and Coton Glacier feeding the Rio Cortaderal. Rio Cortaderal is part of the Cachapoal River watershed that supplies two Pacific Hydro projects; a 110 MW run of river project at Chacayes and a 78 MW Coya run of river project. Norte Cipreses Glacier feeds the Rio Cipreses. These glaciers are important water resource from December-March Bravo et al (2017) quantified this resource for adjacent Universidad Glacier, which supplied 10-13% of all melt season runoff to the Tinguirica Basin. La Quesne et al (2009) reported that Palomo Glacier retreated 1160 m from 1955-1978 and advanced ~50 m 1987-2007, due tot Palomo Glacier having an equilibrium balance durng the 1987-2000 period. Pelto (2022) reported a retreat of the glacier front of 1250 m from 2002-2022. Here we examine the changes of this glacier from 2014-2023 using Landsat 8 and 9 images along with Sentinel images, that illustrate the impact of essentially snowcover free glaciers during the summer of 2022 and 2023 due largely to a January heat wave in 2022 (Washington Post, 2022) and February heat wave in 2023 (Pelto, 2023).
Point A is a small glacier in a south facing cirque below Alto de los Pejerreyes. From 2014 to 2023 area declined from 0.3 km² to 0.1 km². There is remanent glacier ice, but this is no longer active ice and will soon disappear. At Point B in 2014 the area of remanent glacier ice is 0.1 km², by 2023 it is gone. At Point C the glacier has declined from 0.35 km² to 0.15 km² and retreated 300 m from 2014-2023. At Point D a bedrock area amidst the Maria Angeles Glacier, has expanded from 0.04 km² to 0.20 km², this reflects the lack of flow now reaching the terminus, which retreated 700 m from 2014-2023. At Point E the glacier has retreated 300 m and is separating into three fragments. At Point F the bedrock area amist Palomo Glacier has expanded from 1.1 km² to 1.7 km² between 2016 and 2023. This again reflects diminineshed flow to the terminus which has retreated 800 m during this period, ~100 m/year. At Point G two glacier tongues connected to the Norte Cipreses Glacier in the valley below in 2014. By 2018 they had nealy separated and by 2023 they had completely separated from the glacier below, retreating 200-300 m to the top of this bedrock step. At Point H, the glacier disconnected from Norte Cipreses Glacier in the valley below after 2002 and retreated 300 m from 2014-2023. There is also a new expanding bedrock area high on the glacier, Point I below. The story is not unique with Sollipulli Glacier to the south and Rio Atuel glaciers in the next watershed to the east also having lost their snowcover in 2022 and 2023.
Retreat of Palomo Glacier from 2016 (red arrow) to 2023 (yellow arrow), 800 m. Separation of tributaries at G, yellow arrows that had fed Norte Cipreses Glacier. False color Sentinel images.
Glacier loss at Point B, Glacier retreat at Point C, yellow arrows marks 2016 location. Bedrock expansion at Point D, E and I. retreat from green arrow to yellow arrow of the Maria Angeles Glacier terminating near Point D. Glacier retreat at Point H, yellow arrows marks 2016 location. False color Sentinel images.
Bare glacier ice exposed with months left in the melt season enhances melt. Down slope ice bands and surface roughness on Sholes Glacier.
Heat waves and glaciers don’t usually go together; however, in the last several years an increasing number of heat waves have affected alpine glacier regions around the world. This is true from Arctic Canada to the Himalayas from the Andes to Alaska. Here we review a number of these heat waves from 2018-2022, that I have been involved with assessing and observing. In particular heat waves leave a greater portion of the glacier snow free, which enhances melting and mass balance losses. This is most pronounced when the heat wave occurs prior to or early in the melt season exposing bare glacier ice for the bulk of the melt season. This occurred in summer 2021 in the Pacific Northwest, in summer 2022 in the Central Andes of Chile and Peru, and during the pre-monsoon season in 2022 in the Himalaya. In the summer of 2022 heat waves impacted the glaciers of Svalbard and Europe. In the summer of 2023 the Central Andean glaciers have again been stripped of snowcover.
Lowell Glacier in Landsat images from 7/4, 7/26 and 8/11 with Sentinel images from 7/22 . The snowline is shown with purple dots. Point A-F are fixed reference locations. The snowline migrated upglacier 20 km and 300 m in elevation. A significant snow swamp is between the yellow and purple dots on 7/26, that was not present on 7/22.
The beginning of this “wave” of observations of heat wave impacts on glaciers, was on Lowell Glacier, Yukon where a large snow swamp formed in a matter of days during a Yukon/Northwest Territories Heat Wave. On July 26, the slush covered an area of more than 40 square kilometers, with the rapid development of such a large melt area on Lowell Glacier coinciding with four days where daily temperatures at nearby Haines Junction (~60 km northeast of the glacier) reached 29 degrees Celsius. The only way to generate an extensive snow swamp is to have the snow saturated with water all the way to the surface NASA’s Earth Observatory (NASA EO).
Taku Glacier transient snowline (purple dots) in Landsat images from 7/21 and 9/16/2018.
This same heat event led to the observation that the snow lines on Taku Glacier in Alaska were the highest they had been since tracking began in 1946, 200 m higher than previously observed, with the snow line rising +10 m/day during the heat wave (Pelto, 2019).
Fork Beard (F) and Nerutusoq Glacier (N) Baffin Island on June 1, 2019, June 18, 2019 Sentinel images and June 30 Landsat image. Purple dots indicate the snowline.
During June 2019 on Baffin island Pangnirtung featured four days with record temperatures for that date June 5 (15.1), June 11 (13.5) and June 12 (13.6), and June 19 (14.4). There were 14 days with a maximum temperature above 10 C. On Fork Beard Glacier and Nerutusoq Glacier this drove a snowline rise from 800 m on June 1 to 1100 m by June 18 and 1150 m on June 30. A rate of over 10 m/day for the month.
Eagle Island Ice Cap, Antarctica in Landsat images from Feb. 4, 2020 and Feb. 13, 2020. Point E indicates an are area of snow/firn that is saturated with
An all-time temperature record for Antarctica in February 2020, a high-pressure ridge and a blocking high in the Drake Passage caused anticyclonic circulation bringing warm moist air from the Pacific Ocean to the Antarctic Peninsula Xu et al (2021). This led to vertical air flows in a foehn warming event dominated by sensible heat and radiation made generating abrupt warming Xu et al (2021). The visible impact of this heat event were the rapid rapid formation of melt ponds on Eagle Island Ice Cap I reported to NASA EO. On Eagle Island Ice Cap melt averaged 22 mm/day from Feb. 6-11 based on MAR climate model output forced by the Global Forecast System (GFS) generated by Xavier Fettweis. Rapid melting generating significant snowline rise on Coley Galcier, James Ross Island as well (Pelto, 2020).
Nanpa La (NPL) and Nup La (NL) in October 13, 2020 and January 17, 2021 Landsat imagery indicating the snow line rise that has persisted into mid- winter. Snow line indicated by yellow dots.
When record warmth spread over the Mount Everest region in January 2021, the snow lines near Mount Everest rose durng the October-December 2020 period, and remained at nearly 6,000 meters, including the key glacier passes from Nepal into China being snow free into late January. The National Geographic Perpetual Planet Expedition weather team, led by L. Baker Perry and Tom Matthew, had installed weathers stations at high elevations on Mount Everest in 2019 (Matthews et al 2020). These stations provided field observation of how warm it was during this period, which explained the snow free glaciers in winter. Temperature observations and reconstructions of daily weather conditions, dating back to 1950, indicated that the region had experienced the five warmest winter days since 1950 during a short period in January 2021. Prajjwal Panday examined the decline of snow cover area and rise of sthe snowline on glaciers from Oct. 2020 -January 2021 finding a 15% depleation and 200 m rise respectively. Even in the highest mountain range in the world, we are seeing melt conditions during the winter. This study was first published by NASA EO within a month of the event, and then in the journal Remote Sensing.
Easton Glacier has limited snowpack with two months left in the melt season in 2021. Dots indicate the firn line.
The next warm weather event was the Pacific Northwest record heat in late June 2021, setting all-time records across the region. Thompson et al (2022). comparison of daily summer maximum temperaturesthat were 3.6 SDs from the mean.. This heat wave quickly melted away much of the winter snowpack on many glaciers. The heat wave and ensuing warmth stripped the snowcover from glaciers right to the summit on the highest mountains from Mount Shasta, California to Mount Baker, Washington by mid- August exposing the dirtier ice that lies underneath the snow and melts more rapidly than snow under the same weather conditions, to the summit of these mountains. The led to increased discharge in glacier fed streams, while non-glacier fed streams in the region had significant declines in discharge. For the Nooksack River heat waves generate a 24% increase in discharge in the glaciated North Fork and a 20% decline in the unglaciated South Fork (Pelto et al 2022). For water temperature the mean increase was 0.7 °C (±0.4 °C) in the North Fork and 2.1 °C (±1.2 °C) in the South Fork (Pelto et al 2022). The resulting volume loss during the summer season has been the highest we have observed in our 38 years of monitoring North Cascade glaciers. We observed stunted alpine plant growth, experienced days of smoky air limiting visibility and had to navigate and measure more open crevasses than usual.
Whitney Glacier on Mount Shasta in 2021 Sentinel Images.
Jackson and Blackfoot Glacier in early September Sentinel 2 false color images. Point A indicates exposed ice showing annual layers. Point B indicates exposed firn that had been retained through previous summers. The gray color of the firn indicates how dirty it is and that its albedo would enhance melting.
Mount Shasta in California fared even worse, losing all snow cover on its glaciers by September 6. The largest glacier on the mountain and in California, Whitney Glacier, began to separate. In all, the glaciers there had lost 50 percent of their area and volume this century, including ~10-15 percent this summer, and had fragmented from 6 into 17 glacier pieces (Patel, Washington Post, 2021).
The summer of 2022 in the Central Andes of Argentina and Chile glaciers experience a near total loss of snowpack in January due to early summer warmth, leading to dirty/dark glaciers. The darker surfaces of the glacier melt faster leading to more rapid area and volume loss. This includes fragmentation and rapid expansion of bedrock areas amidst the glacier. The snow free conditions lasted until the end of March, extending the impact from the January observations emphasizing that this was a regional issue this summer with snowpack lost from Bajo del Plomo Glacier, Cortaderal Glacier, Palomo Glacier,Volcan Overo Glaciers,Volcan San Jose Glaciers , Cobre Glacier and Olivares Beta and Gamma Glaciers across the Central Andes of Chile and Argentina.
Volcan San Jose glaciers in Feb. 17, 2022 Sentinel image. This highlights just how dirty the ice surface is and how limited the retained snowcover is.
Cobre Glacier, Argentina in false color Sentinel 2 images from Jnauary 13, 2022 and March 16, 2022. Note the expansion of bedrock area amidst the glacier at Point A, glacier fragmenting at Point B and Point C.
Volcan Overo in Sentinel image continues to fragment with no retained snowcover this summer, and bedrock expansion at Point A.
Sentinel images the loss of all snowcover on Sollipulli Glacier that continued from January until at least March 13 2022. Note the annual layers preserved in the glacier ice now exposed at the surface.
Langjokulen (La), Kvitisen (Kv), Bergfonna (Be) and Blaisen (Bl) ice caps on Edgeøya in Sentinel image from 8-20-2022 illustrating the lack of snowcover, limited firn areas and numerous annual layers. This pattern of annual layers due to glaciers being stripped of snow cover is becoming increasingly frequent. Note Andes last winter and Pacific Northwest summer 2021.
During the summer of 2022 Svalbard experienced an extended heat wave in August that led to loss of snowpack on a number of ice caps on Edgeoya.
Rapid snowcover loss on Rhone Glacier early in summer of 2022 in Sentinel images
The European Alps were hard hit in the summer of 2022 experiencing their most negative balances observed during the 70 years of observations.
In the summer of 2023 central Andean glaciers lost snowcover during the February heat waves.
Volcan Overo, Argentina with expanding lakes, blue arrows and fragmenting at yellow arrows.
Sollipulli Glacier lost snowcover in February 2023
The bottom line is that glaciers are simply not compatible with recurring heat waves and the intensity and frequency of these is increasing. This is true from Arctic Canada to the Himalayas from the Andes to Antarctica. This year, for the 34th consecutive year, Alpine glacier volume in the world will decline; their business model is not sustainable with our climate.
Landsat images of Tulsequah Glacier on June 22 and July 5, 2021. Lake No Lake is between the yellow arrows with the margin of glacier extending upvally on June 22nd. By July it has receded back to main valley and lake has largely drained. The former location of Tulsequah glacier dammed lake is at red arrow.
Tulsequah Glacier, British Columbia drains east from the Juneau Icefield and is best known for its Jökulhlaups or glacier lake outburst floods (GLOF) from Tulsequah Lake and Lake No Lake dammed by Tulsequah Glacier in northwestern British Columbia, Canada (Neal, 2007). The floods pose a hazard to the Tulsequah Chief mining further downstream. This glacier feeds the Taku River which has seen a significant decline in salmon in the last decade (Juneau Empire, 2017).The continued retreat of the main glacier at a faster rate than its subsidiary glaciers raises the potential for an additional glacier dammed lakes to form. The main terminus has disintegrated in a proglacial lake. Pelto (2017) noted that by 2017 the terminus has retreated 2900 m since 1984, with a new 3 km long proglacial occupying the former glacier terminus. The USGS has a stream gage measuring a range of parameters including turbidity and discharge which can identify a GLOF. Neal (2007) examined the 1988-2004 period identifying 41 outburst floods from 1987-2004. Here we examine Landsat images and USGS records of Taku River to quantify the 2021 GLOF event between June 25 and July 3.
USGS records of turbidity and discharge on Taku River that indicate the onset on glacial lake drainage and of the GLOF event on July 3, note purple arrows.
On June 22, 2021 the region between the yellow arrows is an iceberg choked lake. The red arrow indicates the location where Tulsequah Lake used to expand, it is limited. The terminus of the glacier reaching upvalley 600 m from the main glacier. Discharge is at 60,000 cfs and the turbidity is at ~100 FNU. Starting on the June 25th through the 27th turbidity rises to 400 FNU, while discharge rises to 90,000 cfs. This is during a protracted dry period and is the result of the beginning of increased glacier discharge from the lake. On July 27th-June 30th it is evident that the margin of the distributary glacier tongue has receded ~500 m back to the main glacier margin, representing a terminus collapse generating icebergs likely resulting from a fall in water level. There is no change in the small Tulsequah Lake at the red arrow. On July 3rd turbidity rises above 500 FNU and discharge exceeds 130,000 cfs, this is at the high end of the typical peak GLOF events from Lake No Lake as noted by Neal (2007) from 90,000-130,000 cfs. This is the main event and was reported by the USGS. By July 5 Landsat imagery indicates the water level has dropped between the yellow arrows, resulting in more prominent icebergs. The Sentinel image illustrates the zone of iceberg stranding as well. The icebergs continue to melt away by July 20. No change at the red arrow. If we look back to Sept. 2020 we see what Lake No Lake will appear like by the end of summer and that the distributary terminus margin does not extend upvalley at that time. The large proglacial lake that has formed after 1984 due to retreat helps spread out the discharge from ice dammed lake GLOF’s of Tulsequah Glacier. This lake will continue to expand and the damming ability of the glacier will continue to decline, which will eventually lead to less of a GLOF threat from Lake No Lake.
Sentinel images from June 22, July 5 and July 20 of the area of the lake and then the area of stranded icebergs. Note how almost the entire width of a the northern tributary flows into this valley.
Landsat images of Tulsequah Glacier on June 27 and June 30. Lake No Lake is between the yellow arrows. The former location of Tulsequah glacier dammed lake is at red arrow. Tulsequah Glacier in 1984 and 2017 Landsat images. The 1984 terminus location is noted with red arrows for the main and northern distributary tongue, southern distributary red arrow indicates lake margin. The yellow arrows indicate the 2017 glacier terminus locations. The retreat of 2900 m since 1984 led to a lake of the same size forming. Purple dots indicate the snowline.
Landsat images of Tulsequah Glacier on Sept. 15, 2020. Lake No Lake now drained fills between the yellow arrows. The former location of Tulsequah glacier dammed lake is at red arrow.
Guest Post by Ben Pelto, PhD Candidate, UNBC Geography, pelto@unbc.ca
As the summer ticks by and the fall glacier field season approaches, I’ve realized that I never put out a winter 2016-2017 synopsis, so, like the snowfall this year, it’s arrived late.
May 2017, Jesse Milner of the ACMG on the Nordic Glacier in front of the “meteor strike” a newly exposed rock face that spalls ice regularly. Photo by Ben Pelto.
Story of the winter
The winter began with an extremely warm November, featuring temperatures 2-5˚C above normal, with greater than average precipitation generally delivered via Pacific storm cycles. Arctic air masses moving south across BC dominated December, with a complete reversal of temperature to well below average temperatures (Figure 1), and drier conditions. By January 1st the BC River Forecast Center announced that the Columbia River Basin was at 80-88% of normal snowpack (Figure 2).
Figure 1. Maximum temperature anomaly for December 2016. Note Columbia Basin (SE BC) roughly 3˚C below normal (Pacific Climate Impacts Consortium).
Figure 2. January 1st snow survey data from the BC River Forecast Center. The Columbia River Basin is comprised of the Upper Columbia, East Kootenay, and West Kootenay Basins, which range from 80-88% of normal.
March and April brought cool and moist unstable conditions, leading to a significant increase in snowpack across southern BC, delaying the onset of the melt season by about two weeks. Snowpack measures for the basin were over 100% of normal for the first time of the winter; by May 1st, the Columbia Basin was at 115% of normal to the north and 135% in the south (Figure 3). By the first week of May, most regions had transitioned into the melt season, though at low to mid-elevations (below 1500 m) much of the snow had already melted.
Figure 3. May 1st snow survey data from the BC River Forecast Center. The Columbia River Basin is comprised of the Upper Columbia, East Kootenay, and West Kootenay Basins, which ranged from 115 to 137% of normal.
Questions of alpine snowpack conditions
A trend seen over the past few winters is minimal to no snow at lower elevations with significant snow remaining higher, and it’s a pattern expected to continue in an era of rising temperatures leading to both rain on snow, and melt events through the winter. Unfortunately, current measurements, including the network of 70 automatic snow weather stations (ASWS) across the province, are all located at or below 2000 m. This leaves the alpine largely un-sampled. Rising temperatures may well be increasing the balance gradient of winter snow accumulation; that is, there will be a greater rate of change (increase) in snowpack with elevation than previously experienced, though data for this shift is lacking.
Our glacier research program
This information gap of alpine snowpack across BC is being addressed within the context of our glacier mass balance network funded by the Columbia Basin Trust. Each year we have been studying a series of five glaciers across the Basin, which from north to south are the Zillmer Glacier (Valemount), Nordic Glacier (northern boundary of Glacier National Park), Illecillewaet Glacier (Parks Canada, Rodgers Pass, Glacier National Park), Conrad Glacier (Golden, northern boundary of Bugaboo Provincial Park), and the Kokanee Glacier (Nelson, Kokanee Glacier Provincial Park). For more background see previous posts here and here.
Our spring field season consists primarily of snow depth measurements and snow density measurements, used to determine the snow water equivalent (SWE) retained on each glacier at the winter’s end. We also conduct GPS surveys of the glacier height, which we use to account for any surface height change between field visits, and the subsequent airborne laser altimetry surveys (LiDAR)of each glacier and the surrounding area that we’re conducting every spring and fall for the five years of the project.
May 2017, Pulling the ground penetrating radar up the Kokanee Glacier to measure ice thickness. The Kokanee is 20-80 m thick, averaging around 30-40 m. Photo by Rachael Roussin.
Our LiDAR data allows us to calculate snow depth by comparing a fall LiDAR-derived digital elevation model (DEM) to our spring DEM. Off-glacier, the fall DEM represents bare earth, and on glacier, the glacier surface at the end of the melt season. The spring DEM thus captures the fall surface height plus the winter snowpack. The difference in height between the two is taken to be accumulated snow. While our manual snow depth and density surveys of the five study glaciers are incredibly valuable data, our LiDAR surveys cover roughly 10% of the Columbia Basin glacier area, a more than three-fold increase. This expanded footprint allows a better picture of alpine snowpack across the province at elevations largely un-sampled; highly important to downstream concerns such as spring flooding and snow available for summer streamflow.
Fires and Floods
Dramatic swings of weather patterns characterized the 2016-2017 winter, with snowpack well below average in February and early March for the province. By the end of April, snowpack across the Columbia Basin and southern half of the province had rebounded to average or record levels depending upon location with Vancouver and the lower mainland receiving significant snowfall to much fanfare.
The late and cool spring saved the snow season, but also led to flooding across the province, particularly throughout the Okanogan and around Kelowna. As the wildfire season began in earnest, sandbags were still in place in Kelowna to protect properties against flooding from Okanogan Lake, which remained above full pool by 38 cms on July 10th. Wildfire crews had been tasked with fighting the flooding, and were removing many sandbags as lake levels began to fall before heading off to respond to escalating fires. The flooding began following a rapid warm-up combined with heavy rainfall that led to extreme avalanche risk and activity, with highway closures along the Trans-Canada and Icefields Parkway.
The record snowpack across the southern-most Columbia Basin such as around Nelson, BC, has long since disappeared, with Nelson implementing water restrictions to attempt to cut water usage by 50% in response to the rapidly diminishing snowpack which feed the town’s water supplies.
Forest fires have been raging over the province, burning an area larger than Prince Edward Island, in what is the worst fire season in BC since 1958. Forest fire impact on glaciers is largely unknown, as soot and ash from the fires may raise albedo, but smoke clouds reflect incoming solar radiation. One thing is for certain however, should the fires cloud the skies during our field season, spending 24 hours a day in fire smoke makes for a tough go.
Team members at the foot of a recent avalanche preparing to head up to the Nordic Glacier in the first week of May 2017. Photo by Alex Bevington
Outlook
With our fall field season (August 19-September 21) only a week away, it will be an interesting time to observe how our study glaciers across the Columbia Mountains fared over this roller coaster of a year. After a cold, dry start to the winter, a late rally in March and April delayed the start of the melt season and raised snowpack to well above average across the Columbia Basin. A hot, dry summer led to flooding in May, and now wildfires in June-August, which reversed snowpack levels to below-average at most elevations. Satellite images of the study glaciers show rapidly rising snow lines, as above-average snow packs are reduced to average to below-average across most glaciers, with only the Kokanee Glacier appearing set for a possible positive mass balance year.
How do you get out? Jesse Milner at the bottom of a 5.5 m deep snow pit, which we use for sampling snow density. Nordic Glacier. Photo by Alex Bevington.
Pedersen Glacier Kenia Peninsula, Alaska retreat from Landsat images in 1994 and 2016. The red arrow indicates 1994 terminus, yellow arrow is 2016 terminus, orange arrow indicates northern tributary and purple dots indicates snowline.
Pedersen Glacier is an outlet glacier of the Harding Icefield in Kenai Fjords National Park near Seward, Alaska. The glacier drops quickly from the plateau of the icefield through a pair of icefalls terminating in a lake at 25 meters above sea level. The Harding Icefield glaciers that drain east are in the Kenai Fjords National Park, which has a monitoring program. Giffen et al (2014) observed that from 1950-2005 all 27 glaciers in the Kenai Icefield region examined retreated. Giffen et al (2014) observed that Pedersen Glacier retreated slow but steady from 1951-1986 at 706 m (20 m/a) and 434 m (23 m/year) from 1986-2005. Here we compare a 1994, 2013, 2015 and 2016 Landsat imagery illustrating a rapid increase in retreat rate from the previous periods.
In 1994 the terminus proglacial lake at the terminus is small and much of the terminus is on land. The snowline in 1994 is at 550 m. The tributary entering from the north, orange arrow, is 400 m wide as it reaches Pedersen Glacier. In 2005 the Google Earth image below indicates extensive terminus crevassing, indicating substantial terminus velocity, and that the retreat is driven by calving. In 2005 the lake is now 1.1 km long on its center axis. By 2015 the glacier has retreated 2600 m since 1994, a rate of 125 m/year, much faster than before. The snowline is average 800 m. The northern tributary is now barely reaching the main glacier and has a width of 150 m. Note there was a medial moraine separating the tributary from the main glacier in 1994 and now this is merely a lateral moraine. This tributary is not particularly impacted by calving losses and indicates a rising snowline is also a source of mass loss for the glacier. A comparison of the 2013, 2015 and 2016 terminus indicates the recession has remained rapid. The glacier is approaching the base of an icefall that would represent the inland limit of the lake and the end of rapid retreat. The snowline in 2013 averages 850 m and is at 800 m on Sept. 30 2016. The glacier follows the pattern of nearby Bear Glacier, Yakutat Glacier, Harris Glacier and the inital phase of retreat on Brady Glacier.
Pedersen Glacier Kenia Peninsula, Alaska retreat from Landsat images in 2013 and 2015. The red arrow indicates 1994 terminus, yellow arrow is 2015 terminus, green arrow indicates 2016 terminus and purple dots indicates snowline.
Pedersen Glacier in 2005, note crevassing at the terminus, pink arrow. The northern tributary is indicated by orange arrow and green arrow indicates 2016 terminus position.
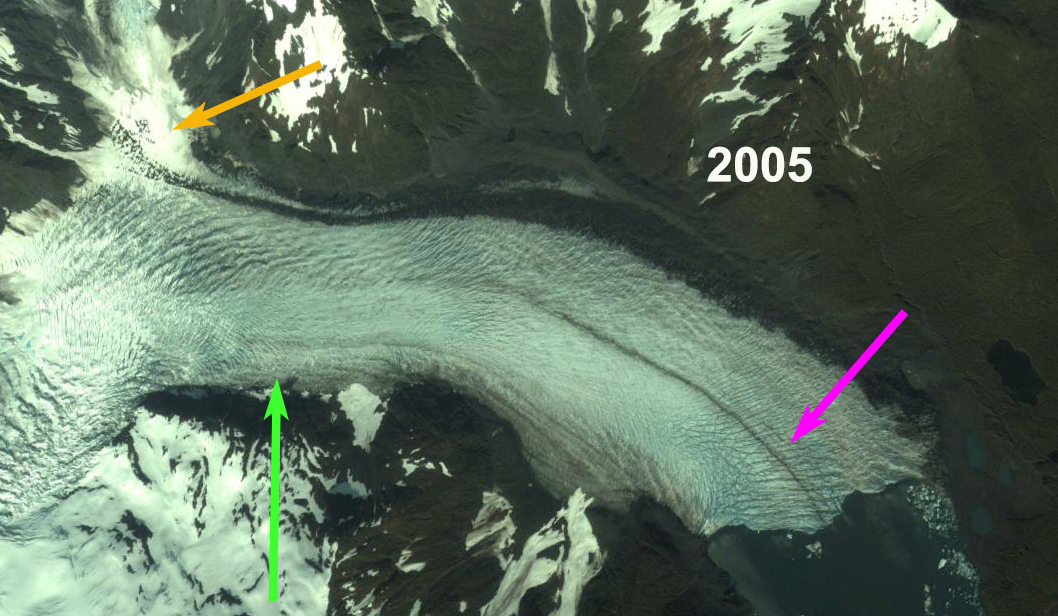
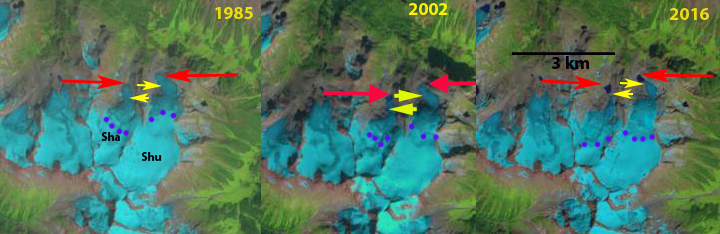
Red arrow is the 1985 terminus location and yellow arrow the 2016 terminus location. Note the formatiion of new lakes at end of both glaciers. Purple dots is the transient snowline in August of each year.
Shatter and Shudder Glacier are at the eastern end of the Spearhead Range in Garibaldi Provincial Park, British Columbia. Osborn et al (2007) mapped the Little Ice Age extent of the glaciers compared to the 1990’s margins indicating a retreat of 300 m for Shatter Glacier and 700 m for Shudder Glacier (see below). Koch et al (2009) identified the recession in area from 1928 to 1987 noting a 6% loss in Shatter Glacier and 22% loss for Shudder Glacier. Koch et al (2009) identify an 18% loss in area from 1987-2005, indicating considerable recent change in the Park. Here we use Landsat imagery from 1985-2016 to update glacier change.
In 1985 there are no lake at the terminus of either Shatter or Shudder Glacier. In 2002 a lake has formed at the terminus of Shudder Glacier, but not Shatter Glacier. In 2016 both glaciers have proglacial lakes that have formed, and the terminus of both glaciers have retreated from the lakes. This marks a retreat of 325 m on Shudder Glacier and 275 m on Shatter Glacier since 1985. Shudder Glacier retreated more rapidly in the first half of this period, while Shatter Glacier has experienced most of the retreat since 2005.
On Shatter and Shudder Glacier In 1987 the late August image indicates the snowline is at 2040 m, in mid-August 2015 the snowline is at 2250 m. In late August of 2014 the snowline was at 2120 m. In mid-August 2016 the snowline is at 2080 m. The higher snowlines are an indicator of mass loss for these glaciers that in turn drives retreat. The region continues to experience significant loss in glacier area and development of many new alpine lakes with glacier retreat, five new lakes since 1987 just in this range with seven glaciers. Spearhead and Decker Glacier are two other glaciers in the range that have developed new lakes since 1987. Nearby Helm Glacier is faring even worse.
Landsat images from 1987, 2014 and 2015 indicating the transient snowline position at the purple dots on Shatter and Shudder Glacier.
Pink Arrows indicate five new alpine lakes that have developed since 1987 as Spearhead Range glaciers have retreated
Map of Spearhead Range glacier extent for LIA-Bold lines and 1987, light lines from Osborn et al (2007)
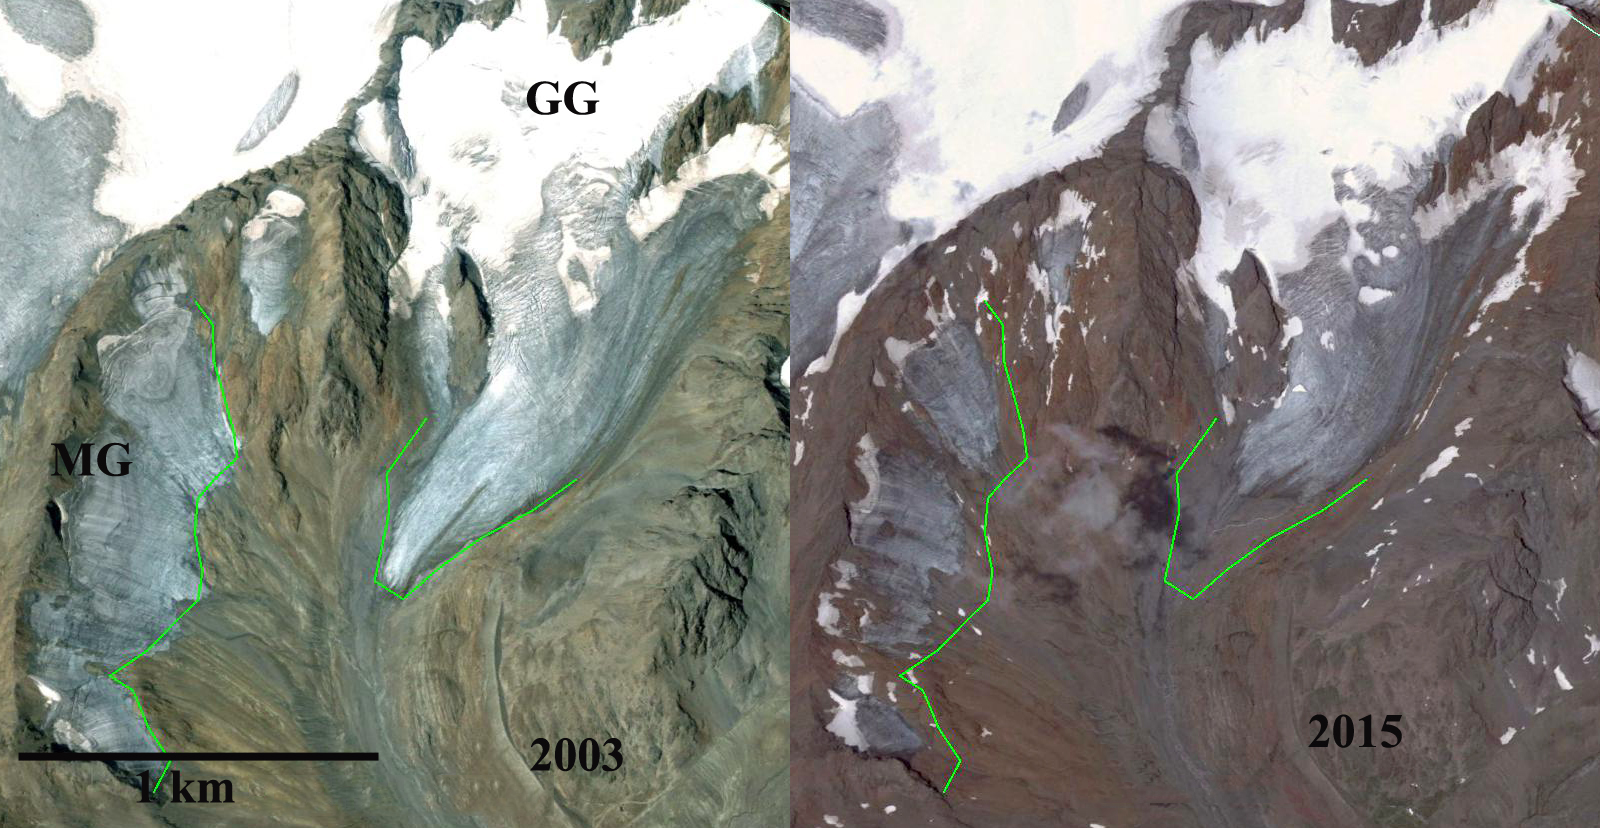
Google Earth images of Mittlerer Guslarferner (MG) and Grosser Guslarferner (GG) from 2003 and 2015. The green line is the 2003 margin.
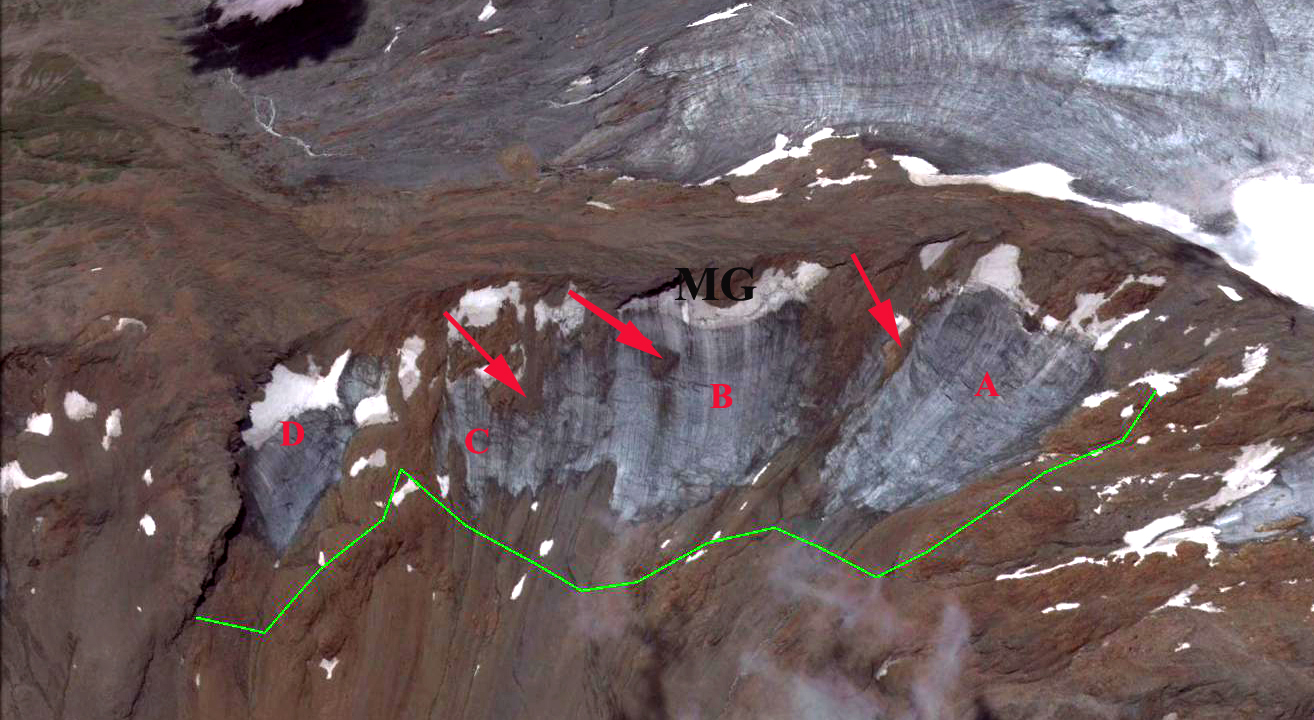
Mittlerer Guslarferner and Grosser Guslarferner are a pair of Austrian glaciers in the Ötztal Alps. A comparison of Google Earth images from 2003 and 2015 indicates that substantial changes that have occurred in just 12 years. In this region between 1997 and 2006 Abermann et al (2009) noted an 8.2% area loss in just a decade for Ötztal Alps glaciers. The Austrian Alpine Club completes an annual terminus survey of glaciers. This survey is one of the world’s most comprehensive, and is currently directd by Andrea Fischer. The report on the 2015 inventory documents another poor year with 96% of the 92 glacier retreating. The average retreat was 26 m, with Hornkees and Gepatschferner leading the way. Abermann et al (2010) Figure 2 illustrate the beginning of the separation of MG in 2010. A comparison of the two glaciers indicates that frontal retreat has been 330 m for Mittlerer Guslarferner and 260 m for Grosser Guslarferner. The frontal changes do not tell the story for Mittlerer Guslarferner. In 2003 the glacier did not have any retained snowcover and very limited firn retained from previous years, this indicates the lack of an accumulation zone, without which a glacier cannot survive (Pelto, 2010). The glacier is continuous across a width of 1300 m and has an average length of 300 m. The glacier has disintegrated into four parts since 2003, with outcrops of rock emerging not just near the terminus, but near the top of the glacier, red arrows. In 2015 with a few weeks left in the melt season only 10% of the glacier has retained firn. Glacier area has declined by 40% in just a decade.
Mittlerer Guslarferner in 2003
Mittlerer Guslarferner in 2015, having separated into four segments with new outcrops near top of glacier.

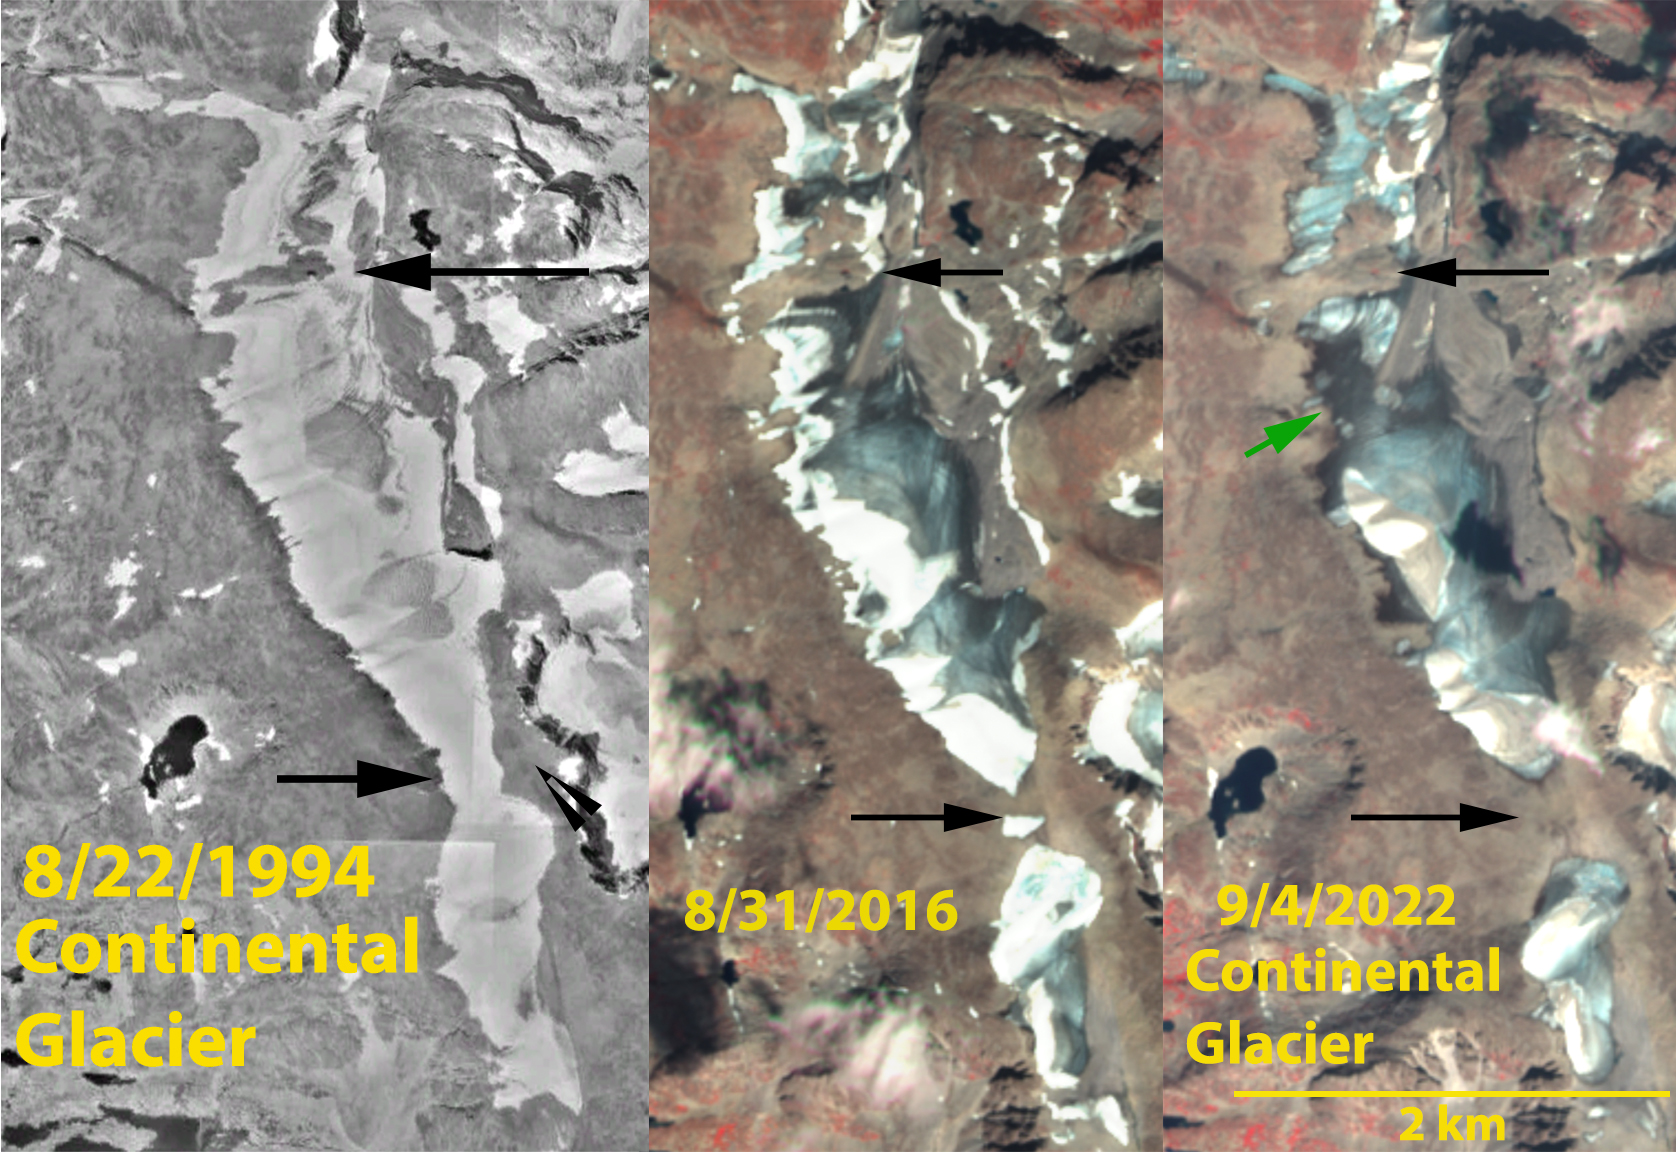


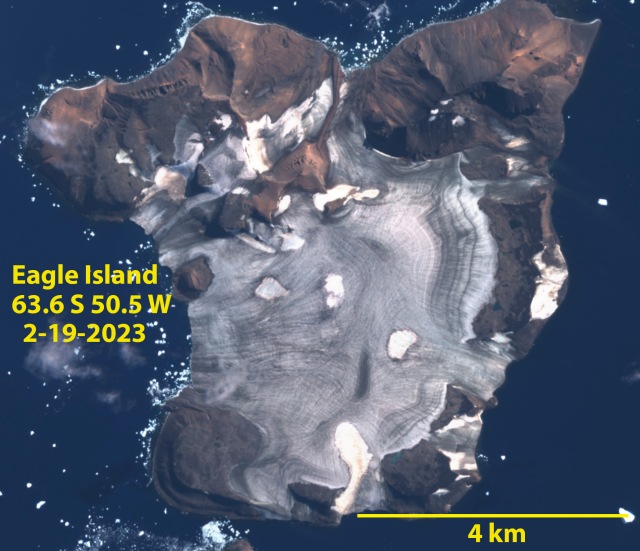
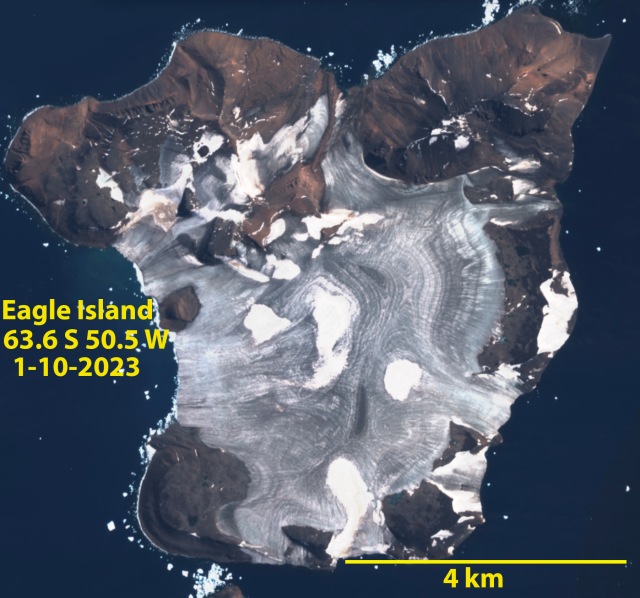


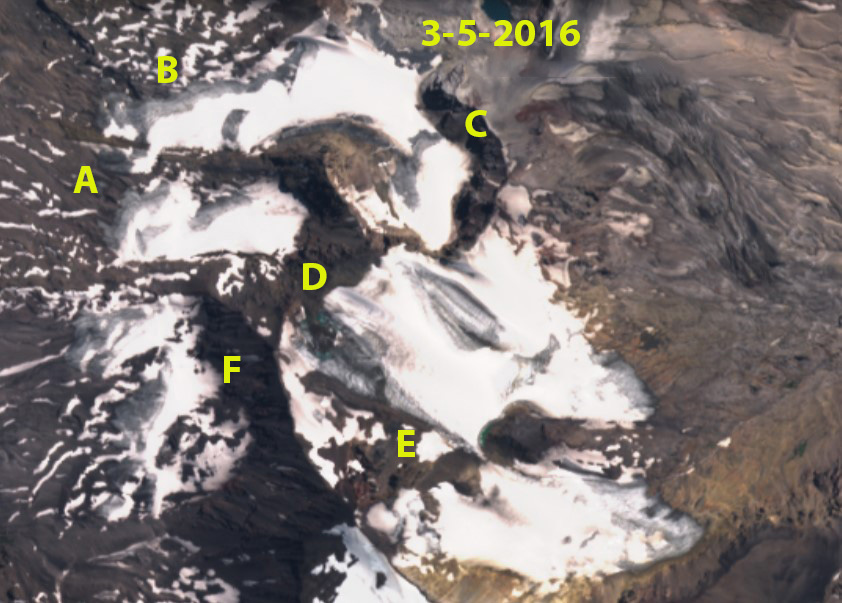


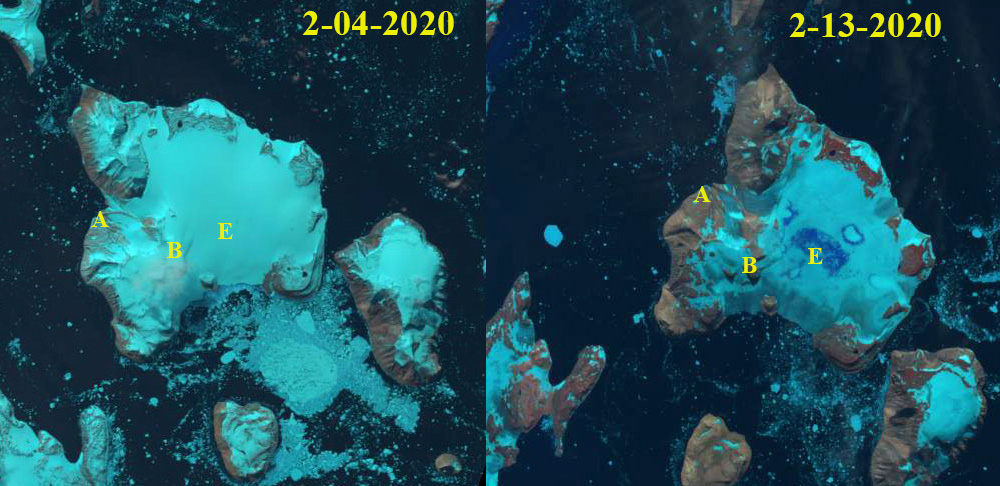


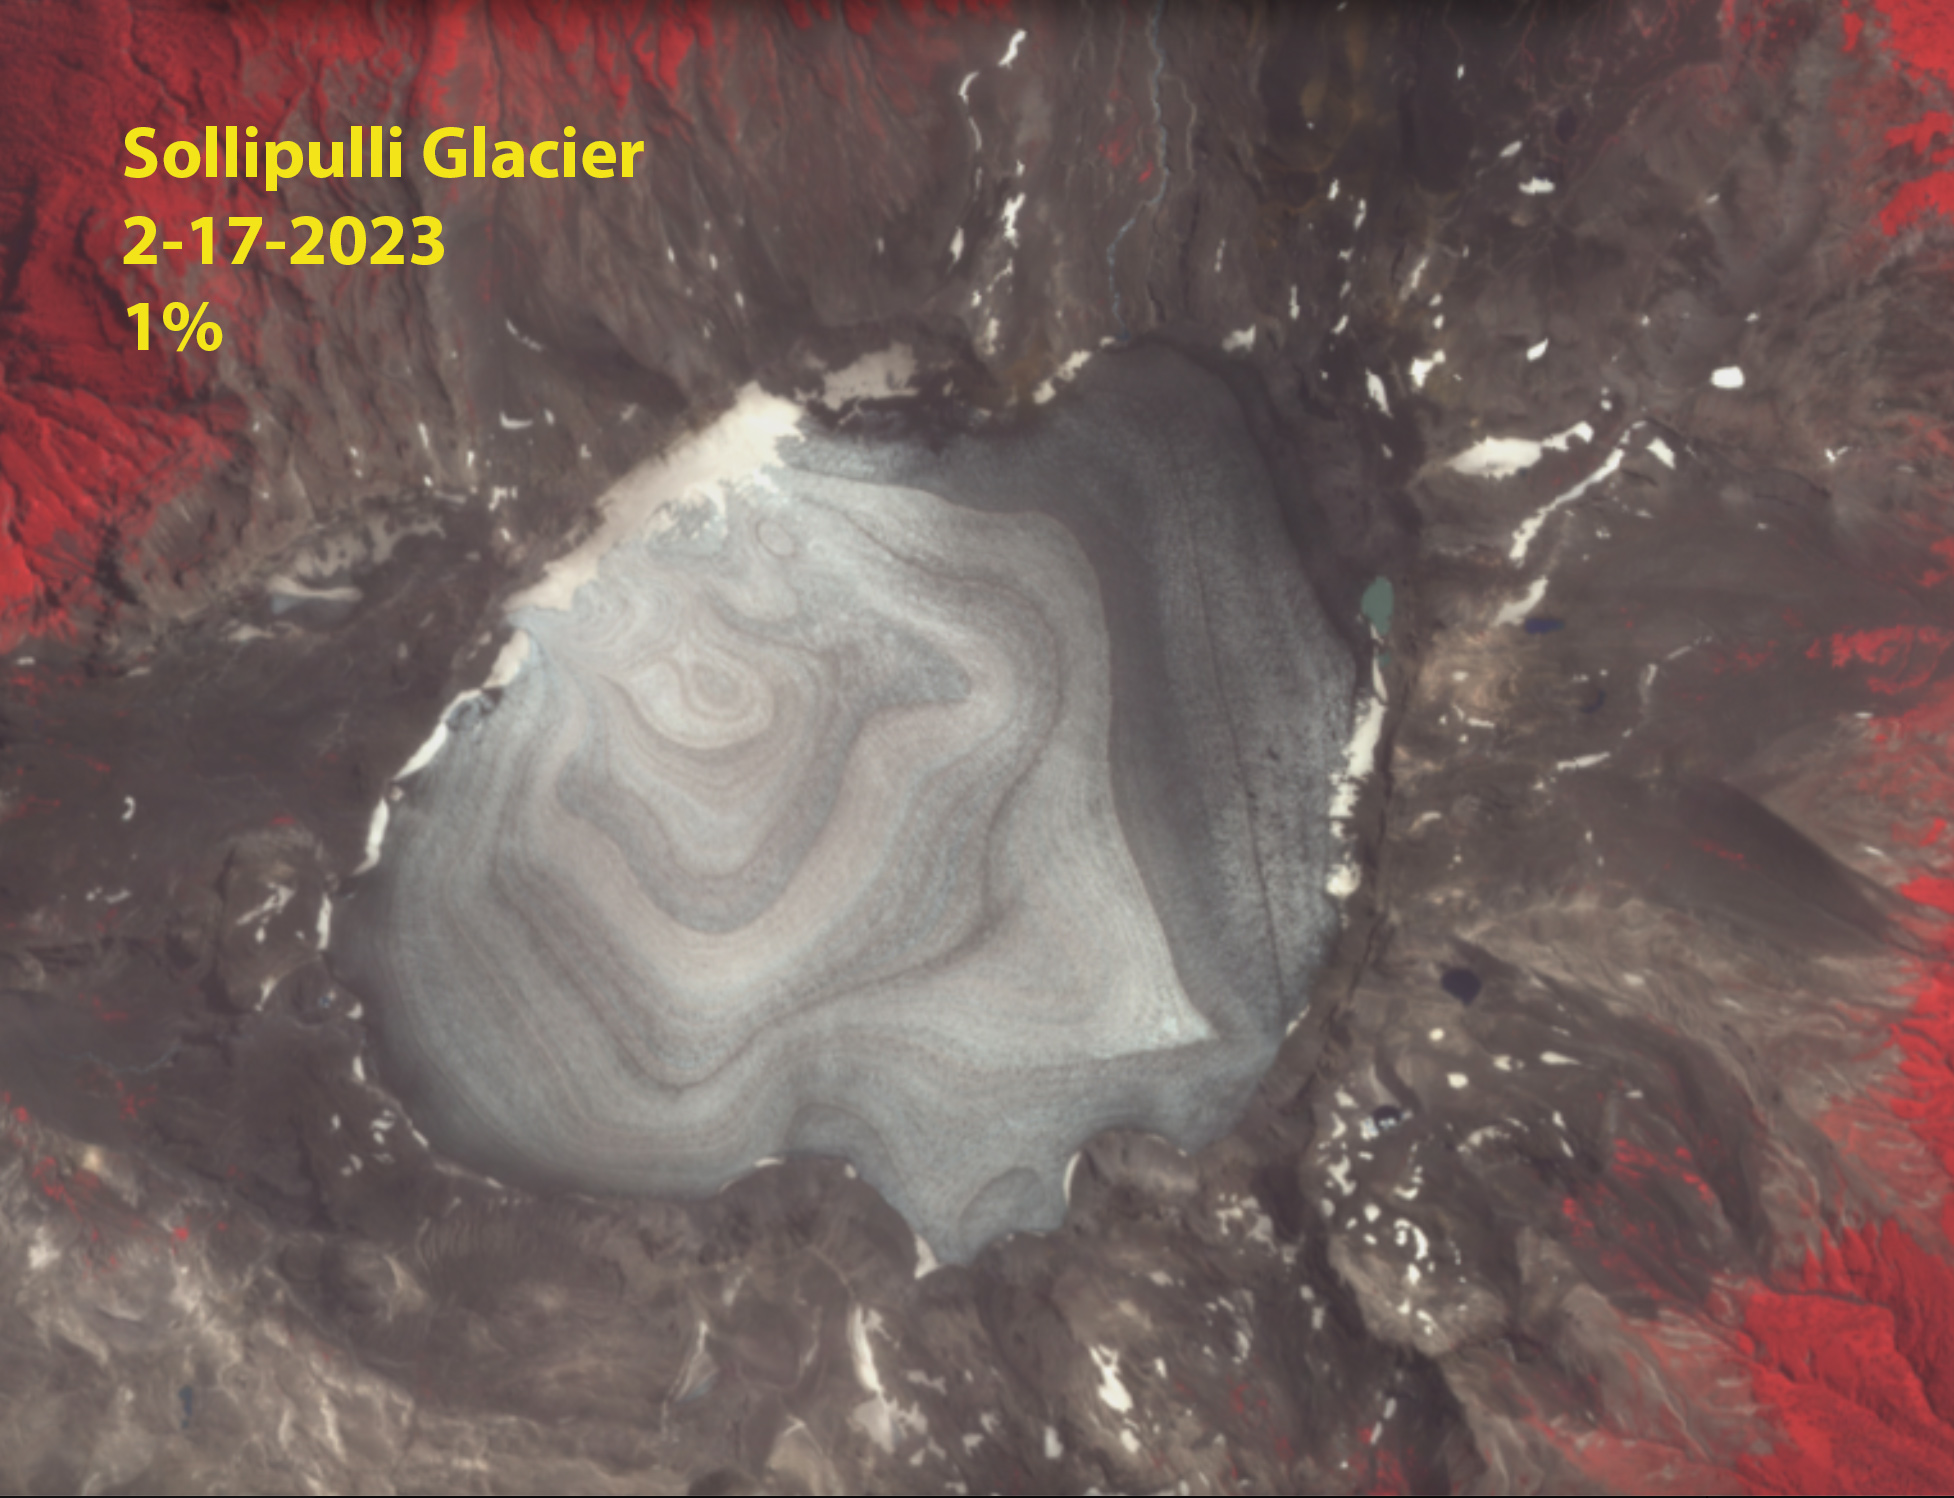


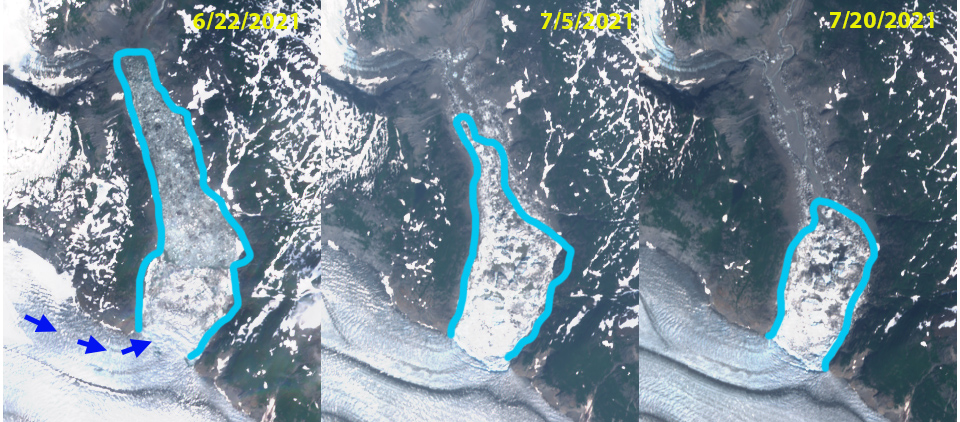


 Figure 2. January 1st snow survey data from the
 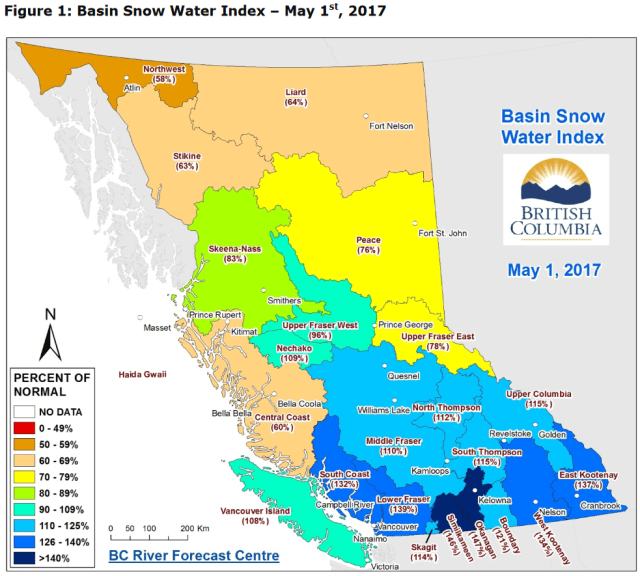 Figure 3. May 1st snow survey data from the