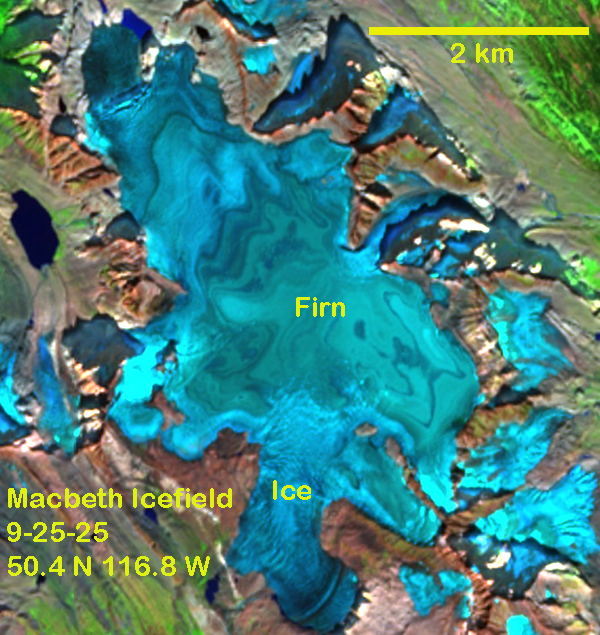
Macbeth Icefield, BC in false color Sentinel image from 9-25-2025. Bare of snow cover reveals annual layers within firn, darkened by dust and forest fire partical deposition.Small glaciers A,B,C and E have vanished.
Macbeth Icefield is the Purcell Mountains of southwestern British Columbia. The several icefield outlet glaciers drain into Duncan Lake the Duncan River and then Kootenay Lake. From 2011-2020 glacier loss accelerated by more tha 250% from the 1984-2010 period in this region (Bevington and Menounos, 2022). The 2021-2024 period was noted as a period of unprecedented ice loss in Western Canada (Menounos et al 2025). The summer of 2025 was even worse. Access to the Macbeth Icefield Recreation Area is currently closed due to extensive forest fire impact to the long hiking trail that accesses the icefield (images below illustrate the burn scars).
I have had the opportunity to review satellite images of this area from 1984-2025. In 2025, for the first time the icefield lost all snow cover exposing many annual layers of firn. The firn is snow that endured at least one summer, and is not yet converted to glacier ice. This firn is signficantly darkened by particles of dust and forest fire derived material. This further enhances melt once exposed.
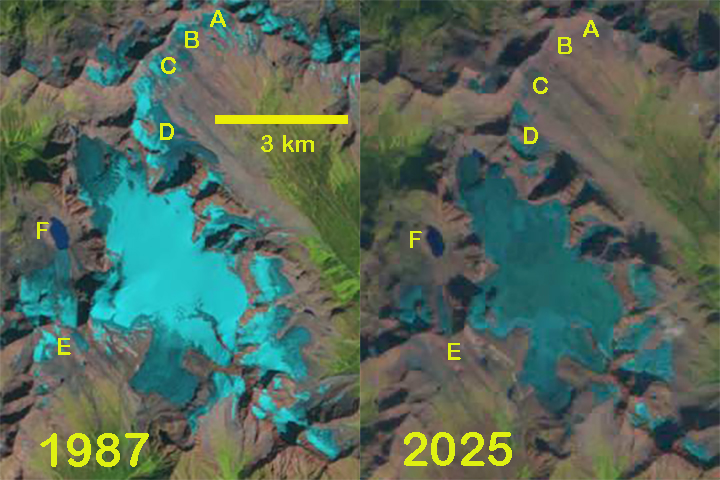
In 2023 and 2024 significant firn areas were exposed as well, in the sequence of images below. . The repeated years of limited snow cover has led to mass balance loss and a 25-30% reduction in icefield area since 1987. From 1987-2025 several small adjacent glaciers have been lost A,B, C and E. t Point D the glacier has fragmented. At Point F the glacier ended in the lake in 1987 and now the glacier has retreated 700 m from the lake.
Macbeth Icefield in 1987 and 2025 Landsat images indicating recession of icefield margin, loss of snowcover and vanished small glaciers A,B,C and E.A 2024 forest fire burned extensive areas in the Birnam Creek valley that drains the southern end of the icefield. The 2023 image illustrated the consistent red of forest, with the brown areas at the yellow arrows indicating burn scars.Macbeth Icefield in Sentinel image from 9-1-2023. Extensive firn area is exposed, while 30% of the icefield has retained snow cover.Macbeth Icefield in Sentinel image from 9-5-2024. Extensive firn area is exposed, while 20% of the icefield has retained snow cover.Macbeth Icefield in Sentinel image from 9-25-2025. The lack of snow cover is evident.
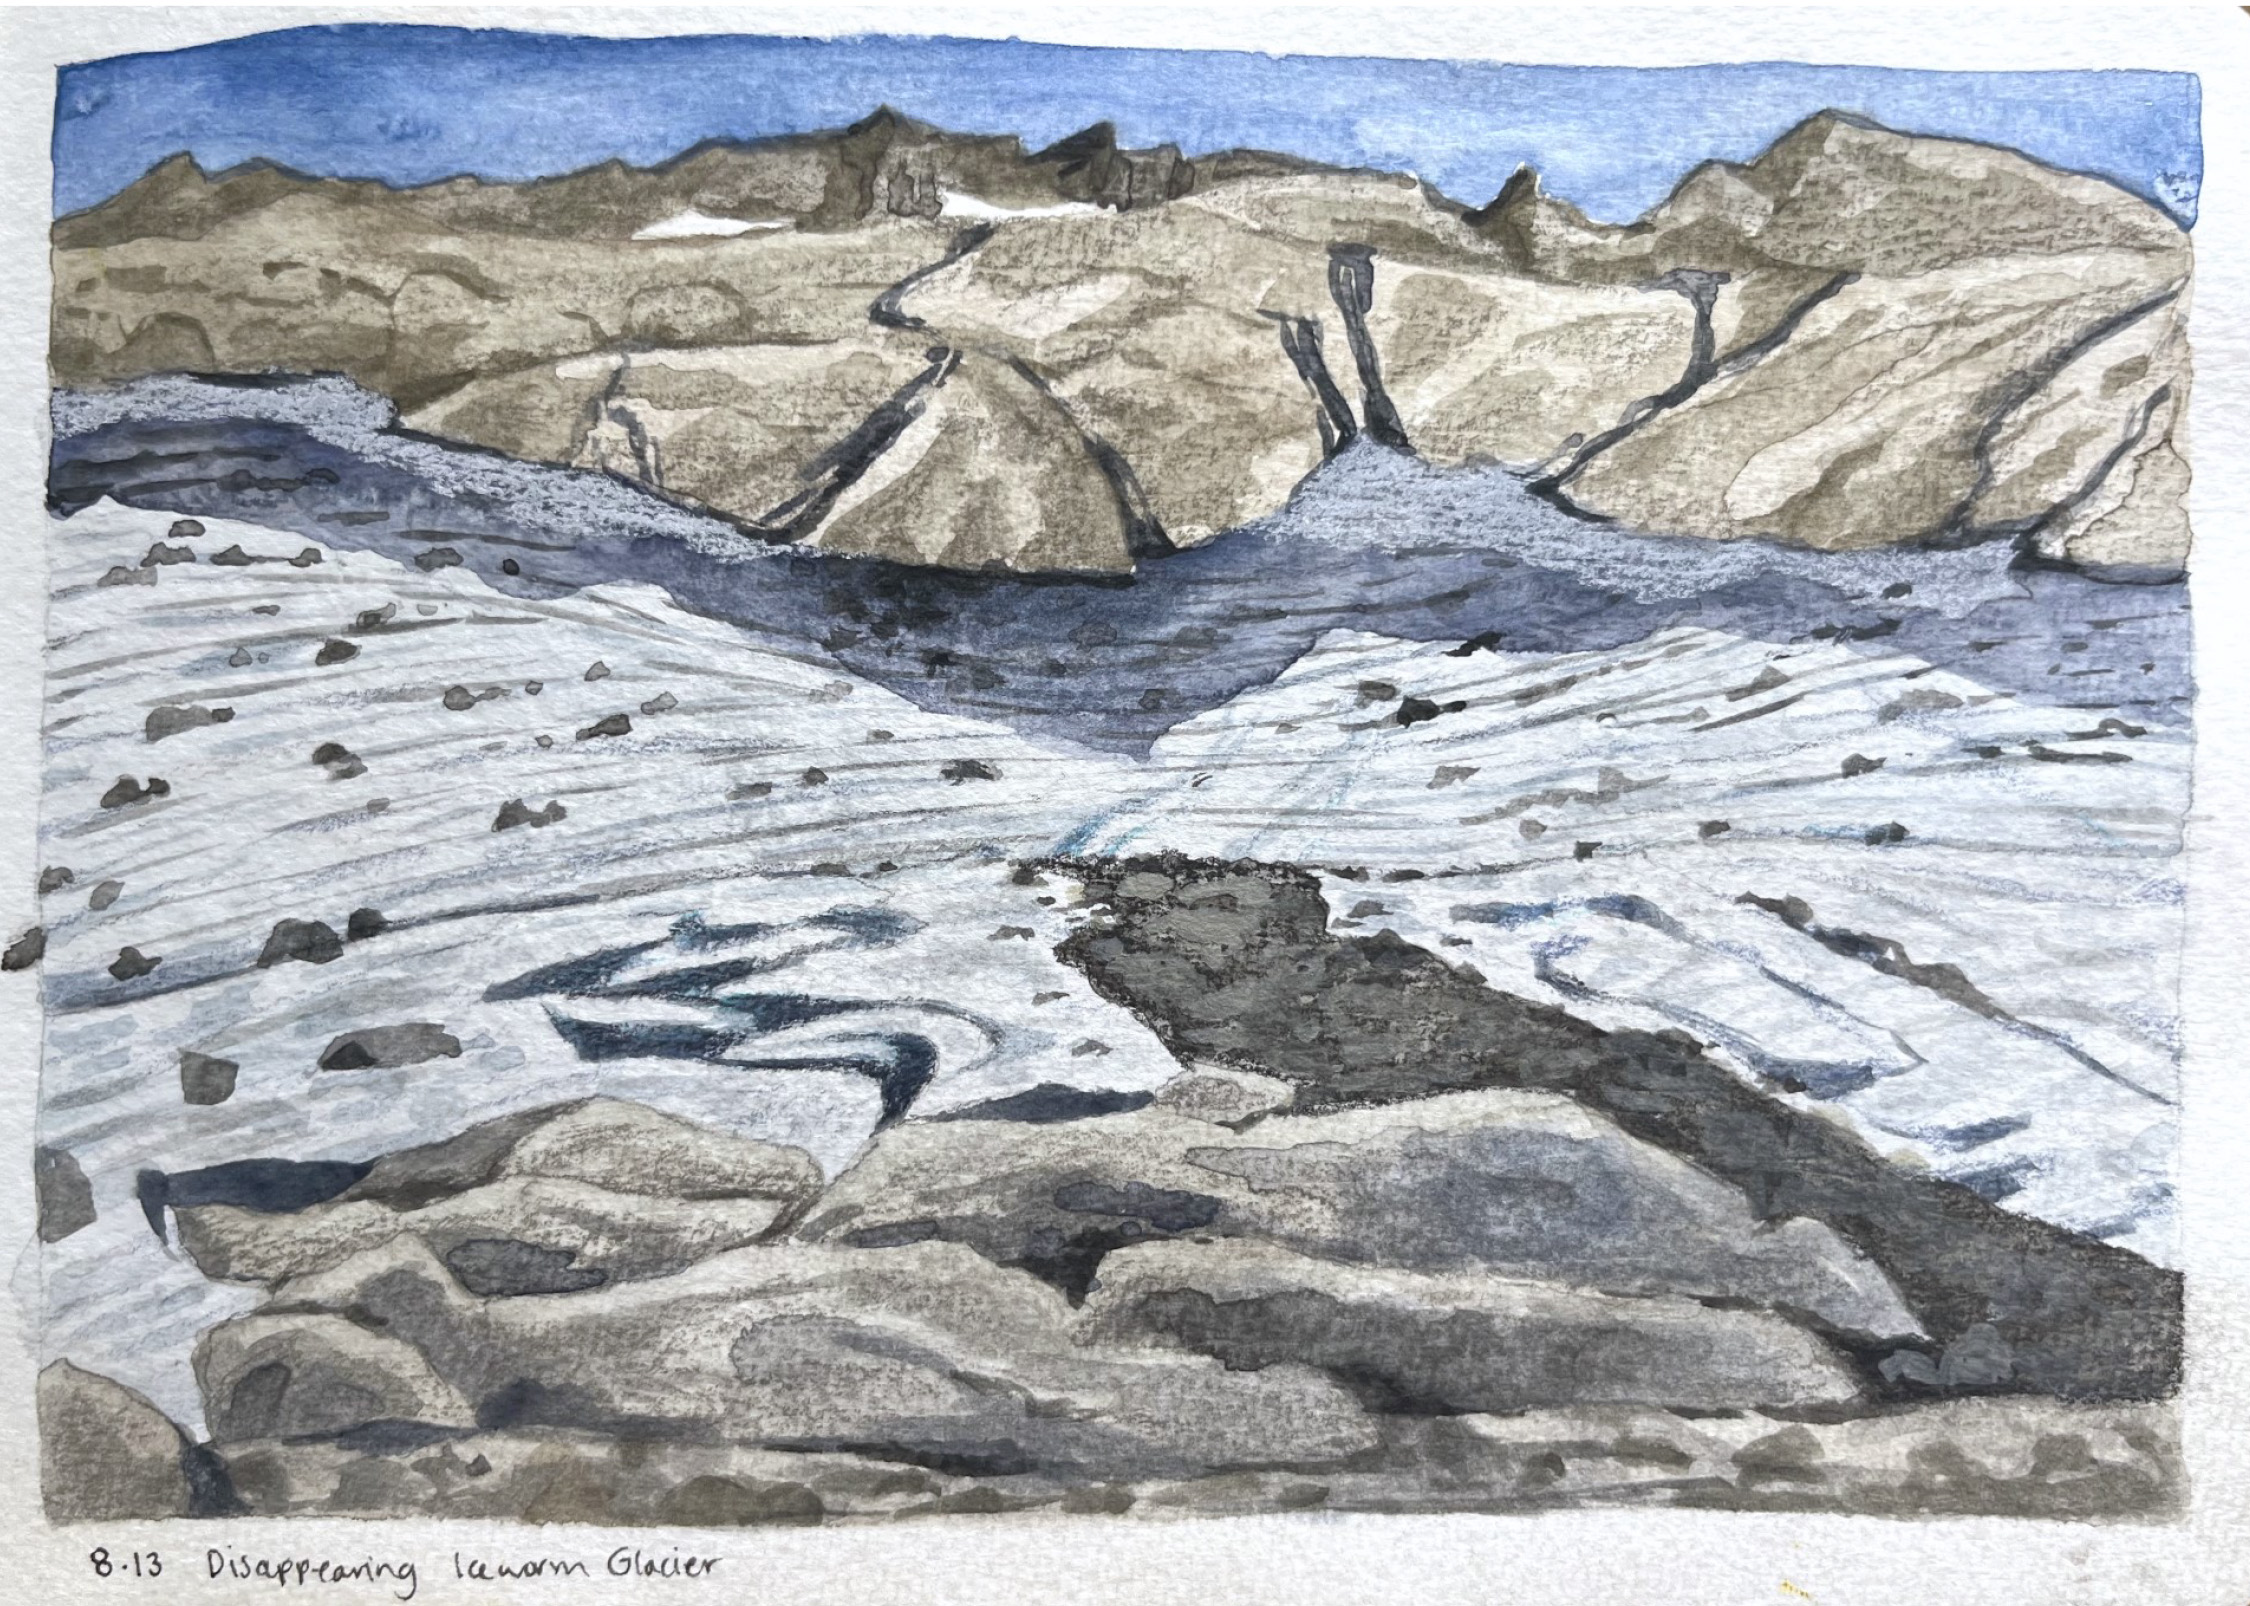
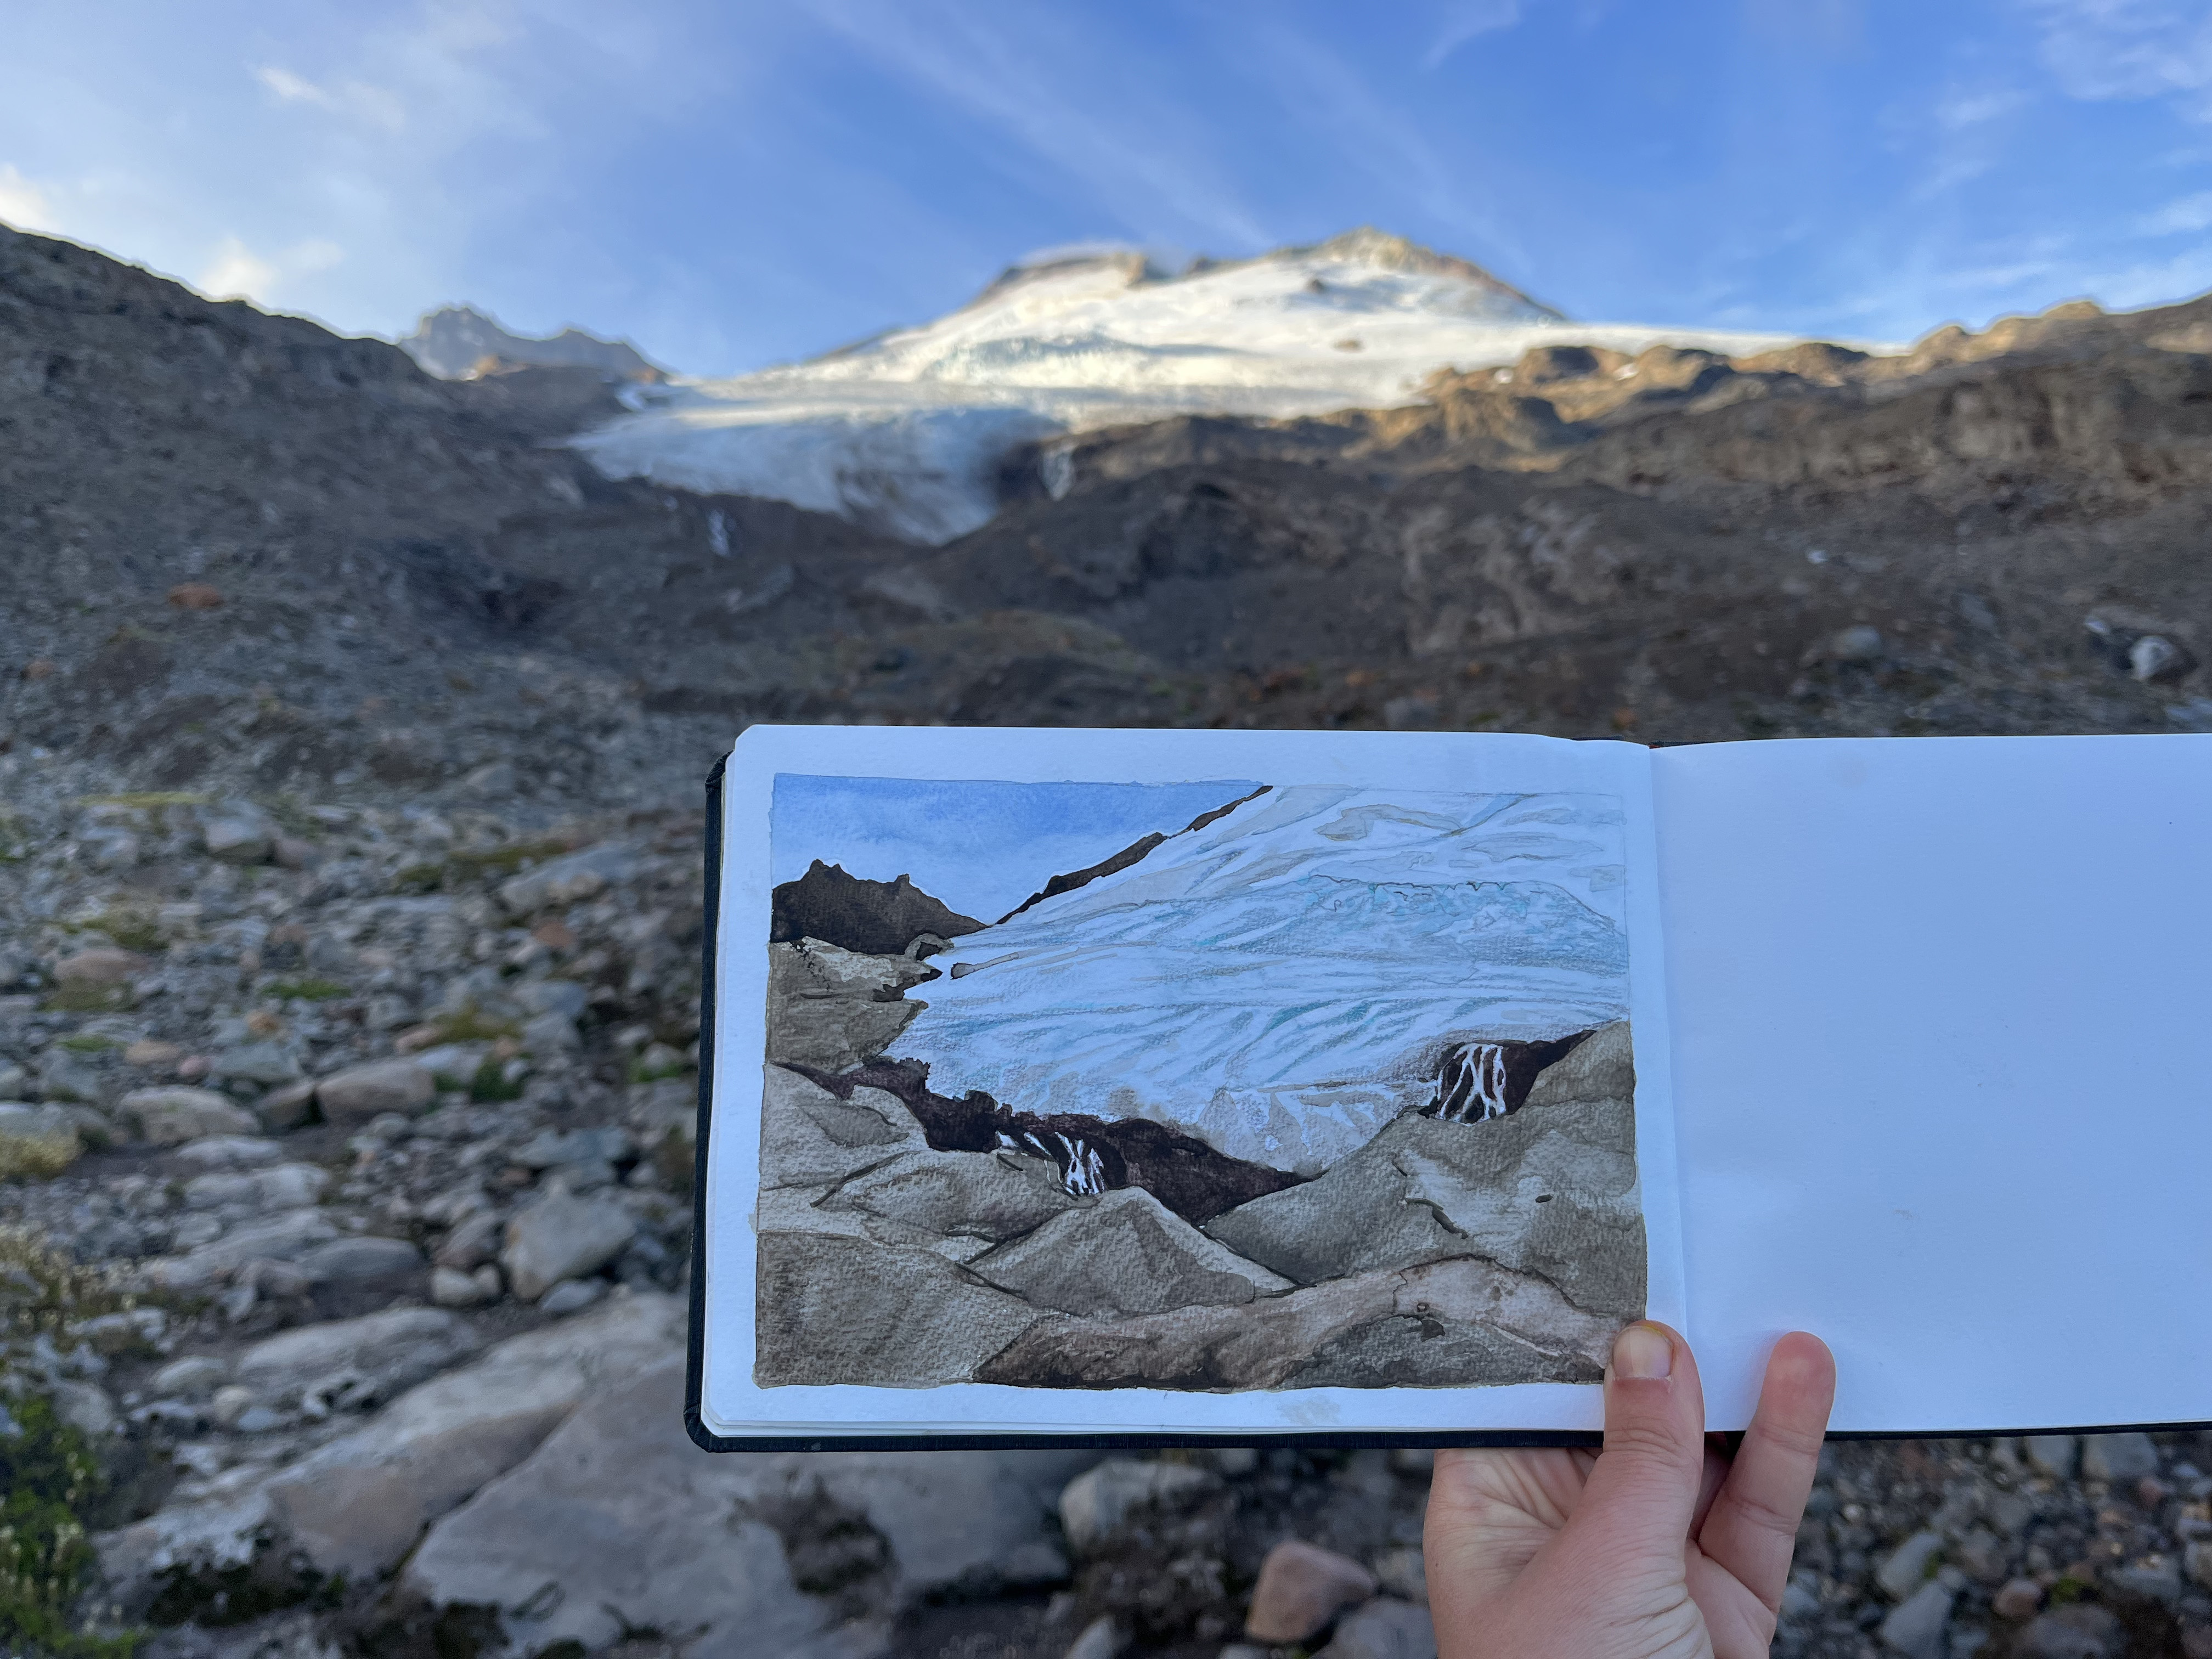
Field Sketch of Ice Worm Glacier from Aug. 13, 2023 on photograph of glacier. (Jill Pelto)
It was July 5, 1981 and Juneau meteorologist Brad Coleman had just informed us that Juneau had experienced one of its warmest least snowy winter ever. I was with the Juneau Icefield Research Program and we were headed up to the icefield the next day, it would be my first visit to a glacier. I was looking forward to plentiful summer skiing and now was concerned there would be limited snow. This worry proved unfounded, as once on the icefield, we stayed above 1000 m, and it was all snow, allowing me to ski 500 km in the next several weeks. From that summer through 2000, I continued to spend the majority of my time working on glaciers every August skiing whether in Alaska or in the North Cascade Range, Washington. Alpine glaciers need to maintain at 55%+ snowcover right to the end of the summer to maintain equilibrium. Hence, skiing should be plentiful. However, in 2003 I gave up skiing on glaciers during our August North Cascade field seasons, the snow had become too limited and patchy. During the last decade the percentage of snowcover has been consistently low, with the 2021-2023 period setting the record for persistent snowcover deficits in the North Cascacdes, but also throughout the Pacific Northwest from Mount Robson, BC to Mount Shasta CA. This sequence of difficult years for glaciers had led to the end for quite a few. -Mauri Pelto
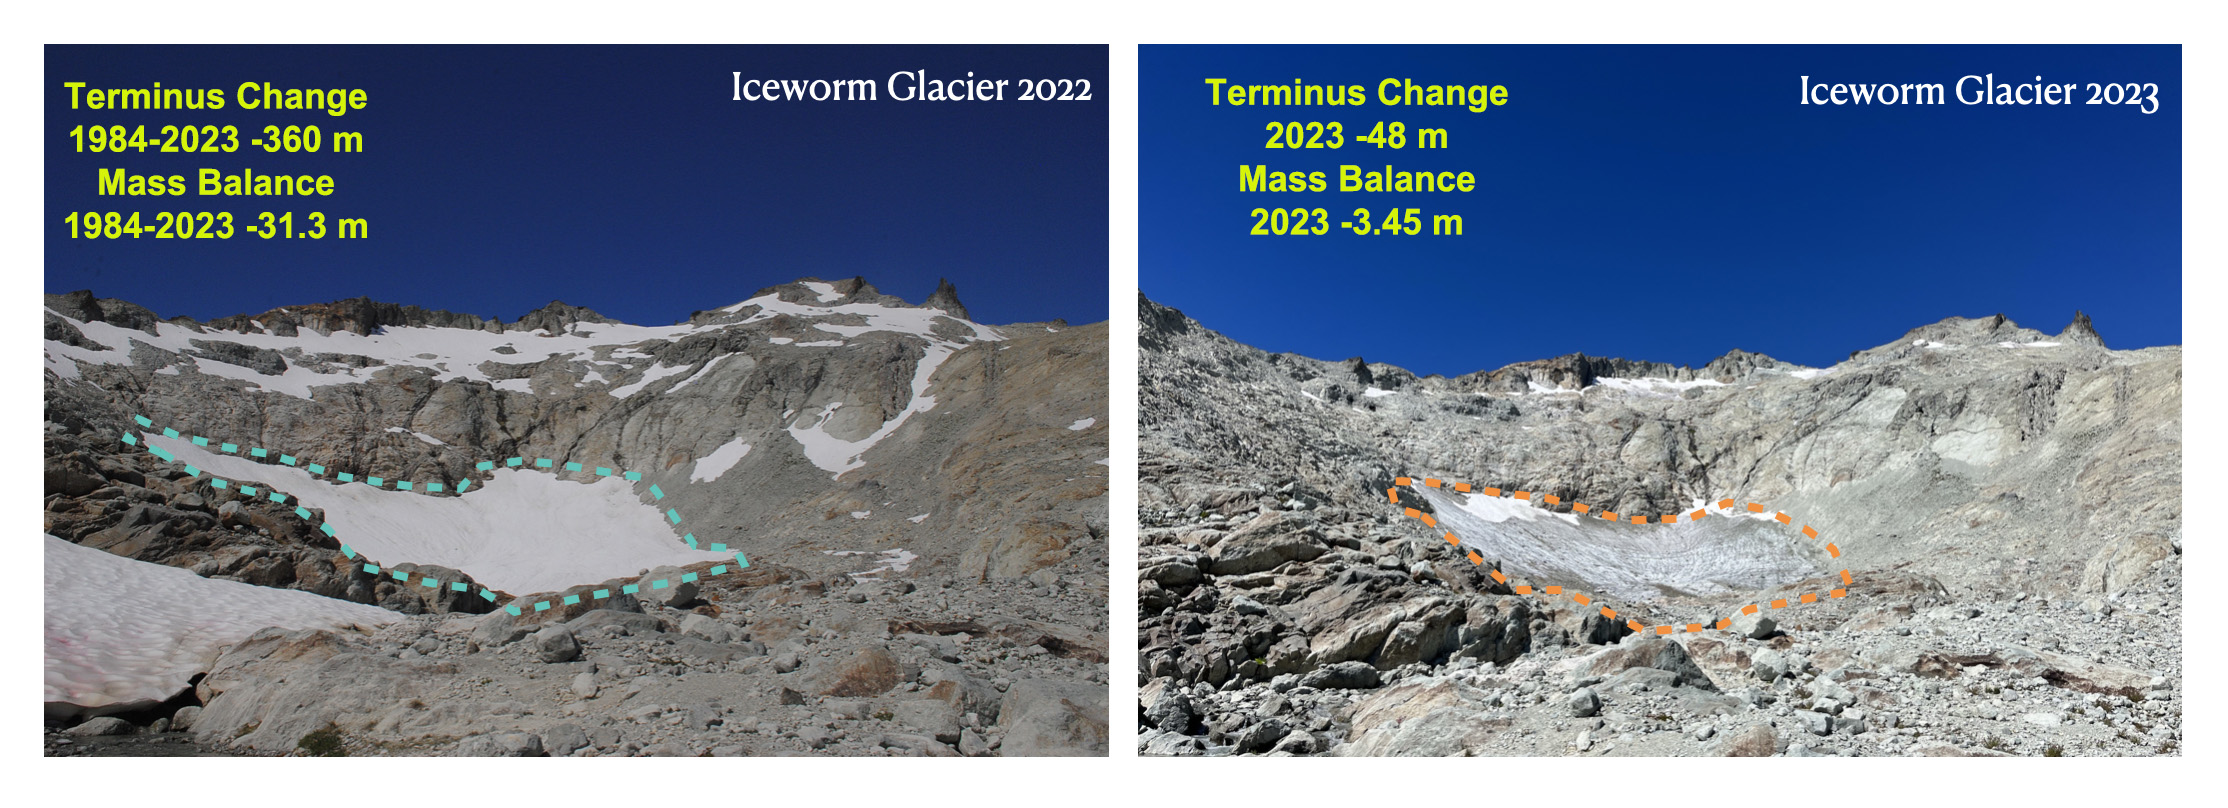
I have spent 15 years with the NCGCP most years snow remains only at higher elevations or in large avalanche fans, with a couple of years having deep snowpack and lack of heat waves has led to a good year for the glaciers. And now years like 2015, 2021 and 2023 where there is so little snow that walking on the glaciers is almost a different landscape. Every feature is exposed, debris cover is piled up, and new or changed water features like melt channels or ponds emerge. In August 2023 it was most starkly seen on Mt. Daniel, on the eastern, drier side of the North Cascades. It was my first year seeing the loss of a glacier: the Iceworm Glacier. A remnant ice patch remains, but there are no longer any active features such as crevasses. It was also my first time seeing the very steep Daniel Glacier with essentially no snow. Navigating across bare ice on a 35+ degree slope for very few measurements had our whole team questioning how long it would be worth our effort. Some of my favorite moments of my 14 other seasons are glissading (or skiing with your hiking boots) down the steep slopes of Daniels. You can carve turns and do quick stops, and you can get down the glacier in about a quarter of the time you climb up. It’s always an exhilarating and rewarding way to end the season. This year the descent was difficult one firm crampon step at a time. I clung onto one fun glissade on the adjacent Lynch Glacier. In that moment I needed to enjoy what I could, and after the season I needed to feel the loss of a place that has defined a piece of my life.
Here we focus on this lack of snowcover we observed in the field and in satellite images from Mount Hood, OR to Mount Robson BC in August and Septemeber 2023. This combined with 2021-2023 has redefined many glaciers, making it clear how many cannot survive even current climate. We developed a forecast model of alpine glacier survival, published in 2010 that indicated significant accumulation zone thinning and/or lack of consistent accumulation zone are indicators of a glacier that cannot survive. The glaciers below on some of the highest peaks in OR, WA and BC are failing this metric in 2023.
Screenshot
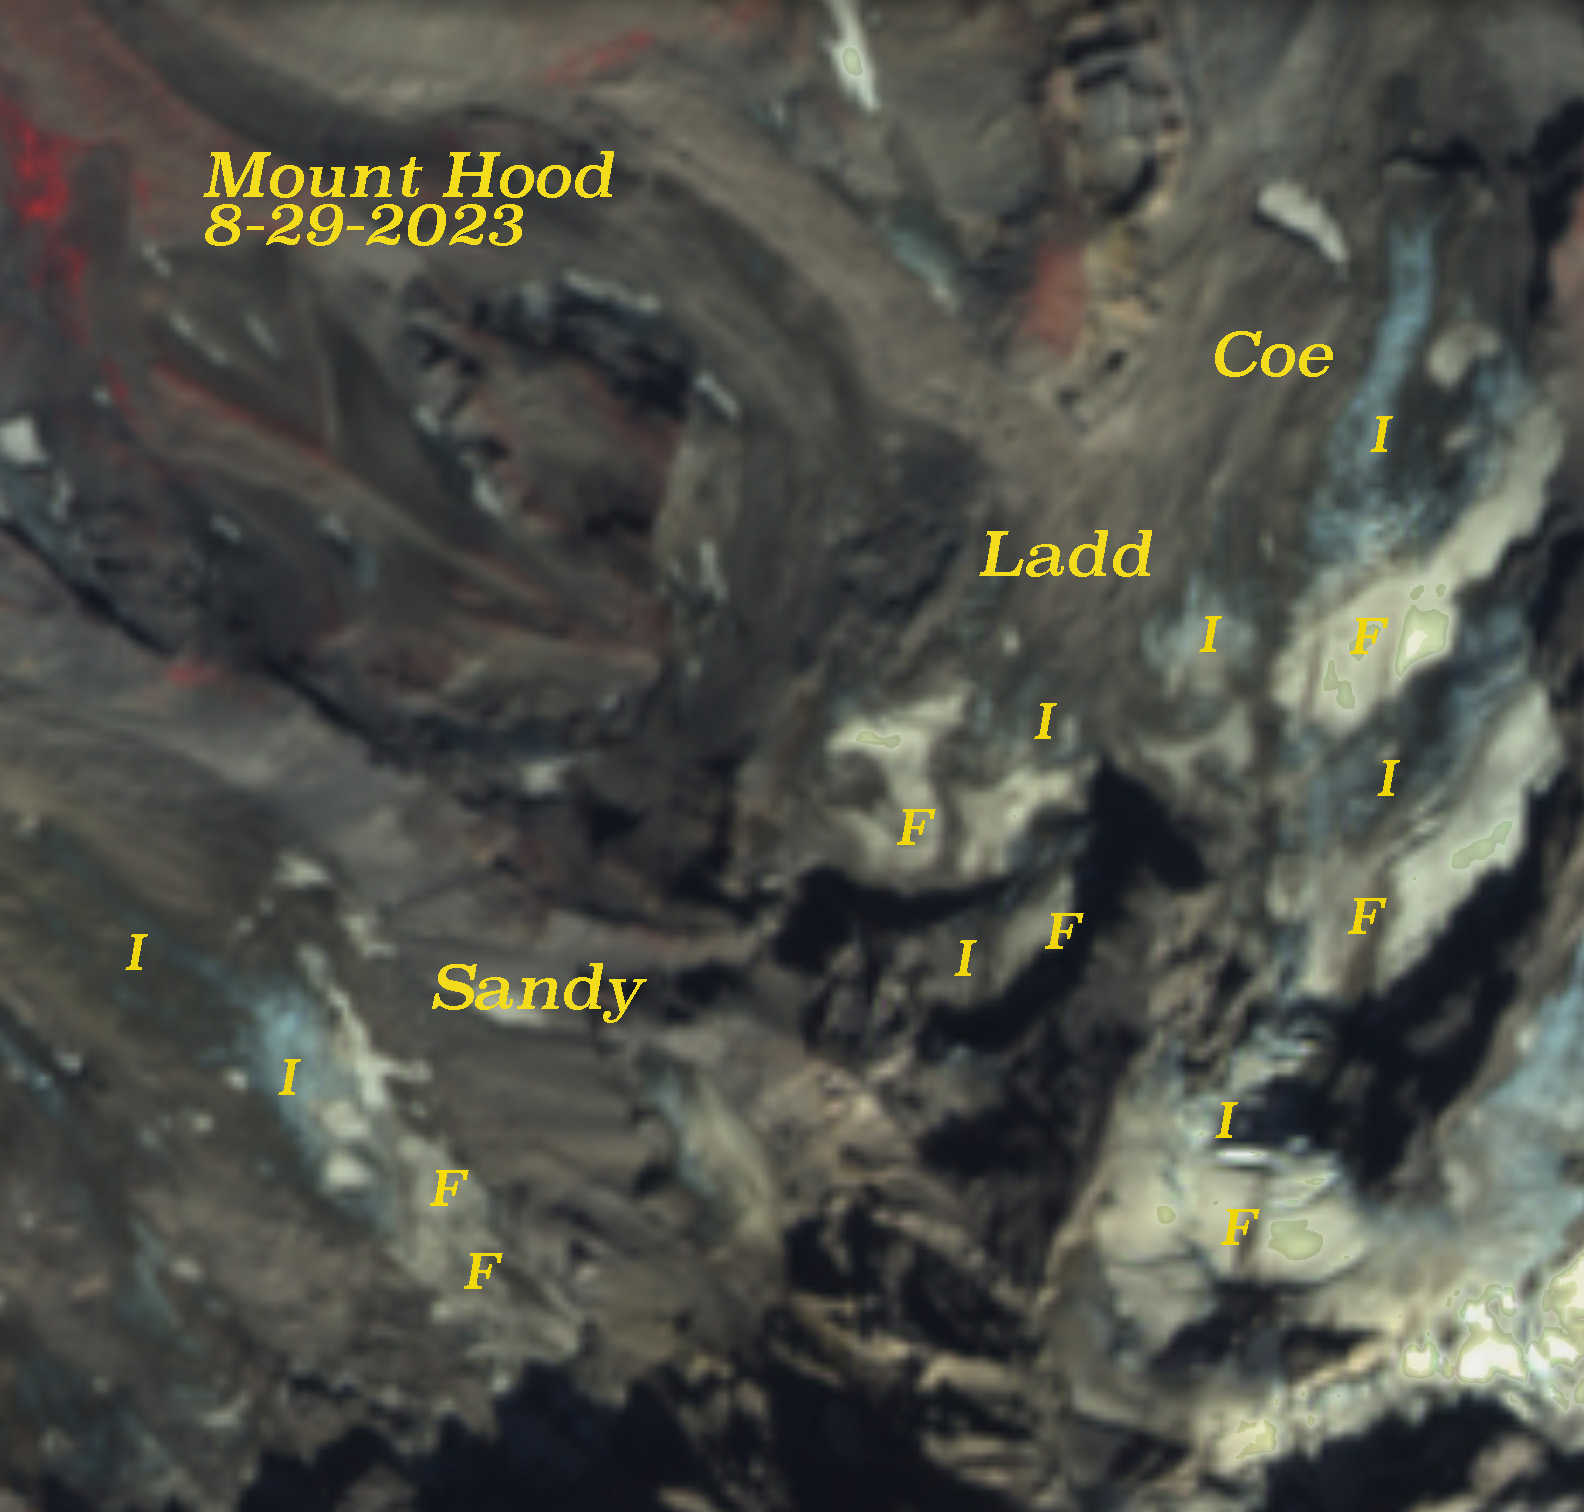
At the end of August 2023 on the north side of Mount Hood, OR; Sandy Glacier and Ladd Glacier are so dirty looking in this Sentinel image that it is hard to discern that they are glaciers, both have limited patches of retained snow from the winter of 2023. Coe Glacier has three pockets of snow remaining from last winter covering close to 30% of the glacier.
Screenshot
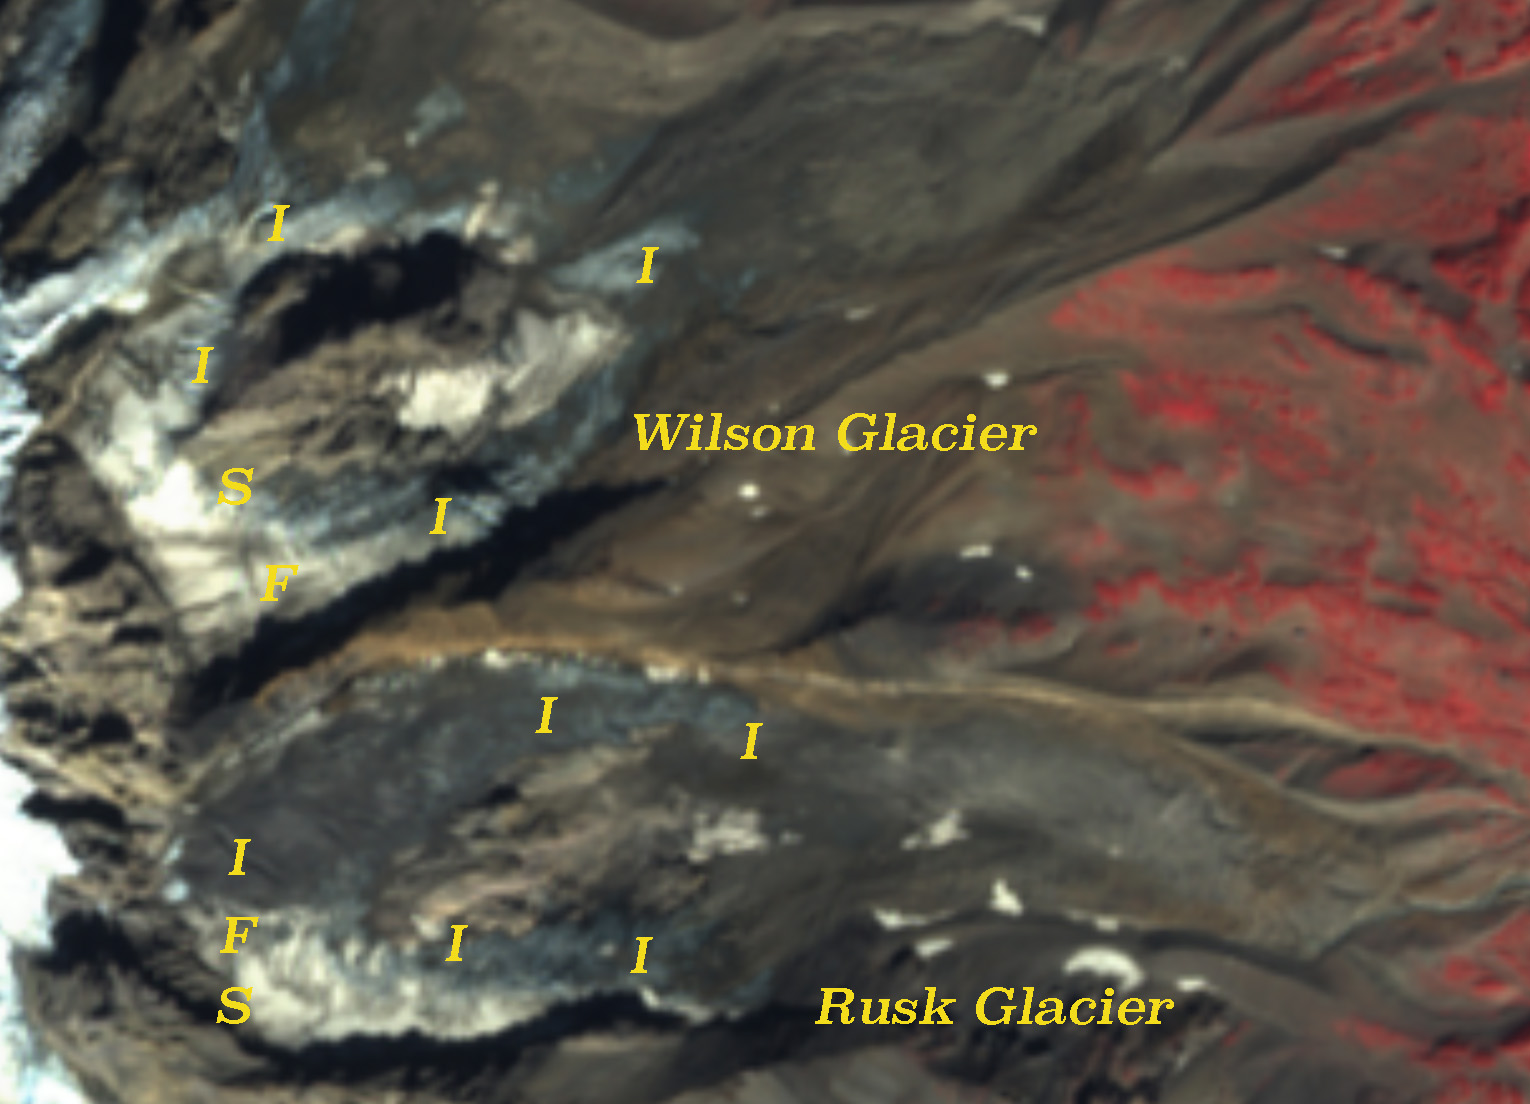
Across the Columbia River on Mount Adams, WA Wilson and Rusk Glacier are both over 90% bare firn and ice, with some snow on the upper margin above 2800 m where avalanche deposits endured.
Screenshot
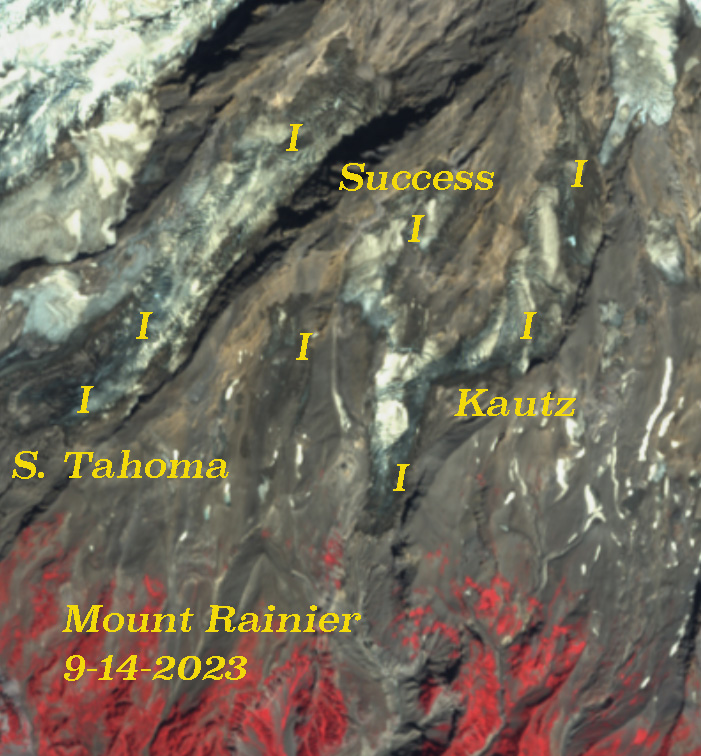
On the south slope of Mount Rainier, WA South Tahoma Glacier and Success Glacier lost all of their snowcover. There are a few patches of snow left on Kautz Glacier. The snowcover becomes more consistent at 3500 m, higher than can sustain most of the glaciers.
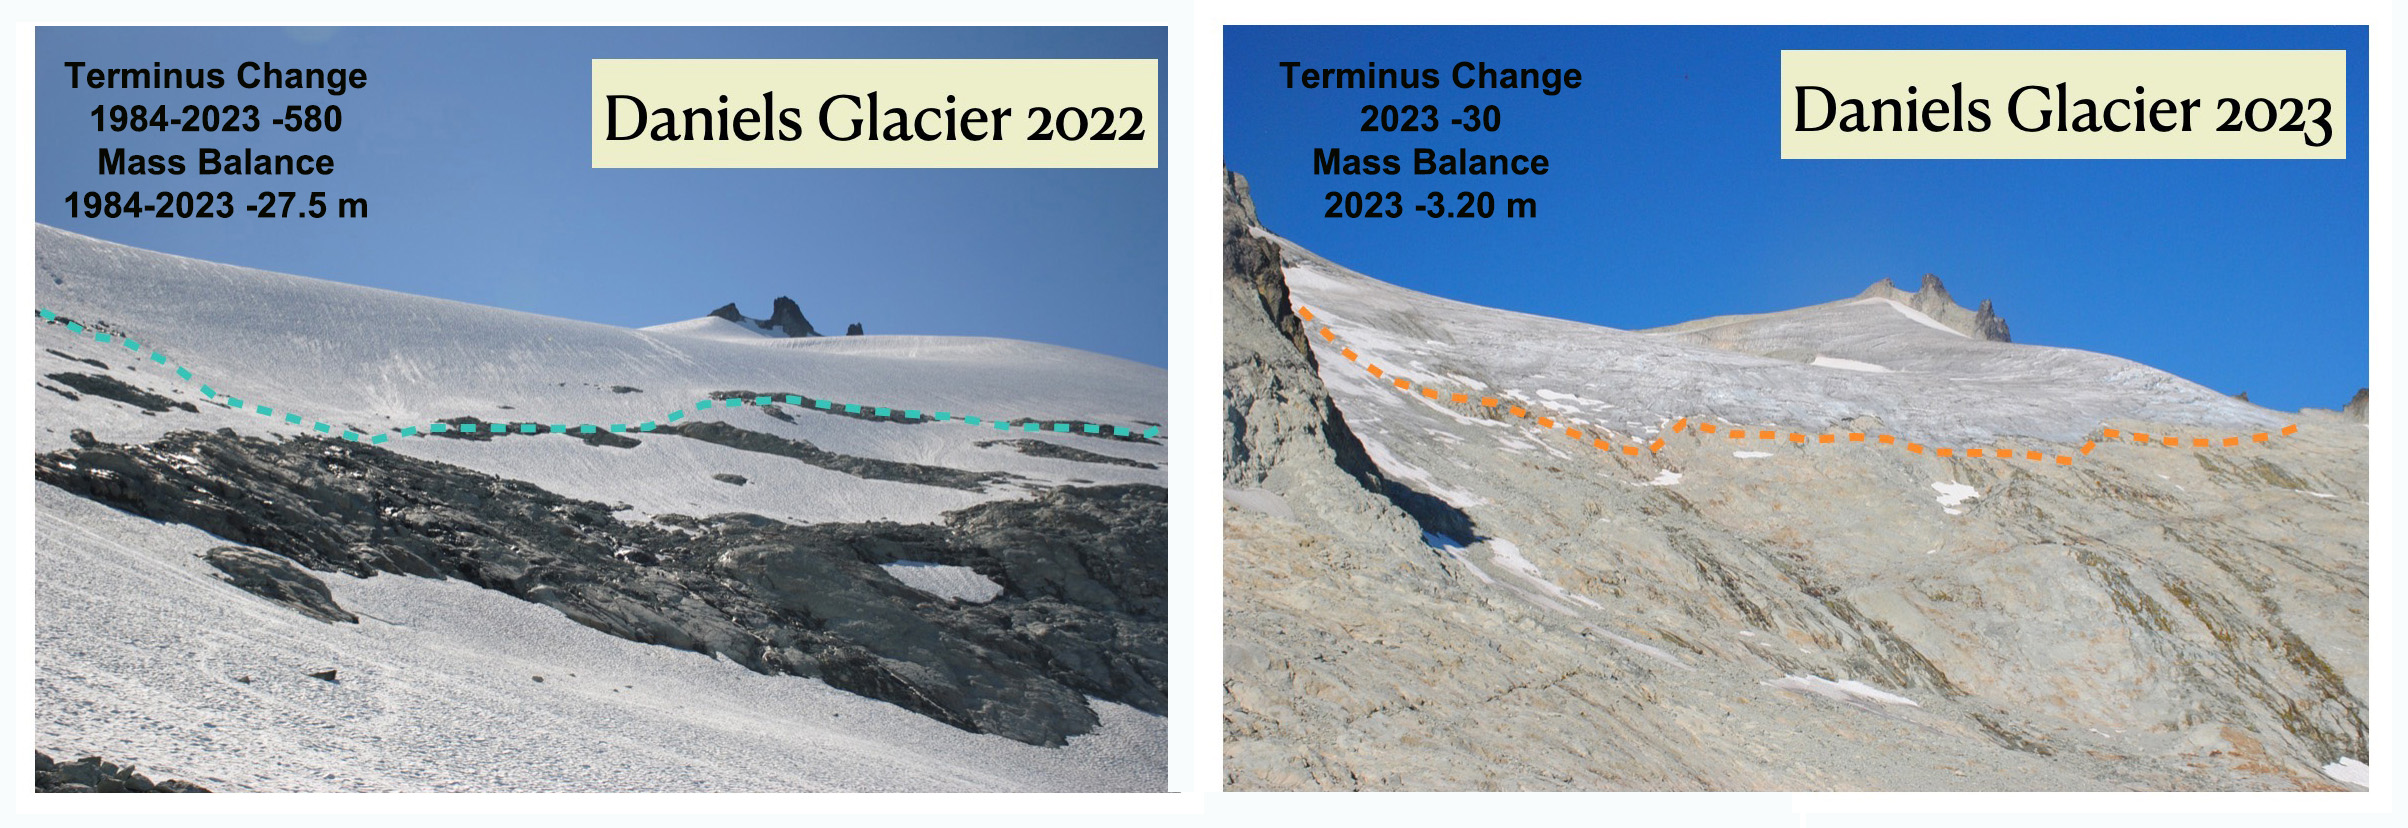
Halfway between Mount Rainier and Glacier Peak is the Mount Daniel/Hinman area where glaciers are in rapid collapse. This includes Ice Worm Glacier on the east slope of Mount Daniel, which lost all of its snowcover in 203 (above) and Daniels Glacier that only has 5% snowcover in mid-August 2023 (below)
Foss Glacier on the northeast slope of Mount Hinman looks like a bug that splats on your windishield with wings/limbs in all directions, this will lead to rapid fragmentation.
Closer to Glacier Peak is Columbia Glacier, below Kyes, Monte Cristo and Columbia Peak. The view down the accumulation zone indicates a lack of snow or firn where there should be 2+ m of snowpack in early August.
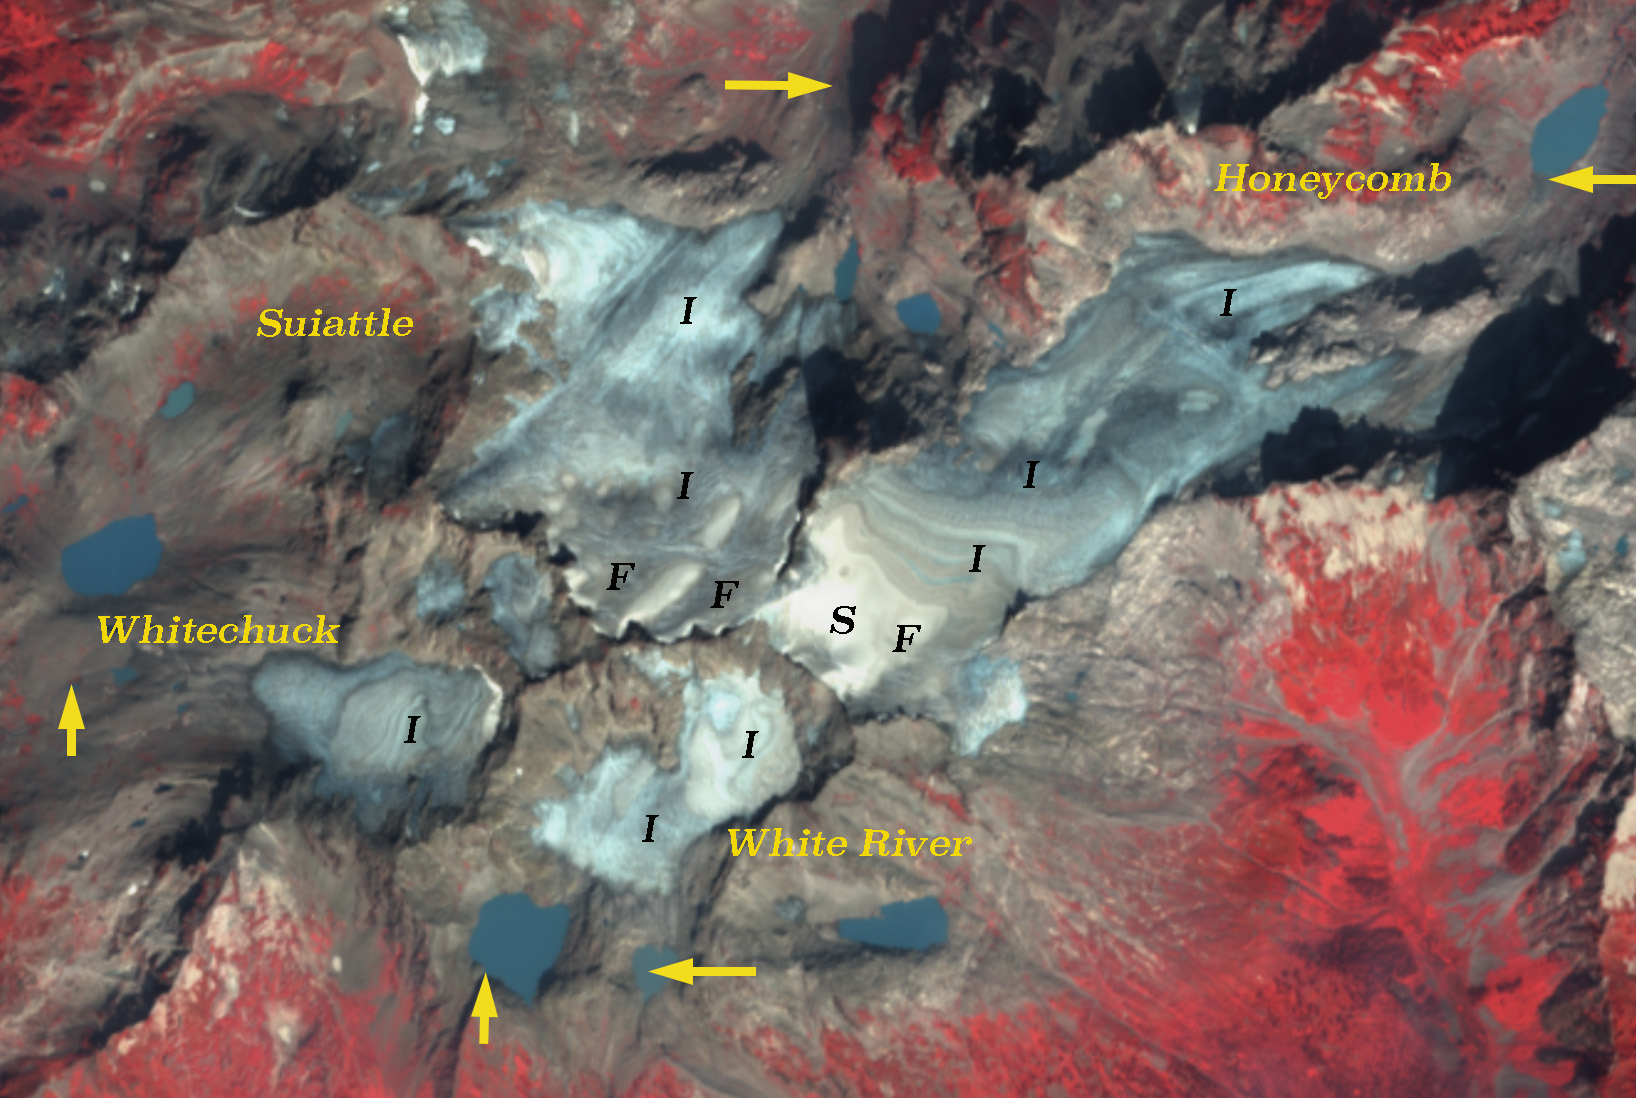
Kololo Peak is on a ridge extending south from Glacier Peak and is host to several large glaciers. In September 2023 Whitechuck, Suiattle and White River Glacier lost all their snowpack, while the top of Honeycomb Glacier has a small area of snow left. Yellow arrows indicate where we observed the terminus of these glaciers 40 years ago.
Screenshot
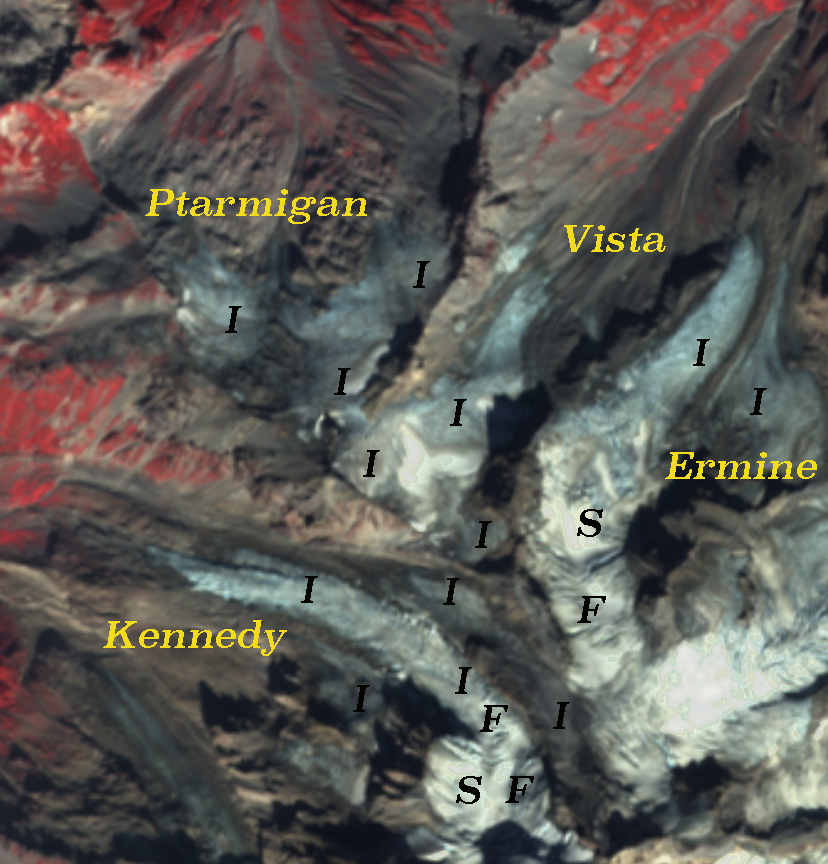
On Glacier Peak Ptarmigan Glacier has separated into and east and west part and had no retained snow. Kennedy, Vista and Ermine Glacier had 10-20% retained snowcover on 9-15-2023 mostly in a band at 2500 m. Yellow arrows indicate terminus locations when I first visited these glaciers 40 years ago.
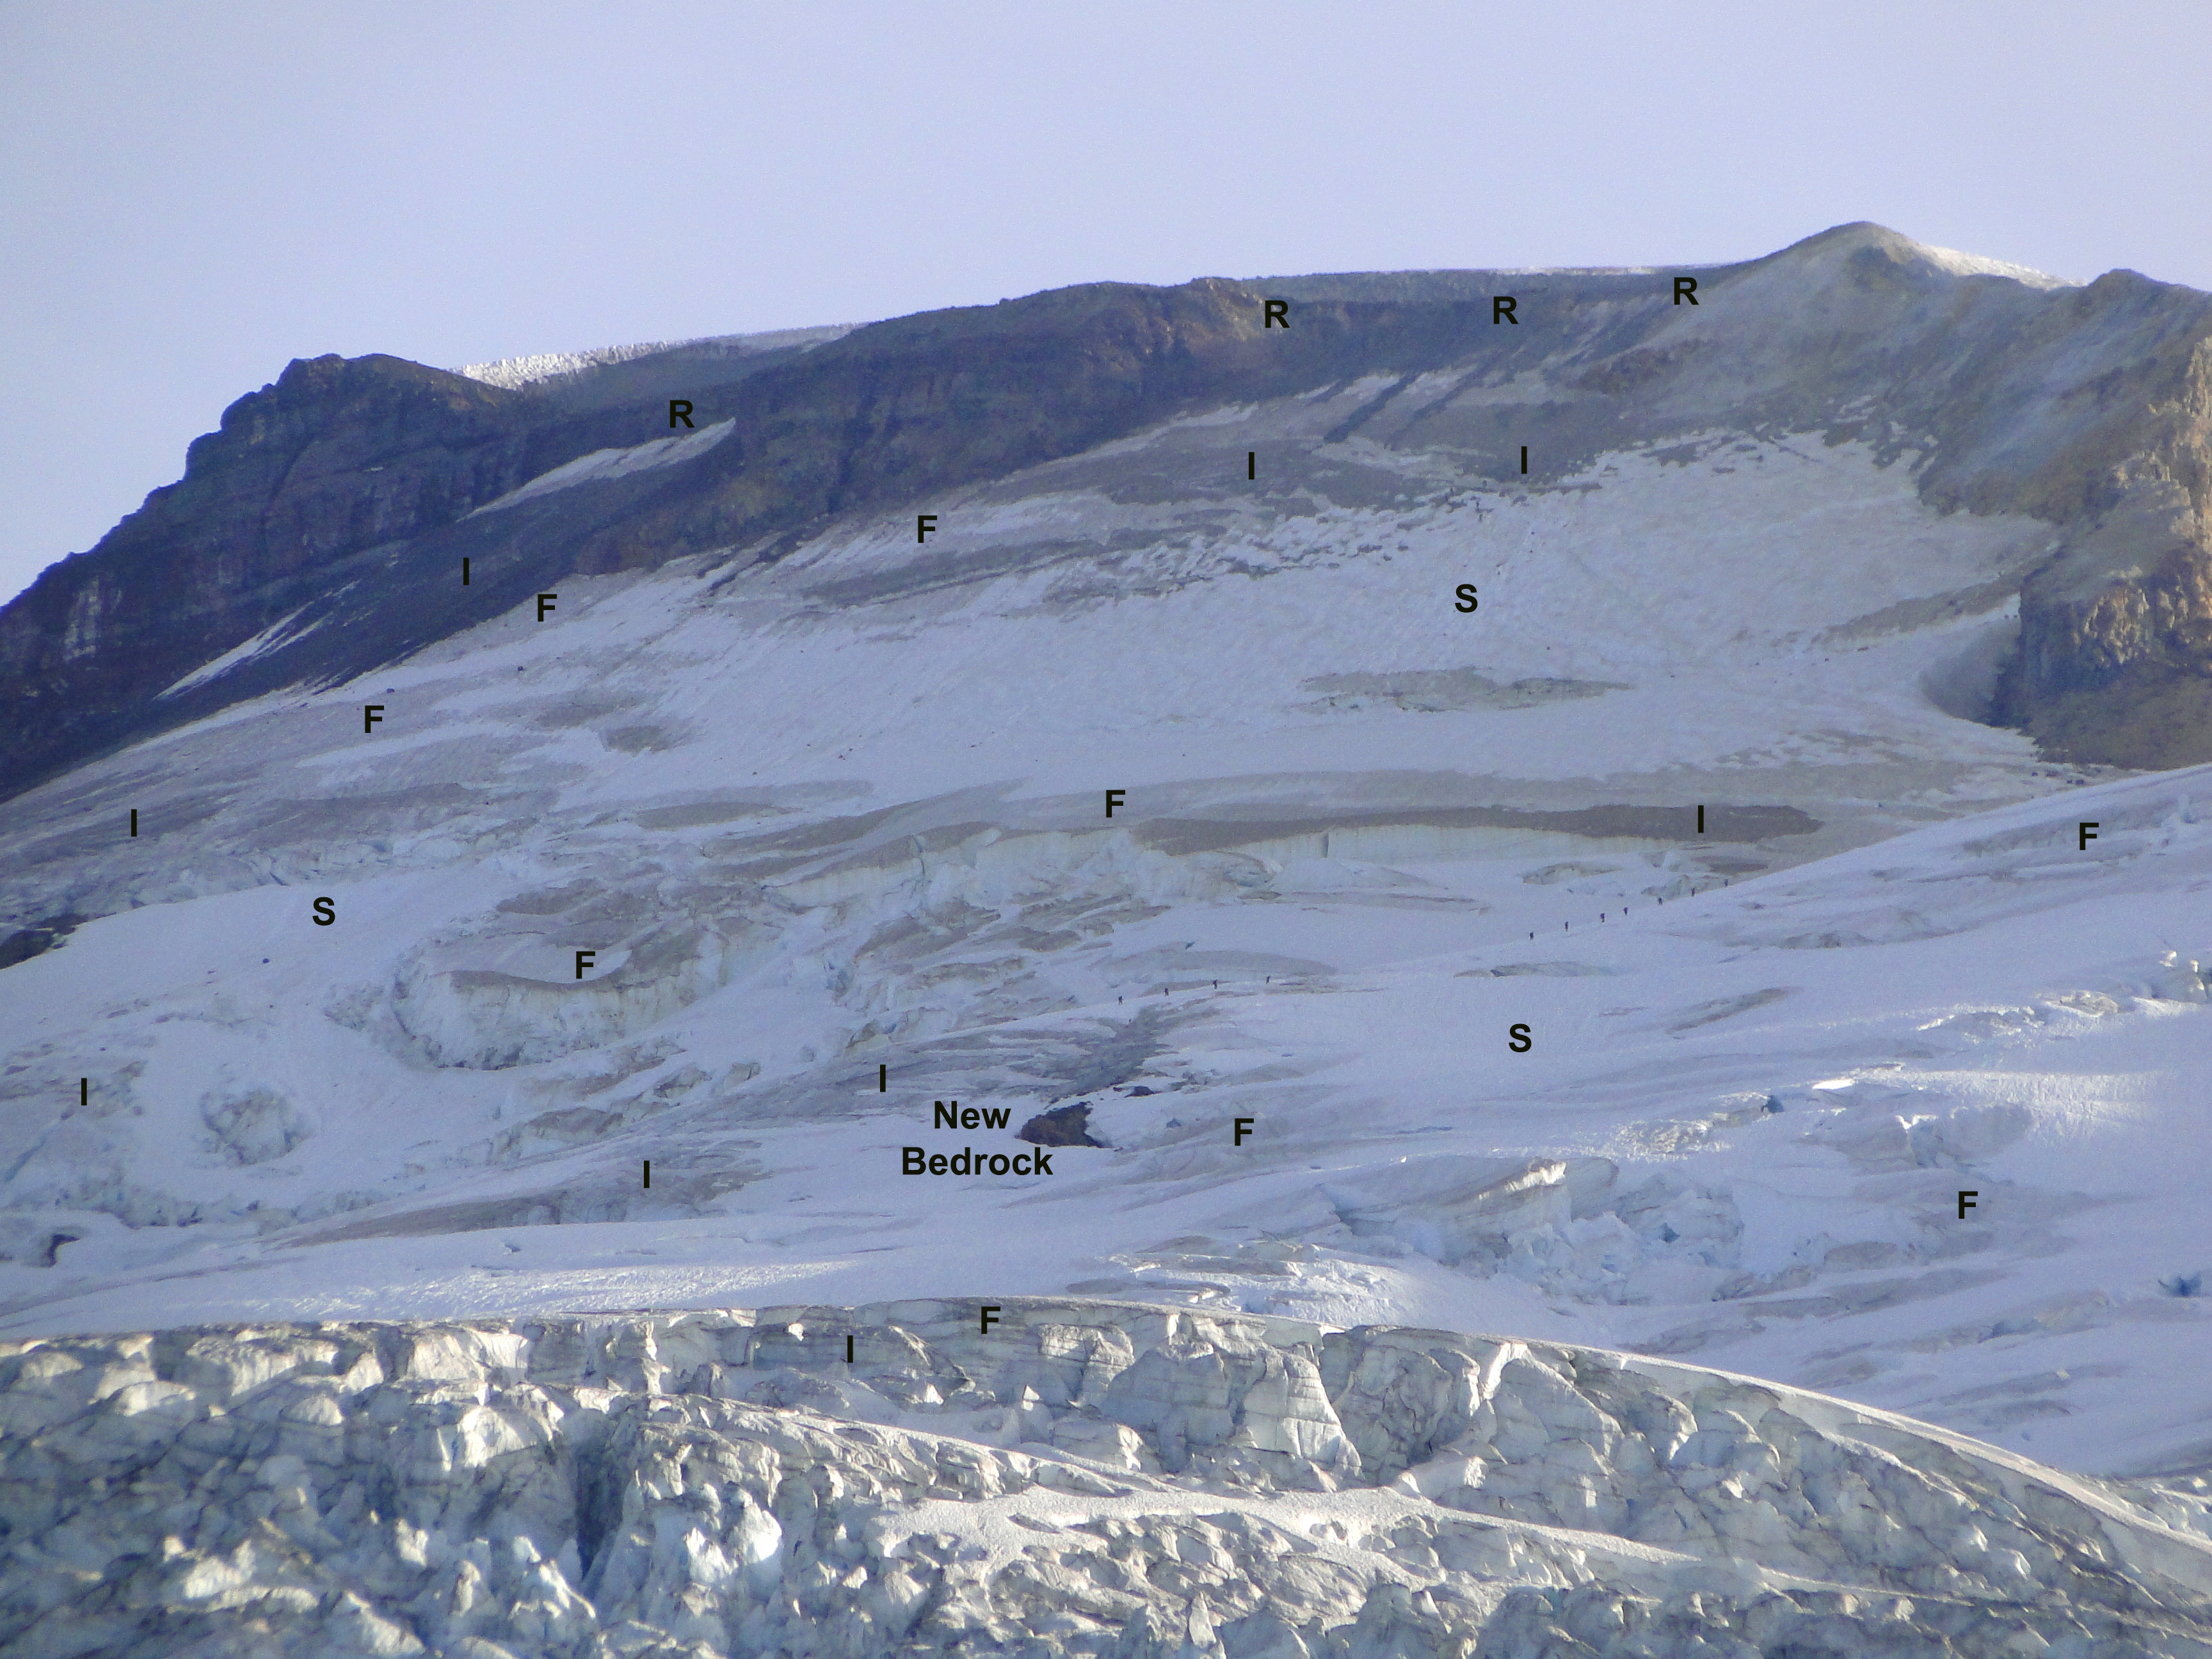
Easton Glacier is on the south/southwest side of Mt. Baker. The upper part of the glacier is a patchwork of ice, firn and snow, with new rock areas emerging even high on the glacier in August 2023. The difference with 2022 is evident. Two new waterfalls appeared in 2023 due to the extensive thinning and retreat at the terminus., yellow arrows. These are also depicted in the field sketch by Jill Pelto below.
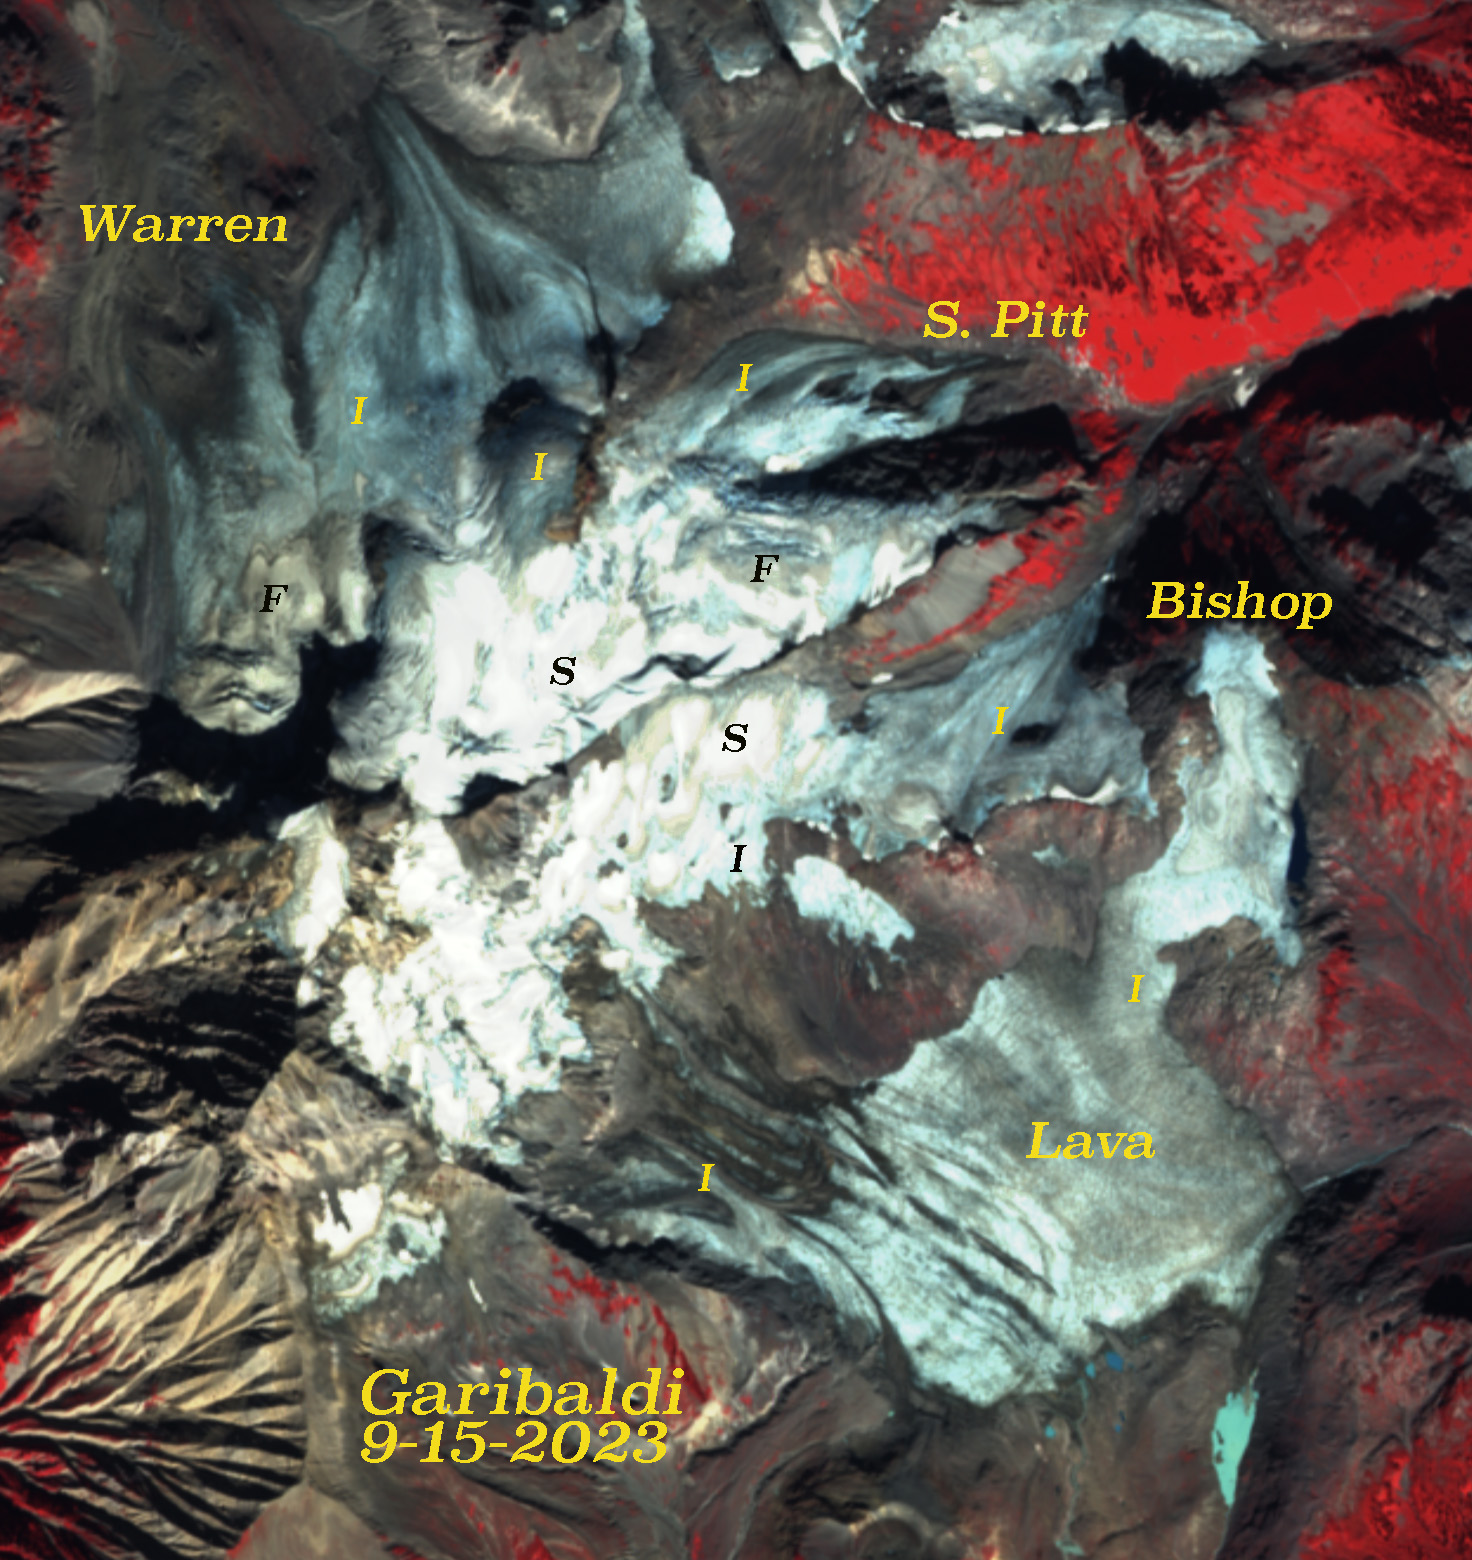
Near Whistler, BC, the Garibaldi Neve (Icefield) showed little remaining snow in mid-September. Snow only clings high on Mount Garibaldi above 2200 m or 7200 ft.
Small glaciers across the region are losing all traces of seasonal and multi-year snow and are transitioning from active glaciers to remnant ice patches. The Stadium Glacier near Squamish British Columbia is one example of this. Photo by Ben Pelto.
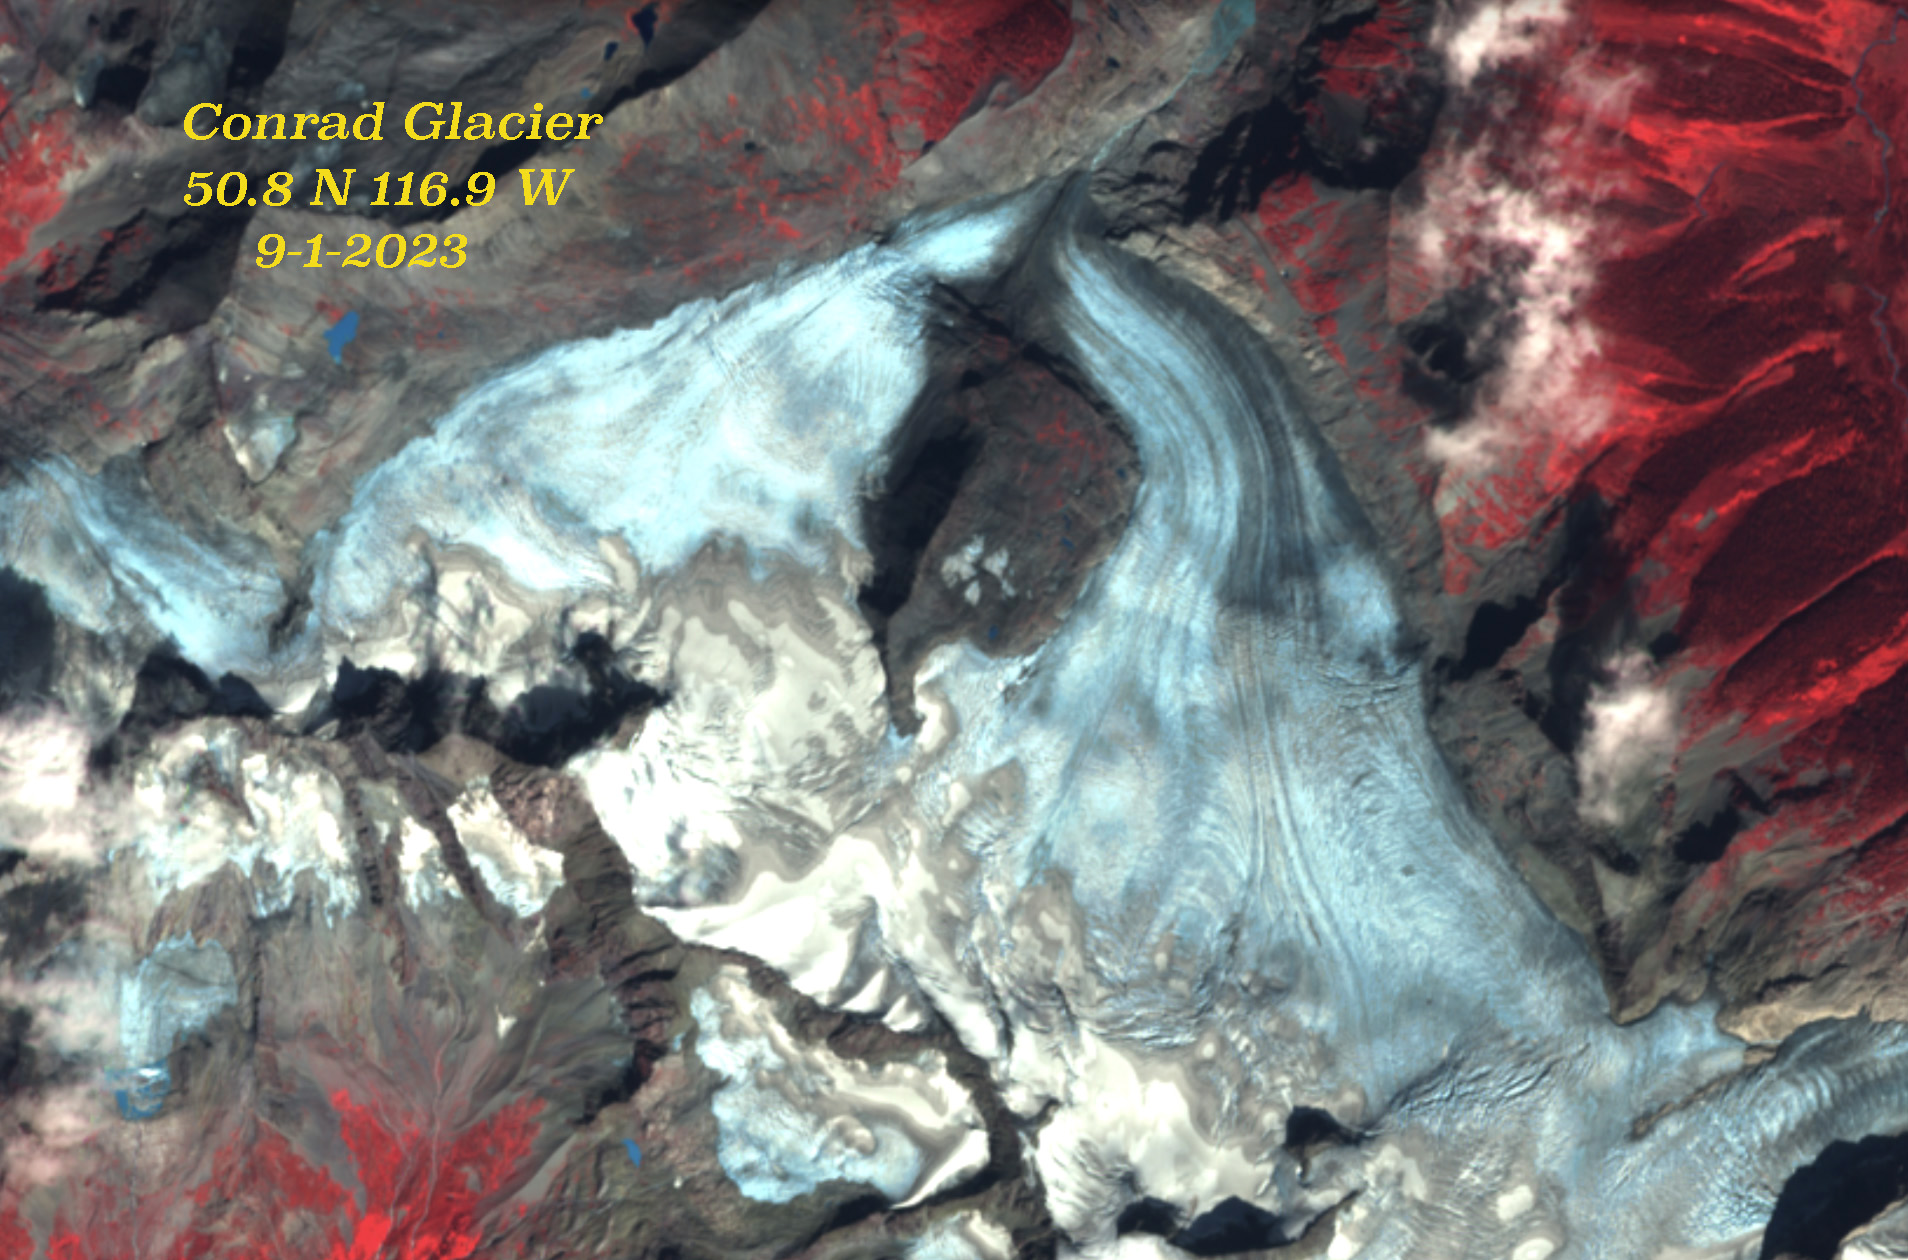
The Conrad Glacier on the boundary of Bugaboo Provincial Park in British Columbia showing extensive bare ice and limited snow cover. The dark grey areas surrounding the white snow is firn, or multi-year snow, now exposed. The area covered by firn is important to glacier health. Firn that remains on a glacier becomes glacier ice and can retain meltwater. Areas of bare ice behave like a parking lot, nearly all water that reaches glacier ice leaves the glacier as runoff. The area of glaciers covered by firn is dramatically decreasing in the region. Pelto et al. (2019) found that 58% of the Conrad Glacier was covered by multi-year firn, a quick visual scan here shows that that number has declined to roughly 30-40%.
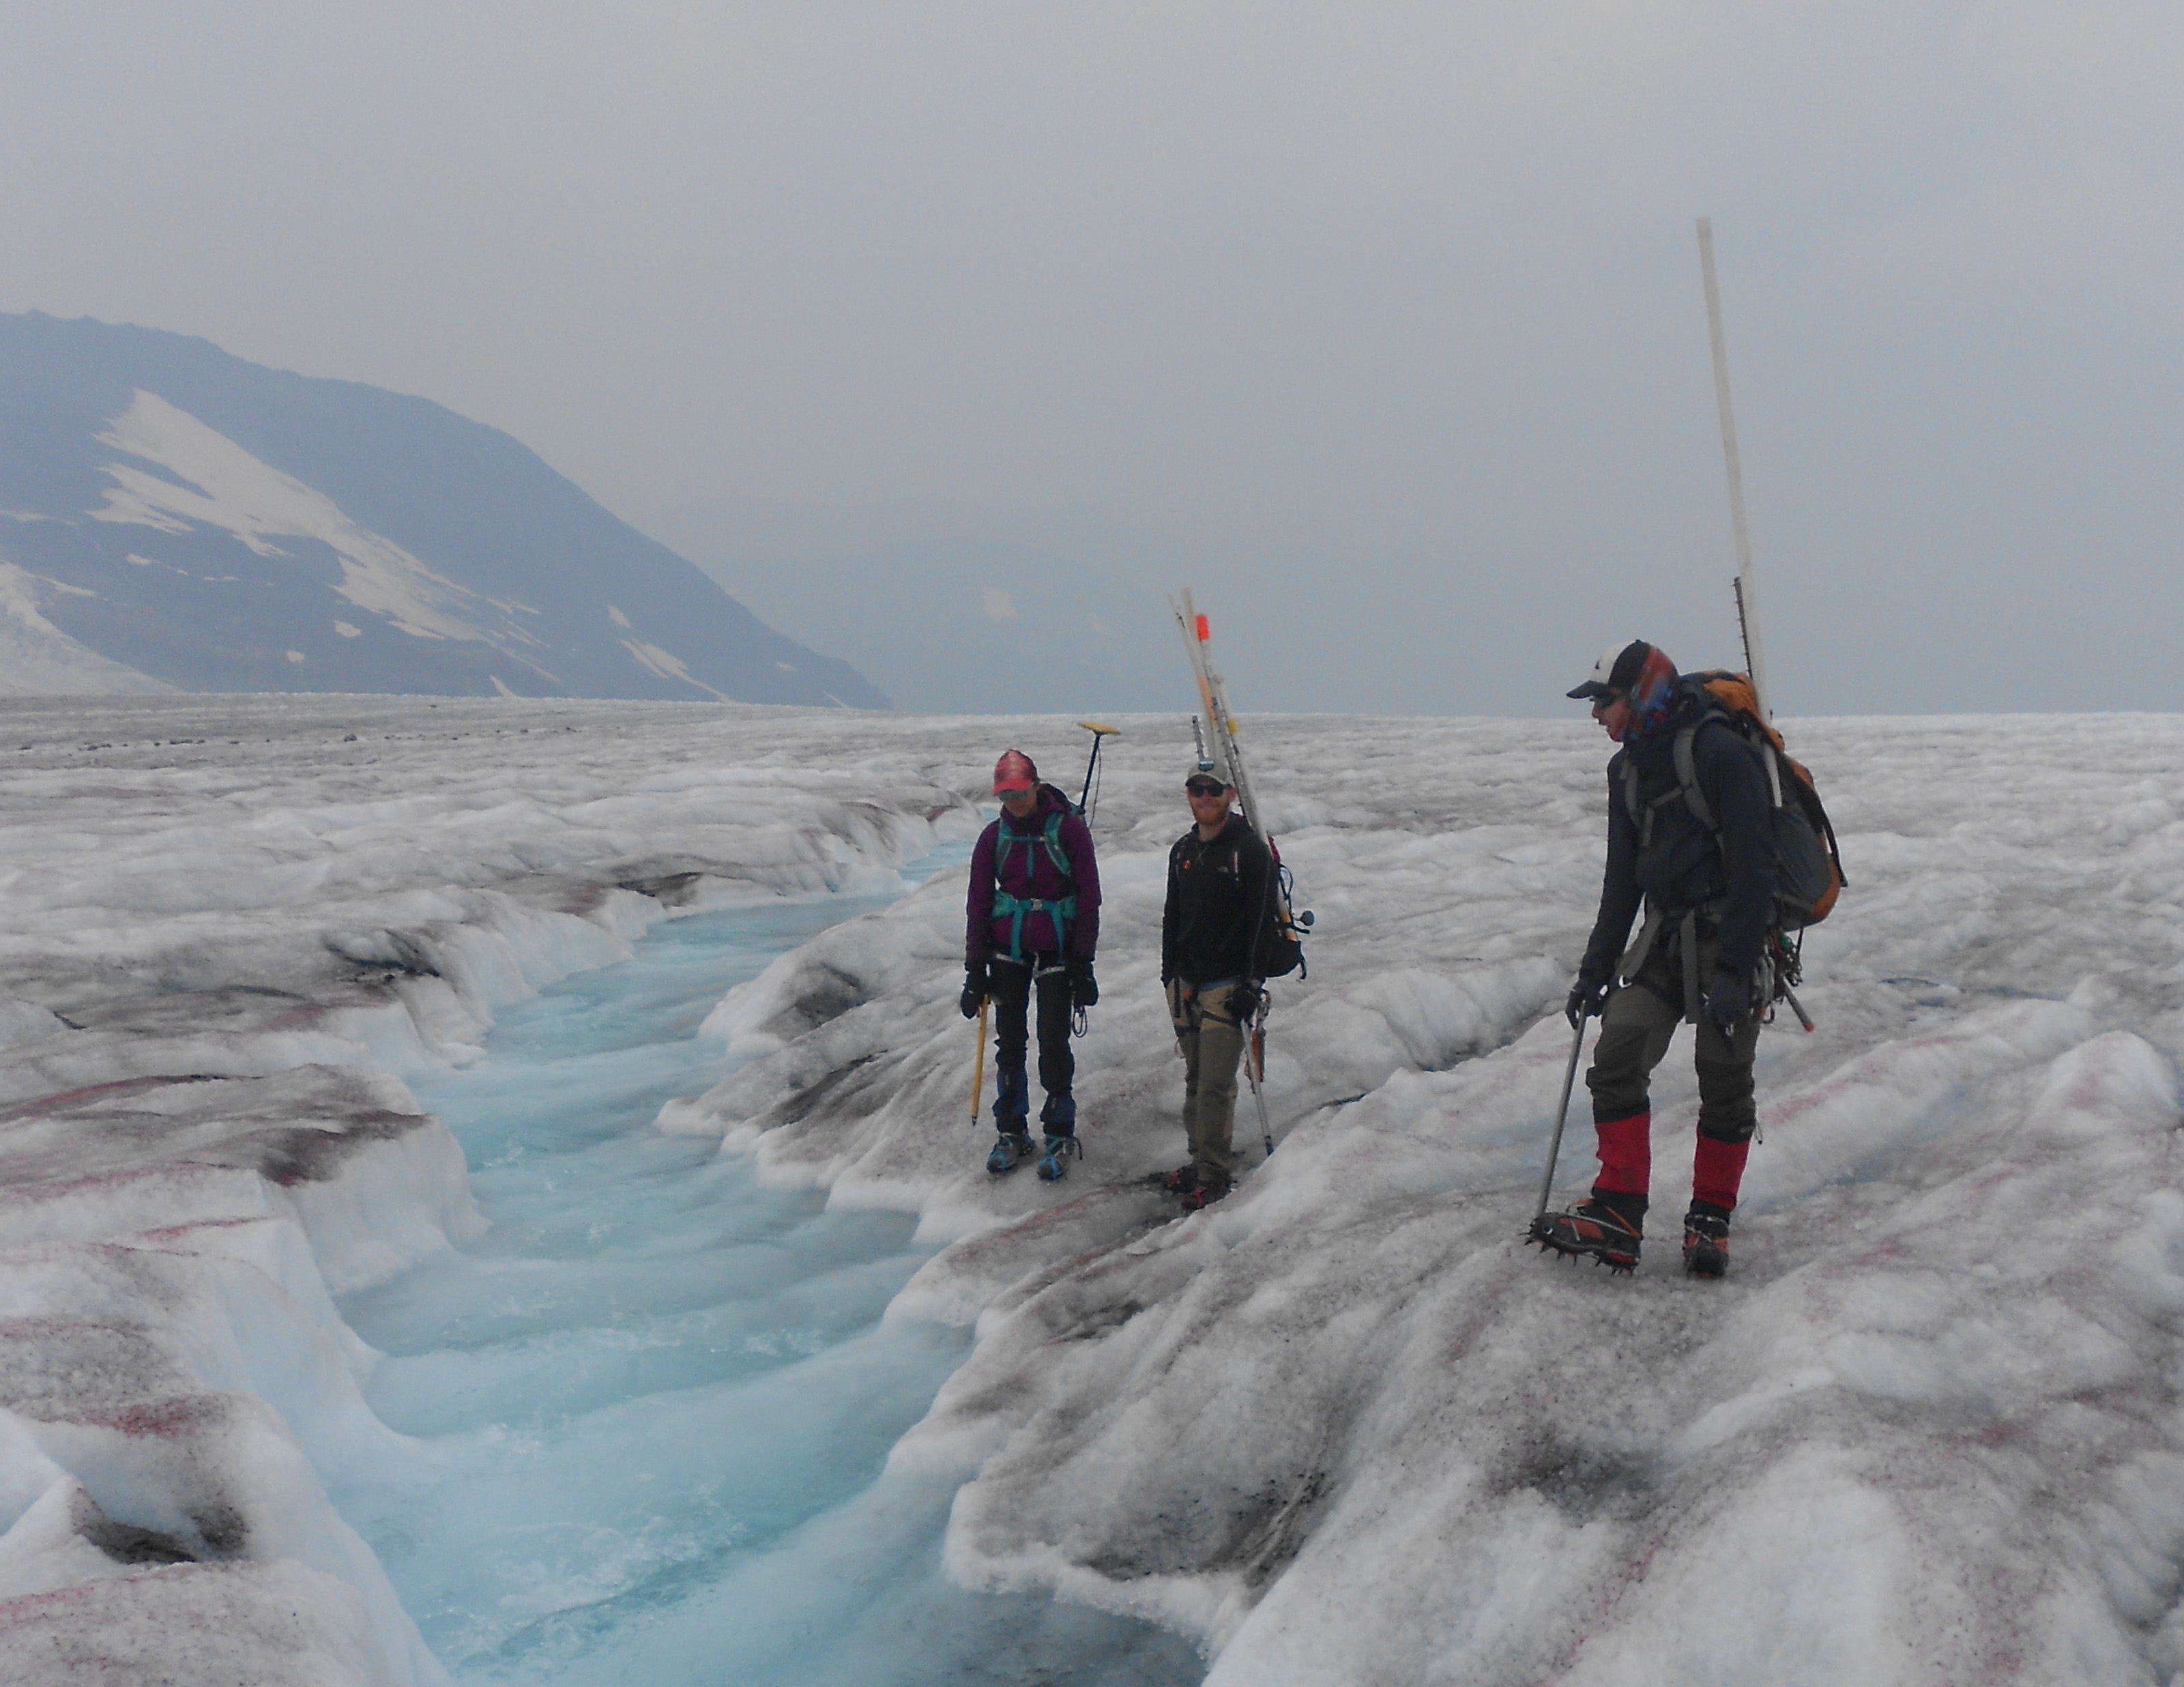
Wildfire smoke darkens the sky and ice as Alexandre Bevington, Jacob Bailey and Margot Pelto stand on the Conrad Glacier in August 2018. Photo by Ben Pelto.
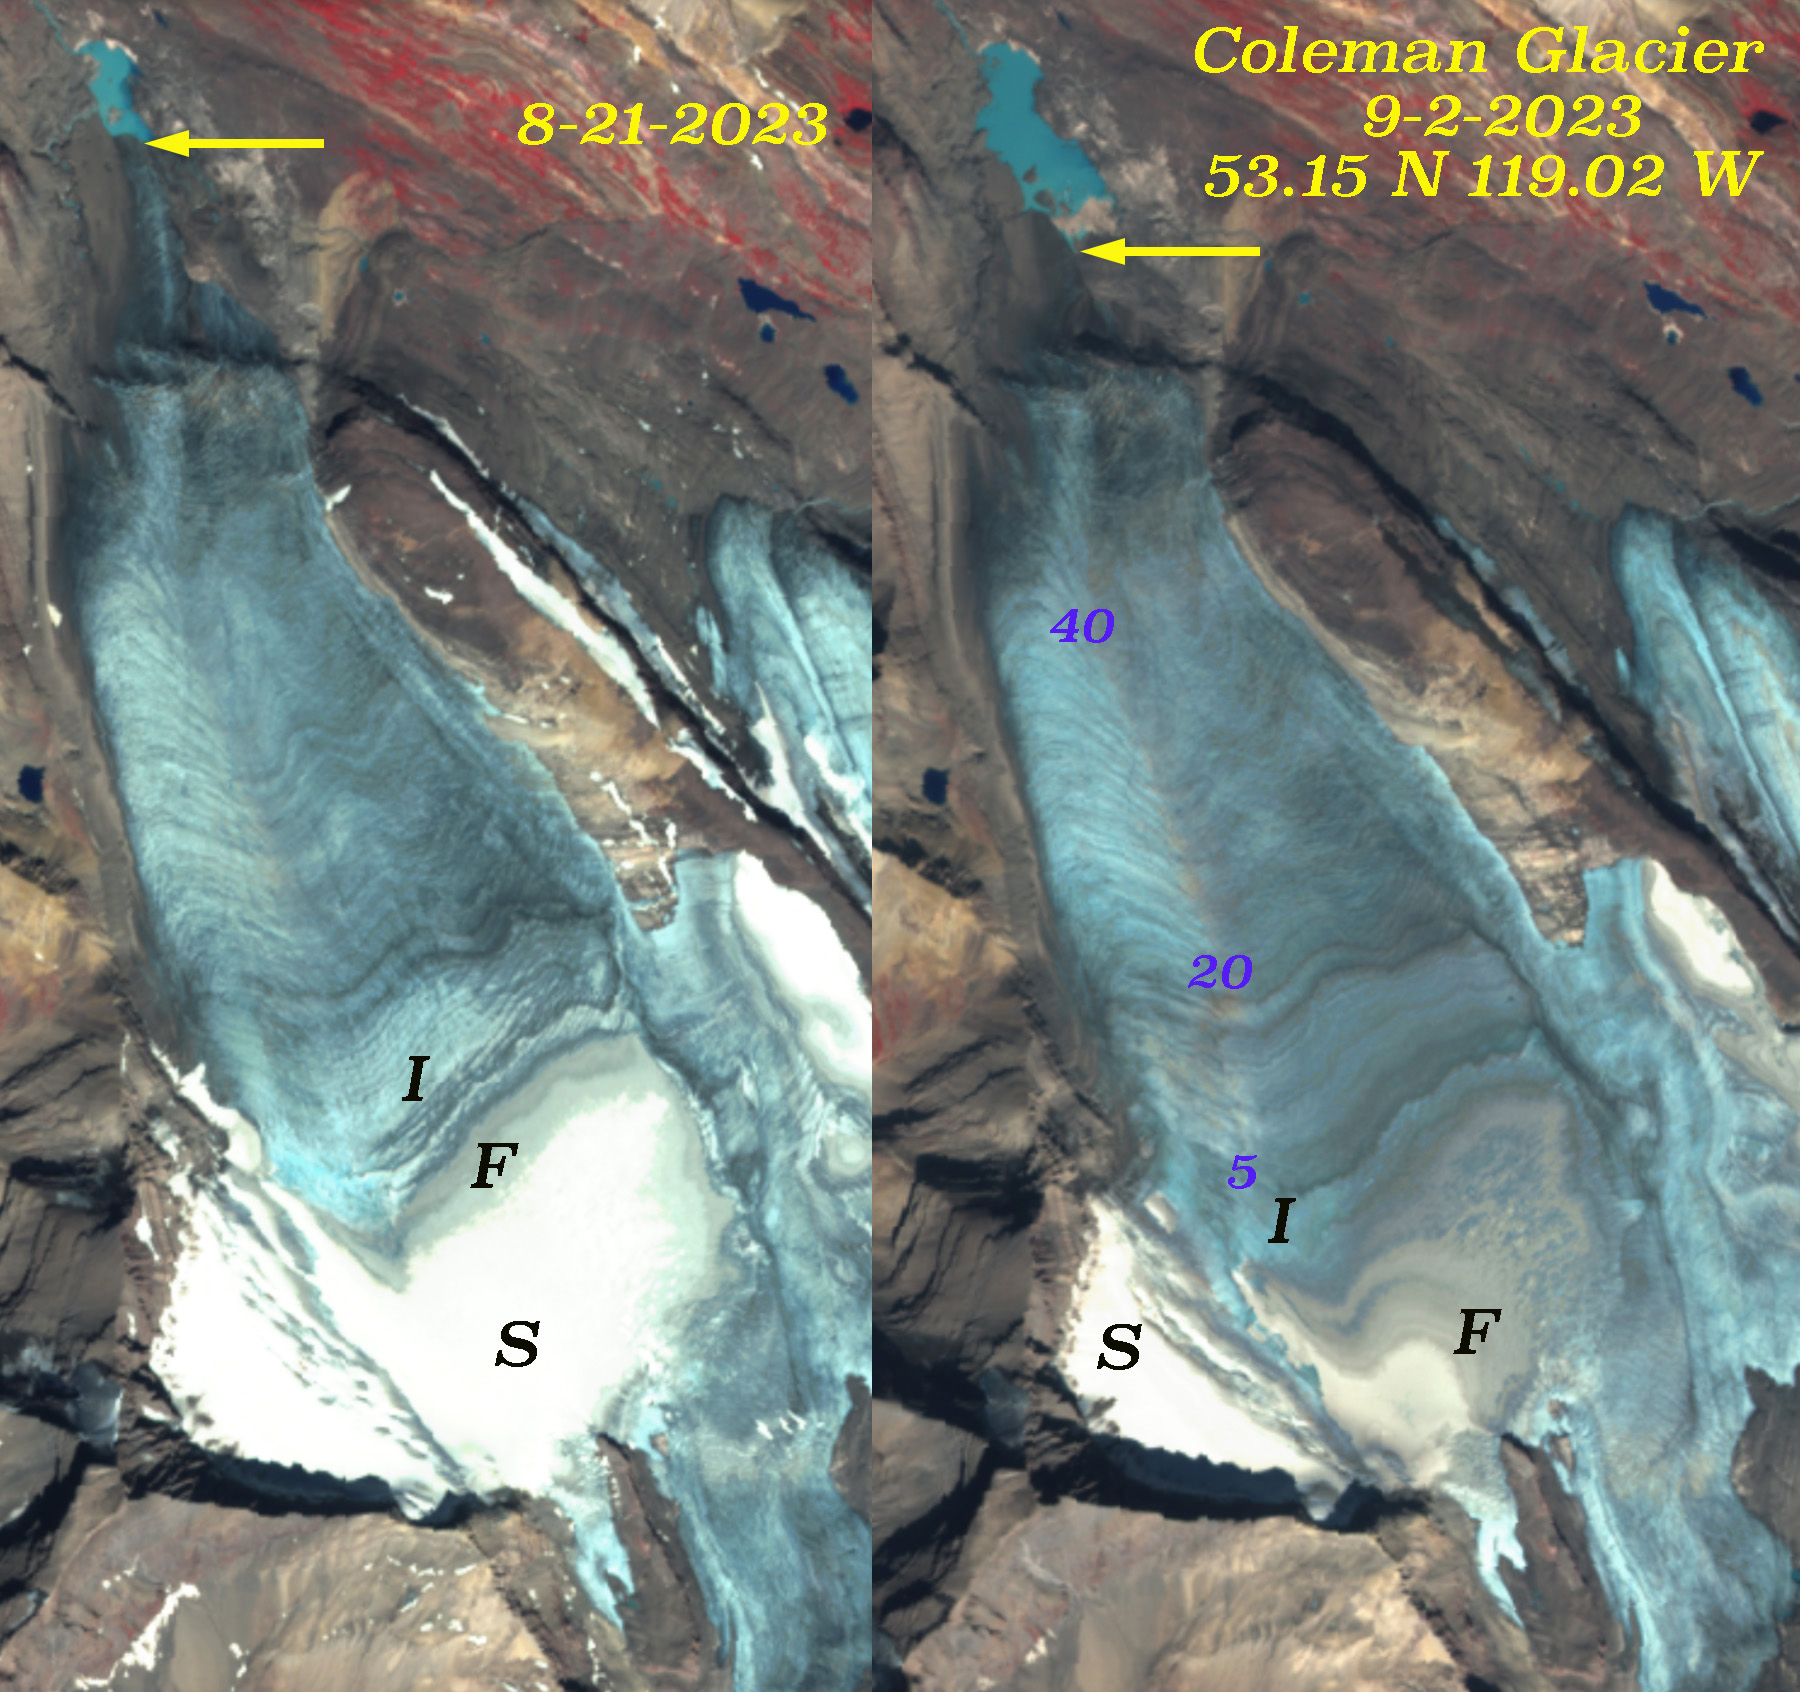
Coleman Glacier is on the east flank of Mount Robson. In 2018 the terminus is in a small lake with the snow covering 25% of the glacier. By 2023 the glacier has retreated 400 increasing the lake size. The snowcovered area is less than 10% of the entire glacier and is restricted to regions above 2500 m.
The above images of snow free and nearly snow free glaciers is a sight that has until the last decade been very rare. It is now becoming a typical event. The glacier response has been rapid, profoundly changing most and leading to the end of some.
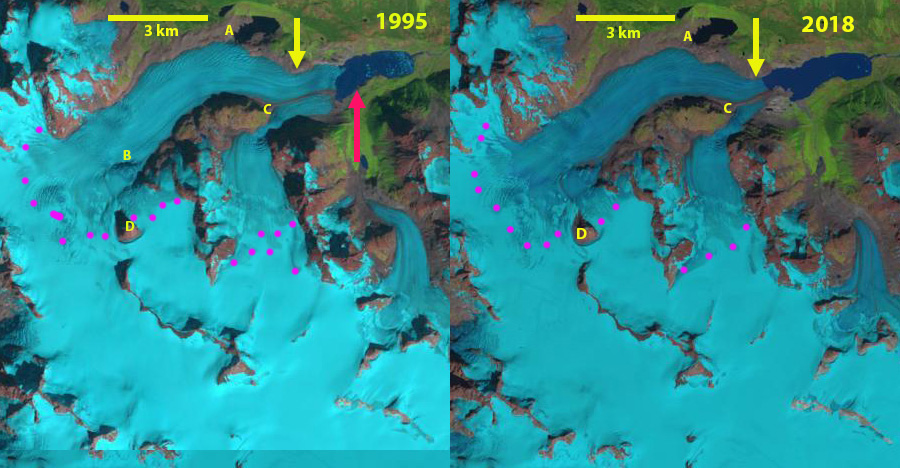
Jacobsen Glacier in Landsat images from 1987 and 2019. Red arrow 1987 terminus location, yellow arrow 2022 terminus location and purple dots the snowline. Point A indciates ice marginal lake in 1987, Point C is the glacier junction, Point B an emerging rock rib and Point D a nunatak.
Jacobsen Glacier is a large outlet glacier flowing from the Monarch Icefield in the Pacific Ranges of the British Columbia Coast Mountains. The glacier has sustained significant ongoing retreat and down wasting since achieving its Holocene maximum during the Little Ice Age (LIA) (Desloges and Ryder, 1990, Harvey and Smith 2013). The retreat and thinning of Jacobsen Glacier revealed a dendroglaciological samples that help identify periods of glacier advance and thickening over the last several thousand years. VanLooy and Forster (2008) noted that the glacier retreated at a rate of 30 meters/year from 1974 to 1992 and 47 meters/year from 1992-2000. Menounos et al (2018) identified a mass loss for glaciers in this region of ~0.5 m year from 2000-2018 which is driving retreat.
Meltwater from Jacobsen Glacier flows northward into Jacobsen Creek, which drains into the Talchako River to eventually join the Adnarko River to form the Bella Coola River. The Bella Coola River is a key salmon producing rivers on the British Columbia’s central coast, supporting large chinook and chum salmon populations, surveyed at 23k and 190k in surveys during the last decade (Pacific Salmon Foundation, 2021) The sockeye and pink salmon runs have largely collapsed this century (Pacific Salmon Foundation, 2021). In this post we examine Landsat satellite imagery from 1987-2022 to illustrate recent changes and field images from University of Victoria expeditions, provided by Dan Smith, in 2002 and 2010.
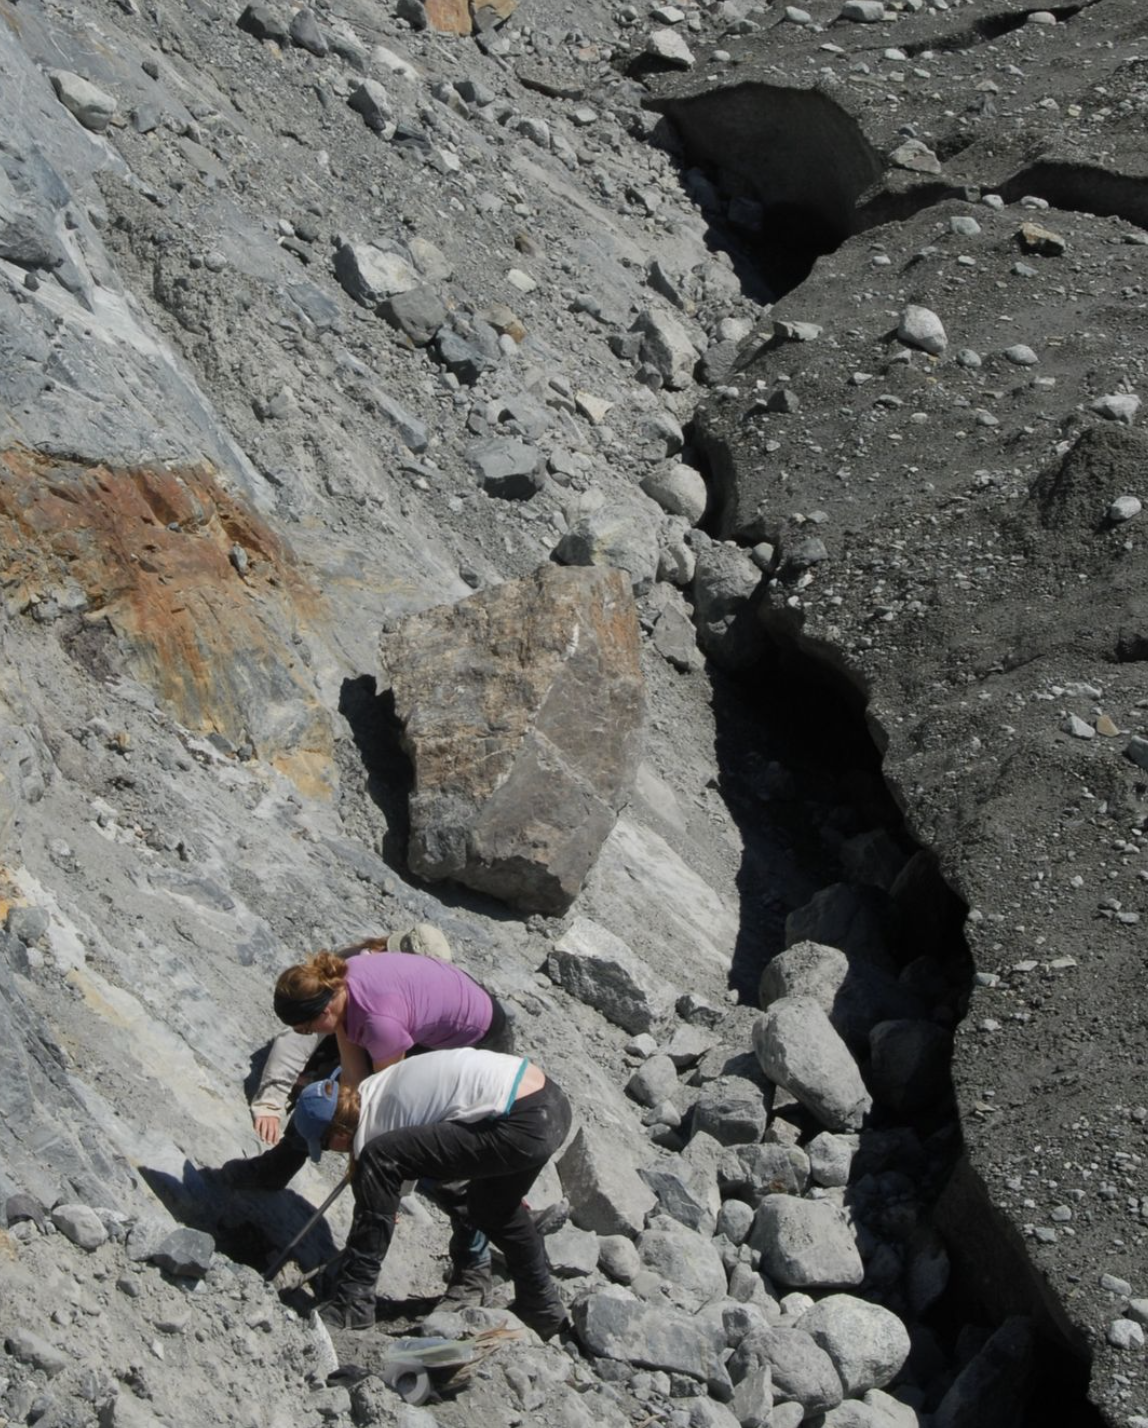
The historical terminal retreat and thinning of Jacobsen Glacier led to exposure of the remains of trees overwhelmed and buried by mid-Holocene glacier advances. Expeditions to the site in 2010 provided the opportunity collect samples of these remains for tree-ring analysis and radiocarbon dating. Lichenometric measurements in 2002 and 2010 were used to date the LIA moraine building episodes and to provide a record of the rates of deglaciation. Moraine building intervals were identified prior to 1280–1320 and 1490–1530 AD and describe early-LIA advances; whereas advances prior to 1680–1720 and 1820–1870 AD describe the results of late-LIA advances (Harvey et al 2012).
In 1987 Jacobsen Glacier terminated in a 1.8 km long proglacial lake at an altitude of ~1080 m . The north margin had a separate terminus in the proglacial lake at Point A. The terminus in the main proglacial lake was 900 m wide. At Point B there was an icefall, but no exposed bedrock. The snowline at this time was at 2050 m. By 1995 the glacier had retreated 500 m up valley. The glacier remained in contact with the proglacial lake at Point A and the snowline was at 2100 m. Due to thinning by 2000 the glacier had retreated from the proglacial lake at Point A and in 2016 the snowline was at 2150 m. By this time the glacier was separated from the proglacial lake at Point A by ~500 m and the southern tributary no longer reached the expanding proglacial lake. By 2018 bedrock was exposed at Point B and the snowline was at 2100 m.
The retreat and downwasting at Jacobsen Glacier continues at the present time. In 2022 the proglacial lake had expanded to a length of 3.6 km, a total retreat distance of 1800 m from 1987-2022. Lake area is 2.8km² in 2022, with the glacier calving front being 500 m long. The rate of terminal from 1987-2022 amounted to ~50 m/year, only a slightly change rate reported from 1990-2000 reported rate. In 2022, the local snowline was found at 2050 m. The reduced calving front length and likely lake water depth will reduce calving losses, surface mass balance losses will be the key driver of ongoing retreat. In 2010 the University of Victoria expeditions had noted the glacier had retreated to a point where it was smaller than it had been in 6000 years, exposing buried trees. Since then the retreat has continued likely exposing a few more buried treasures to be examined.
Jacobsen Glacier in Landsat images from 1995 and 2018. Red arrow 1987 terminus location, yellow arrow 2019 terminus location and purple dots the snowline. Point A indciates ice marginal lake in 1987, Point C is the glacier junction, Point B an emerging rock rib and Point D a nunatak.
Jacobsen Glacier in Landsat images from 2000 and 2016. Red arrow 1987 terminus location, yellow arrow 2019 terminus location and purple dots the snowline. Point A indicates ice marginal lake in 1987, Point C is the glacier junction, Point B an emerging rock rib and Point D a nunatak.
Recently deglaciated bedrock outcrops beside Jacobsen Glacier. Monarch Icefield area, Pacific Ranges, British Columbia Coast Mountains. (July 18, 2010)
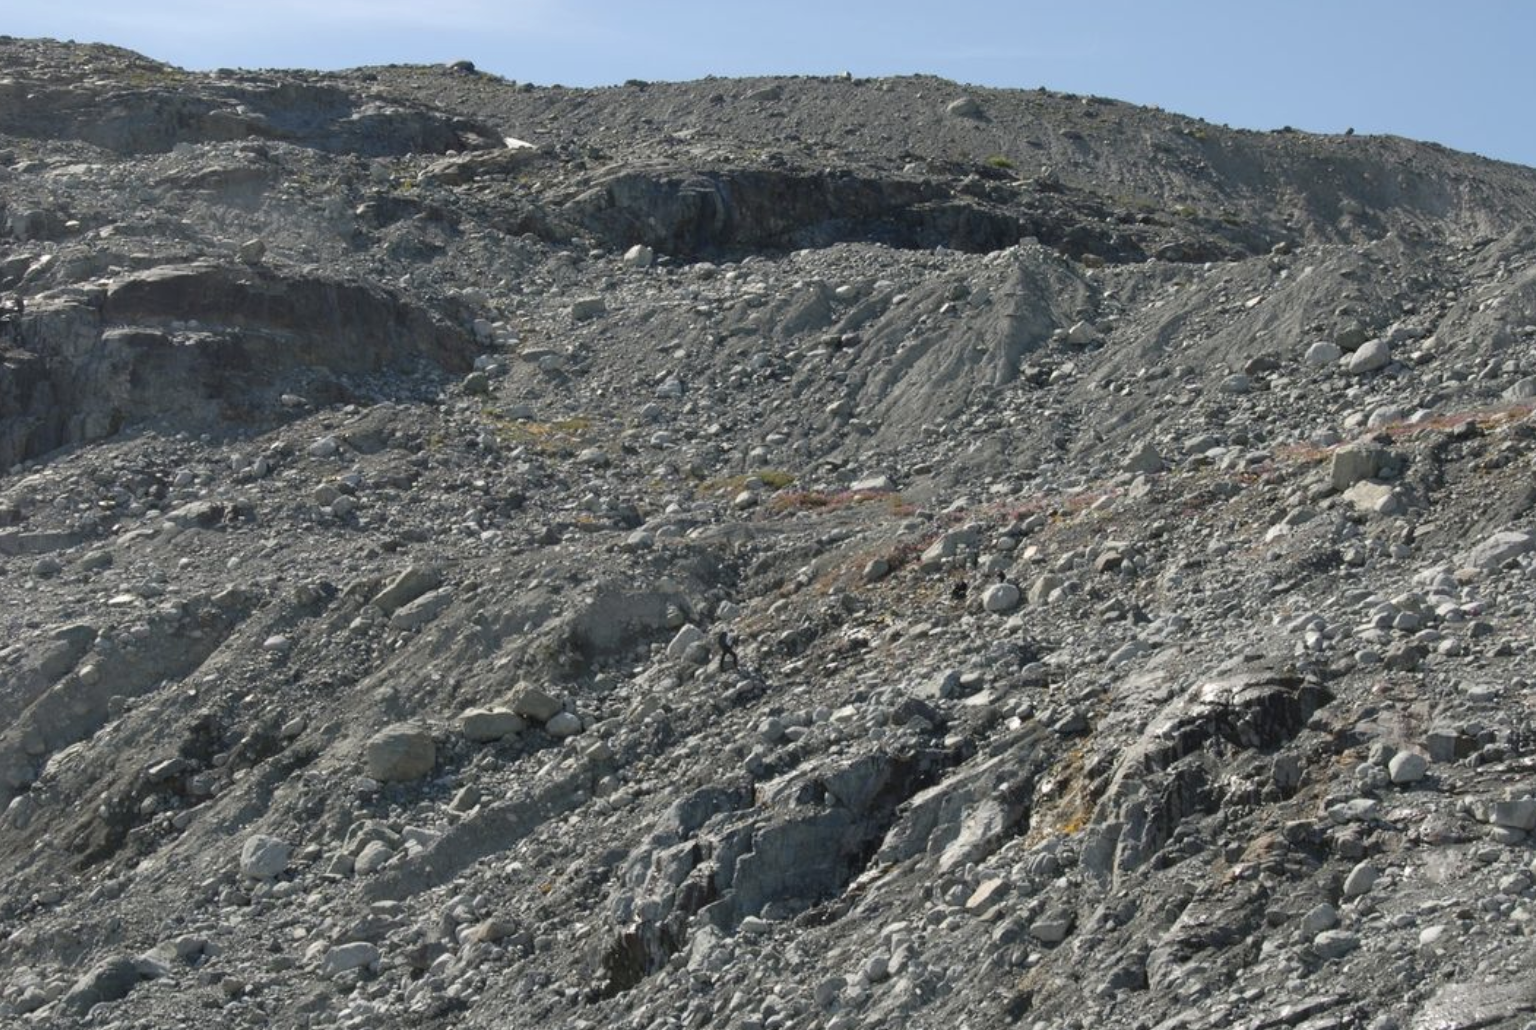
The lateral moraines at Jacobsen Glacier are big, complex and, in places, are partially eroded. For scale, there are at least three UVTRL team members in this photograph. Can you find them? (July 17, 2010)
A dendroglaciological treasure located above Jacobsen Glacier. UVTRL Team member points to the detrital remains of a masticated tree stem plastered onto the moraine slope. One of many pieces of subfossil wood found in the general area, it proved to be the remains of a tree killed when the glacier was expanding up this slope 6500 years ago (July 17, 2010)
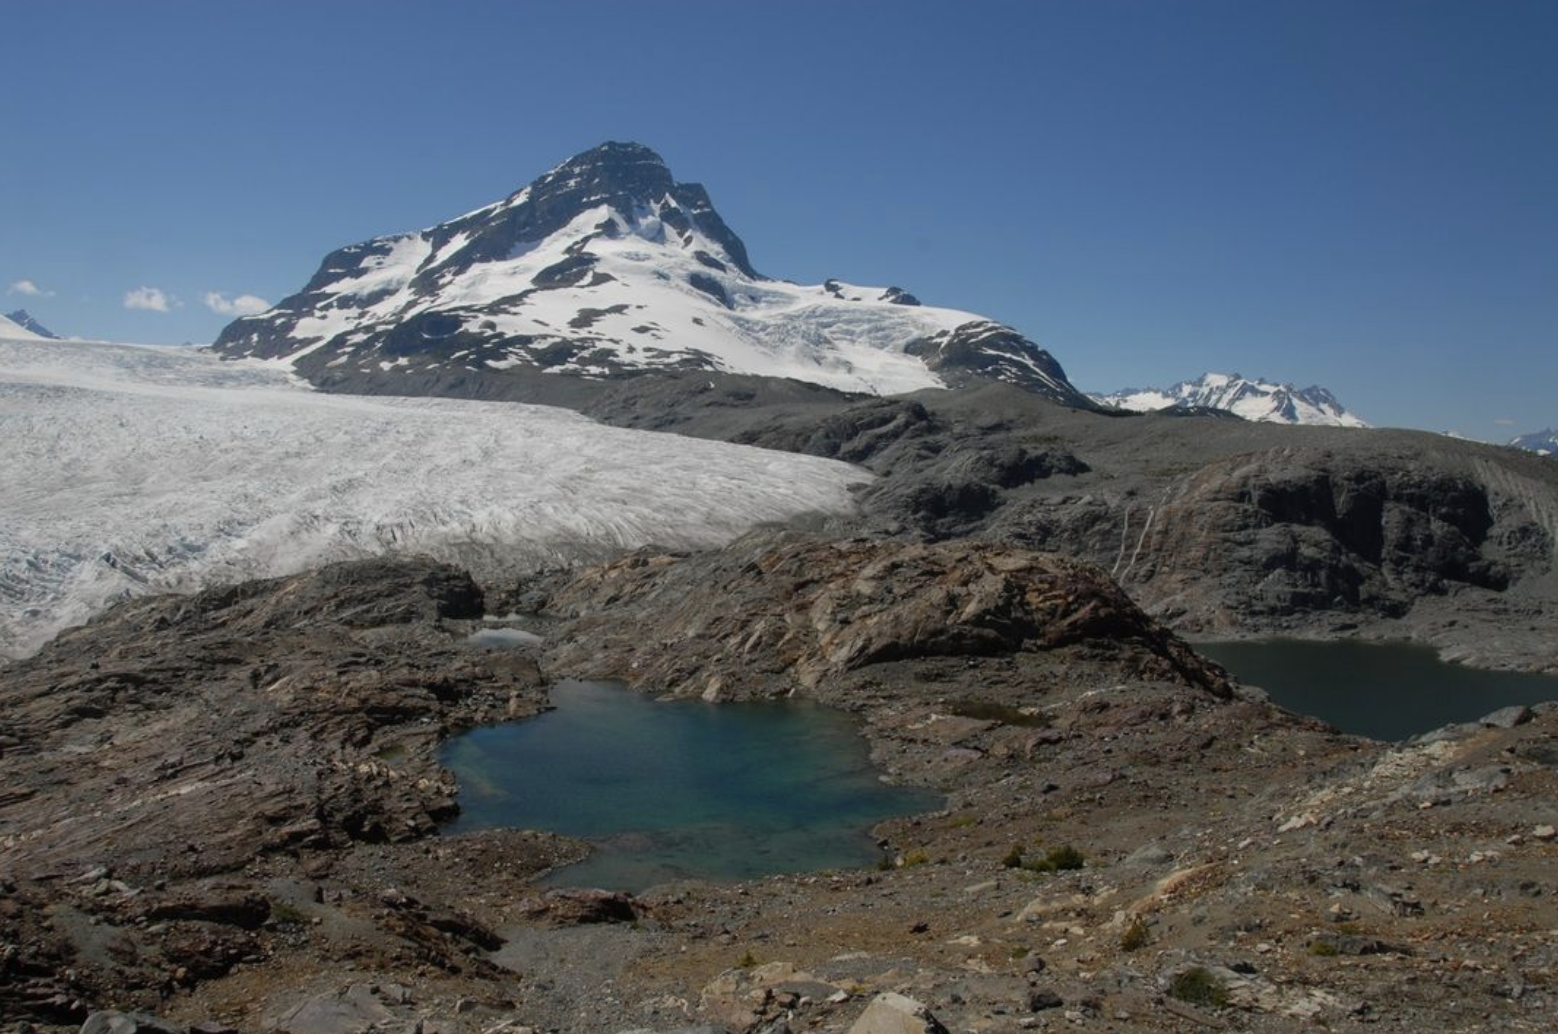
Jacobsen Glaciers western margin in 2010. Field team is resting on the recently deglaciated terrain in the lower left (July 17, 2010).
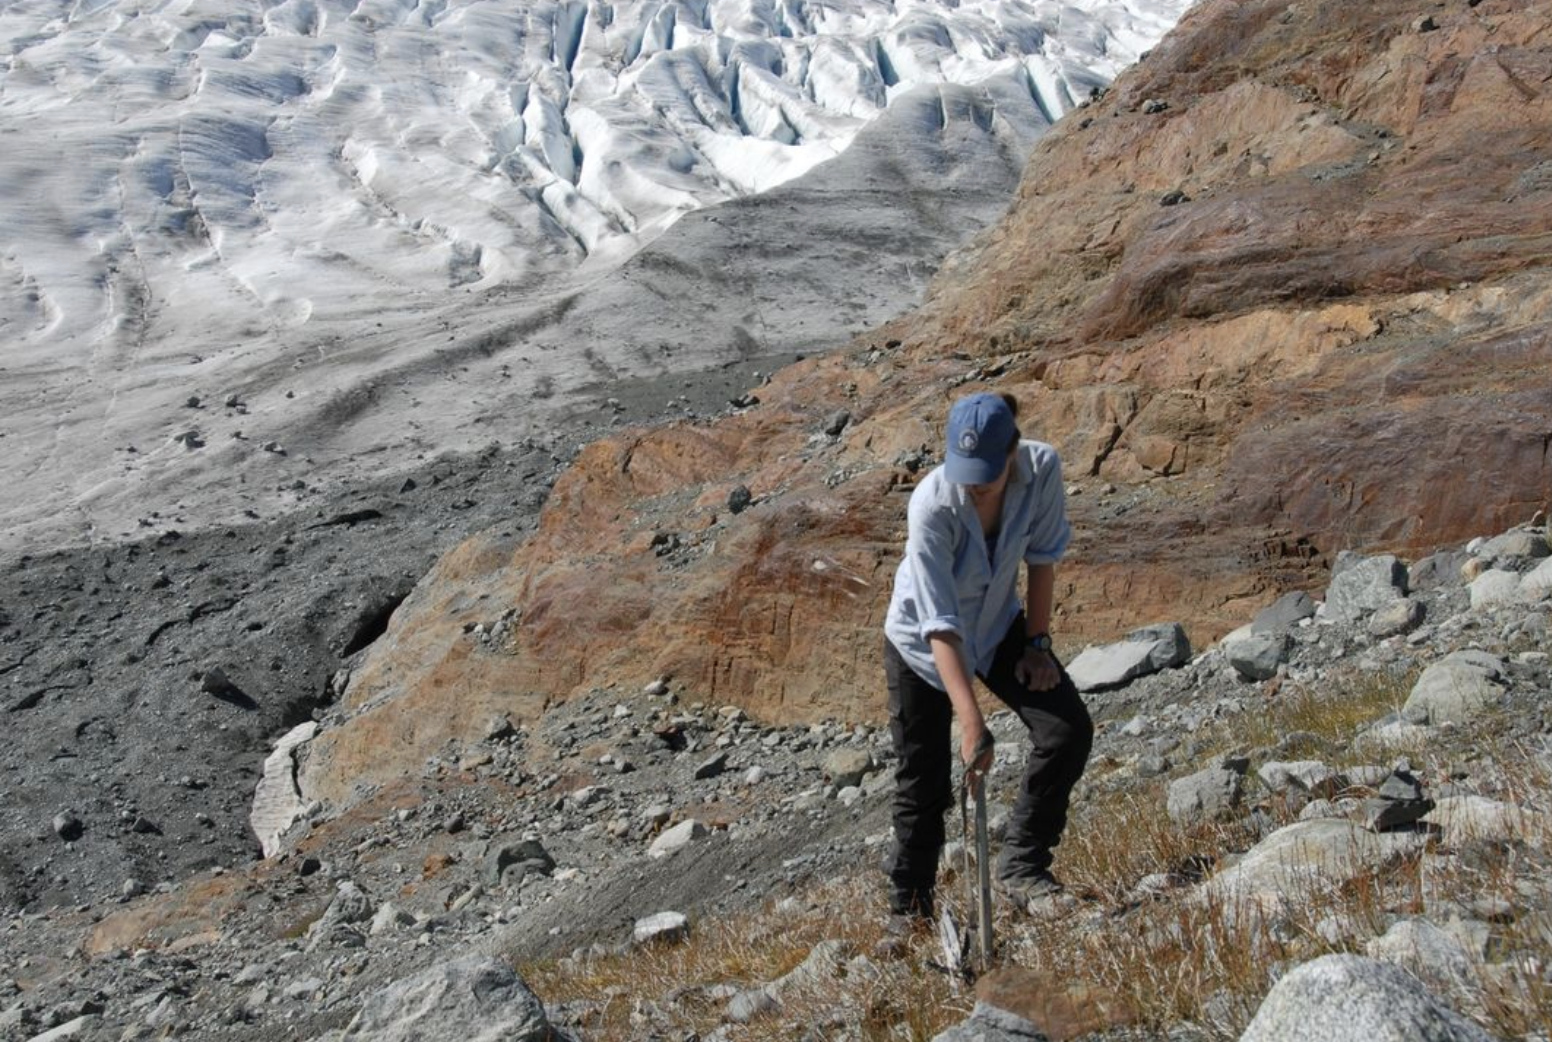
The diggers are excavating a rooted and sheared stump in growth position. Radiocarbon dating indicate the tree was killed as Jacobsen Glacier expanded some 6500 years ago. While the glacier unquestionably waxed and waned over those six millennia, this is the first time that it has shrunk to its contemporary size. (July 17, 2010)
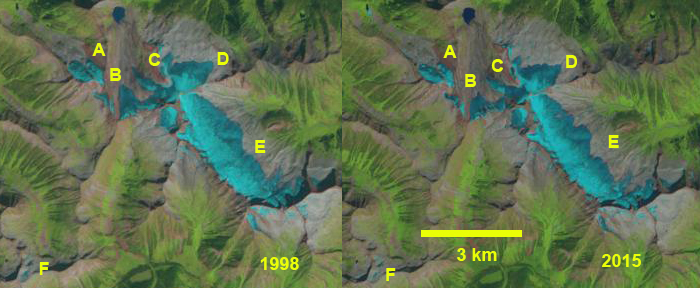
The glaciers of Tenderfoot Mountain in 1987 and 2022 Landsat images illustrating the decline in area and fragmentation. Tenderfoot Glacier B-C has lost more than 70% of its area and fragmented. Glacier D and E have experienced recession along their broad lower margins. Glacier F has disappeared
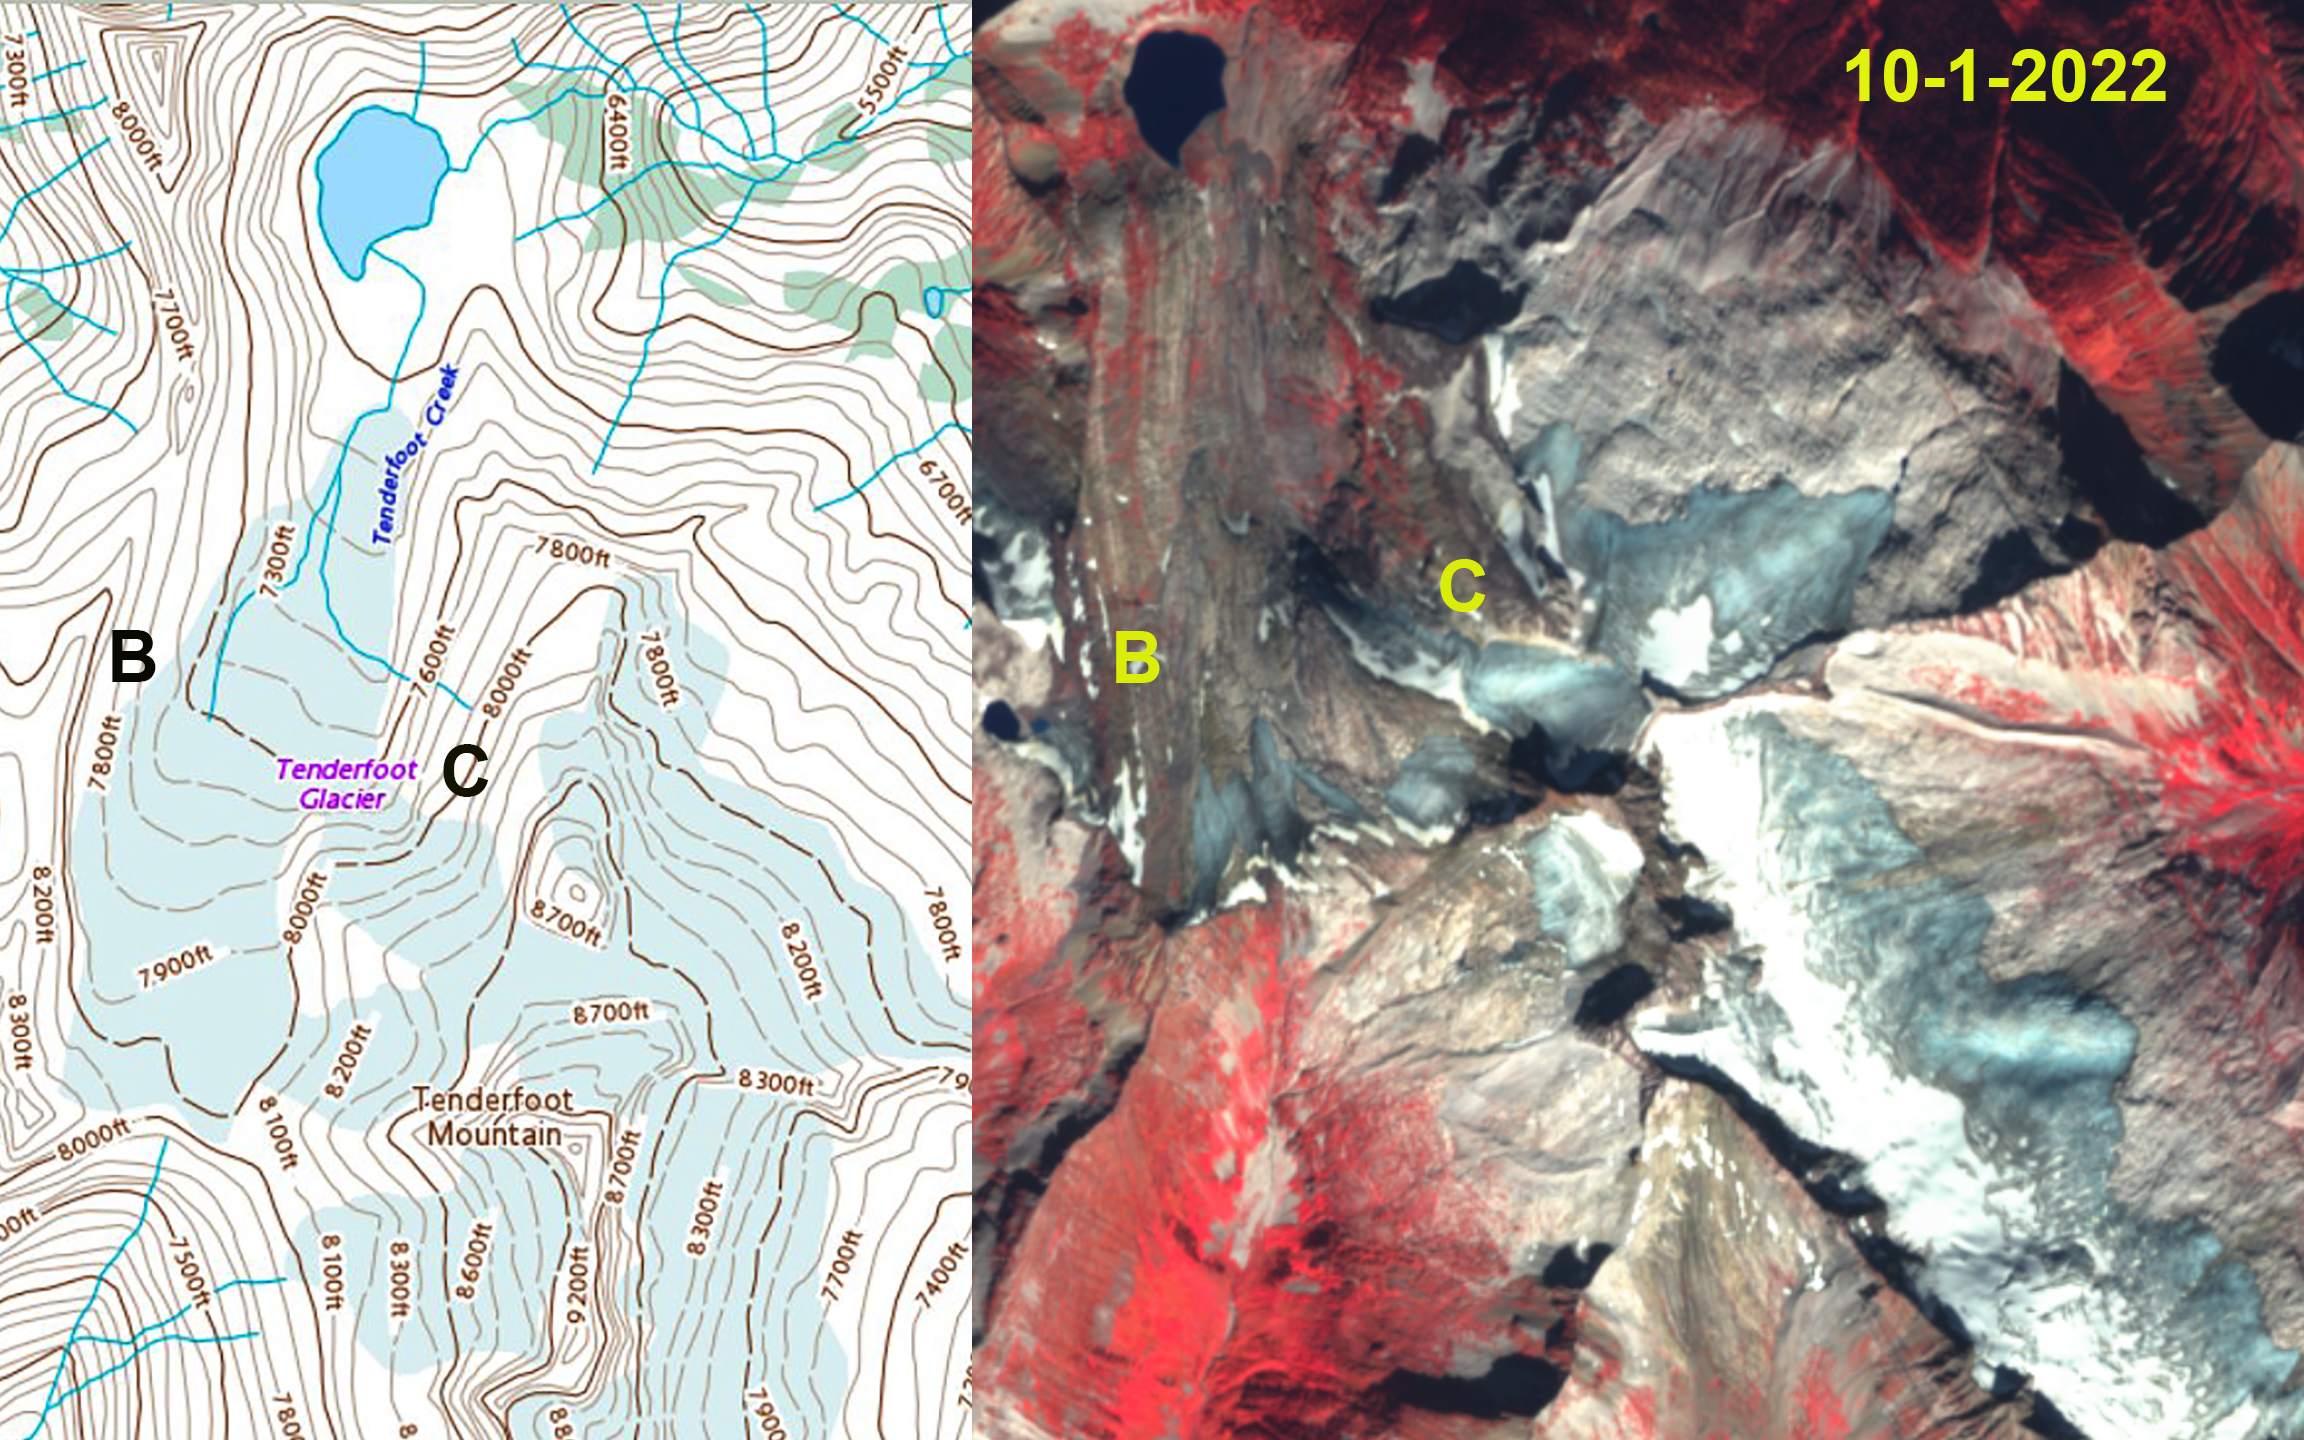
Tenderfoot Mountain has an array of glaciers on its flanks that have been rapidly losing area and fragmenting. One of these is Tenderfoot Glacier (B-C) that feeds into the Lardeau River in the Kootenay Lake Watershed. The glacier filled a north facing basin with an area of km² in the 1980’s topographic map of the area. This is a region where glaciers are struggling. Bevington and Menounos (2021) inventory of glaciers in Western Canada identified an increase rate of loss in this Southern Interior Range from 6.6 km²/year during the 1984-2010 interval to 22.1 km² per year from 2011-2020. They identified for the region that 14,329 glaciers larger than 0.05 km2 existed in 1985, of these 13,270 glaciers larger than this threshold remained by 2020, this represents an 8% decline in the number of glaciers. They also identified an +300% increase in fragmentation of glaciers. Here we examine a sequence of Landsat images from 1987-2022 to illustrate the changes in the Tenderfoot Mountain region that and suppliment with a Sentinel 2022 false color satellite image.
In the National Topographic map the area of Tenderfoot Glacier had an area of 1.8 km² with the eastern tributary C feeding the main glacier (B). By 1987 the eastern Tributary (C) is nearly disconnected from Point B. There is a small cirque glacier at Point F. The glacier at Poit A is 0.6 km². In 1987 the combined area of the slope glaciers (D and E) is 5.0 km². In 1998 the Tenderfoot Glacier has not retained any snowcover illustrating why this glacier is more prone to both fragmentation and disappearing. By 2015 Point A glacier is beginning to fragment as well. By 2022 the Tenderfoot Glacier has three fragments with a combined area of 0.5 km², a 70% loss in area since 1987. The glacier at Point A has declined to 0.3 km². The glacier at Point F is gone. The combined area of Glacier D and E had declined to 3.4 km² a 30% decline. Tenderfoot Glacier did not retain any snowcover in 2021 or 2022, illustrating that it cannot survive even present climate. The Lardeau River is known Kokanee salmon . The Kokanee salmon population collapsed in Kootenay Lake after 2014 from 1 million to ~12,000 in 2017, rebounding somewhat to 90,000 in 2020 before declining again to 24,000 in fall 2021 (Nelson Daily, 2021).
Kokanee Glacier is another example of a struggling glacier in the region that Ben Pelto has monitored since 2014, too often with little snowcover by the end of summer, see below.
Tenderfoot Glacier in Canadian Topographic map and October 1, 2022 false color Sentinel image. Point B and C indicate two segments of the Tenderfoot Glacier that have now fragmented.
The glaciers of Tenderfoot Mountain in 1987 and 2022 Landsat images illustrating the decline in area and fragmentation. Tenderfoot Glacier B-C has lost more than 70% of its area and fragmented. Glacier D and E have experienced recession along their broad lower margins. Glacier F has disappeared.
Kokanee Glacier in 2021 stripped bare of snowcover, with a relatively dirty surface (Ben Pelto-image).
Icemantle Glacier in Landsat images from 2000-2022 illustrating the retreat exposing a new lake (Point A) and separation at Point D. Also the lack of snowcover in 2009, 2015 and 2022 indicative of mass balance loss that drives retreat.
Icemantle Glacier is on the north side of Greenmantle Peak just north of Snowcap Lake in the Lilloet River Basin of southwest British Columbia. Here we focus on the retreat and thinning of the glacier this century using Landsat imagery and then lack of snowcover extending into mid-October in 2022 using Sentinel images.
In 2000 the glacier extended across the basin where the new lake would soon form. The Landsat image from July 31, indicates near complete snowcover at the halfway point of themelt season. By 2009 a frining lake is evident between Point A and B. Snowcover is limited to the upper reaches above 2100 m. By 2015 the lake is evident and has numerous icebergs. Below Point B a bedrock knob is just emerging. At Point D the tributary is completing separation. In 2022 the glacier is receding from the lake basin. The bedrock knob below Point B in Landsat image and at Point A in Sentinel image has emerged. The snowline rises from 2000-2050 m in early September to 2100-2150 m by mid-October. At this point the glacier should have new snowcover, and not still be actively melting.
The lake has an area of 0.3 km2 and will not expand much more. The glacier has retreated 600 m this century and given the lack of consistent retained snowcover cannot survive current climate (Pelto, 2010). The thinning of this glacier has led to expansion and emergence of bedrock knobs at Point A-C. The retreat of this glacier fits the local pattern seen at nearby Stave Glacier. The surface darkening due to less snowcover and snowcover that has more light absorbing particles at its surfaces enhances melt. Forest fires do result in some darkening of the glacier surface (Orlove, 2020).
Icemantle Glacier in early September, when snow melt is usually largely offset by occassional new snowfall, and mid-October 2022 after a month of continue ablation reduced snowcover significantly. Notice the expansion and emergence of bedrock at Point A-C.
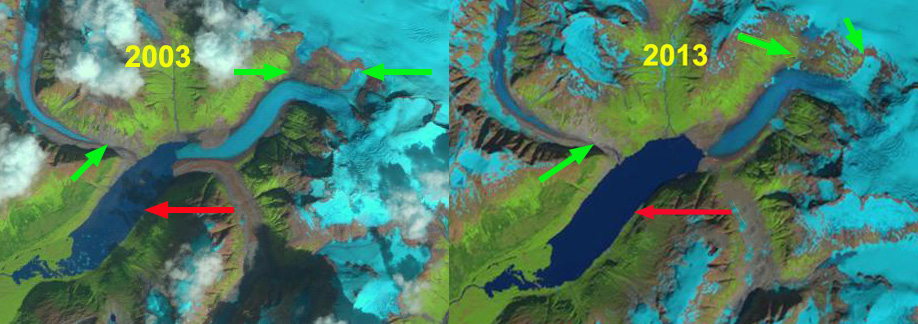
Speel Glacier in 1984 and 2022 Landsat images illustrating lake expansion and detachment of tributaries A-C. Red arrow is 1984 terminus location and yellow arrow is 2022 terminus location.
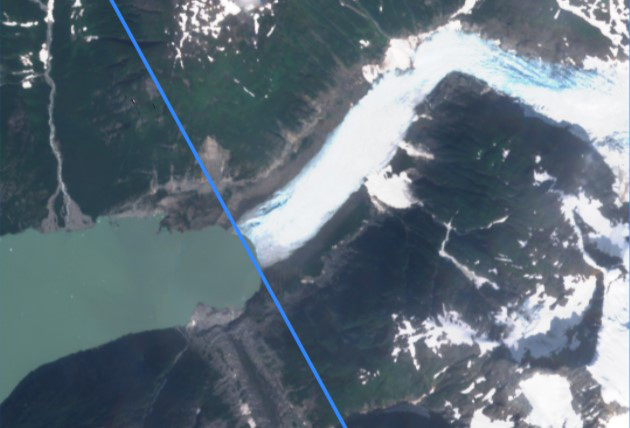
In 1984 I observed Speel Glacier while flying into Juneau, AK to work with the Juneau Icefield Research Program. Speel Glacier is south of the Taku Inlet and the Juneau Icefield draining west from a shared accumulation area with Wright Glacier. Unlike the map on my lap, there was now a big lake at the terminus of the glacier. This post examines the retreat of this glacier across the international boundary, out of Alaska, and the expansion of the unnamed lake at its terminus using Landsat images.
Speel Glacier terminus on 8-18-2022 with the Alaska/British Columbia boundary in blue.
In 1948 Speel Glacier ended at the head of a braided outwash plain, generated by the Speel River. Upglacier in 1948 there was a small side valley lake impounded by the glacier, Speel Lake. The lower part of the glacier was heavily debris covered and stagnant in 1948. I In the 1984 Landsat image the glacier had retreated 3 kilometers from the 1948 position and was fed by four separate tributaries flowing into the glacier A-D. n 1984 the original Speel Lake had drained and a new lake had formed filling the valley that the glacier had filled in 1948. The proglacial lake was 2.2 km long. By 2003 the glacier had retreated an additional 1.8 km from 1984 to where the lake bends east, and the main tributary from the north separated from the glacier prior to 1984. By 2013 tributaries A and B had been completely separated. In 2022 the glacier has retreated 6.35 km since 1948, 3.3 km since 1984 and the connection with the three of the four tribuaries had been lost A-C. The tributary detachments have led to continued retreat, have reduced input to the main glacier, which by the summer of 2022 resulted in the glacier retreating across the international boundary from Alaska into British Columbia. The new lake is now over 7 km long, and should be called Speel Lake again. The retreat of this glacier fits the pattern of other glaciers in the region Field,Gilkey, and Tulsequah Glacier (Pelto (2017). The detachments are frequent and significanly impact ice dynamics on the Juneau Icefield (Davies et al 2022). There we found 176 such detachments/disconnections in the outlet and valley glaciers of the Juneau Icefield Davies et al (2022).
Speel Glacier in 1948 USGS map.
.
Speel Glacier in 2003 and 2013 Landsat images illustrating lake expansion and detachment of tributaries A-C. Red arrow is 1984 terminus location and green arrows are detachment of tributaries.
Todd Icefield in 1987 and 2020 Landsat images illustrating retreat and separation. Red arrows indicate 1987 terminus location, Point A indicates location where the glacier has separated. Point B and C are locations of expanding bedrock high on the icefield. Point D is further glacier separation.
Todd Icefield is an icefield 30 km northeast of Stewart BC at the head of Portland Canal, with Todd Glacier being the main outlet glacier draining north to Point A and Erickson Glacier draining south near Point B. Glaciers of this icefield retreated and downwasted significantly from 1974-1997, with retreat rates of 9-76 m/year (Jackson et al 2008). Menounos et al (2019) indicate mass loss averaging -0.5 m/year from 1985-2018 in this region.
In 1987 Todd Glacier terminates in a small proglacial lake 1 km beyond a glacier junction at Point A. At Point B and C there are small bedrock outcrops. It is also worth noting that you could hike from the end of Todd Glacier on the northside across the icefield divide to the Erickson Glacier on the south side without crossing any snowcover. By 1997 Todd Glacier has retreated from the now 0.5 km long proglacial lake, with the two glacier tributaries joining just before the terminus. Again the snowline is above the Todd Icefield divide.
In 2013, 2014, 2015, 2018 and 2019 the snowline again rose above the icefield divide, leading to continued thinning even at the divide leading to increased bedrock exposure at Point B and C in 2018-2021. By 2020 Todd Glacier has retreated m since 1987 and separated from the main tributary at Point A. In 2018-2021 it is evident that Erickson Glacier is terminating in two new expanding proglacial lakes (0.2 km2) that may merge, and Todd Glacier is also now terminating in a new proglacial lake.
Retreat of Todd Glacier has been 2.4 km from 1987-2021, which is 30-40% of it entire length. The retreat is in line with that observed at nearby Bromley Glacier and Chickamin Glacier.
Todd Icefield in 1997 and 2021 Landsat images illustrating retreat and separation. Red arrows indicate 1987 terminus location, Point A indicates location where the glacier has separated. Point B and C are locations of expanding bedrock high on the icefield. Point D is further glacier separation.
Todd Icefield in 2018 and 2019 Sentinel images, note the dirty ice extends across the icefield divide in both years, yellow arrows indicate proglacial lakes developing.
Pashleth Glacier in 1987 Landsat and 2021 Sentinel image. Red arrow is 1987 terminus location, yellow arrow 2021 terminus location. Point B-D mark locations where separation has or is occurring along the main glacier and Point A on the western arm.
Pashleth Glacier, British Columbia drains into Pashleth Creek a tributary to the Machmell River, Owikeno Lake and then River Inlet on the British Columbia Coast. Here we examine the glacier retreat and fragmentation that has occurred from 1987-2022. The Machmell River is an important salmon spawning area in its lowest 20 km, particularly for sockeye, with chinook, coho, pink and chum salmon up to the cascades just downstream of junction with Pashleth Creek (Hillaby, 1998). The Rivers Inlet fjord had the third largest run in the province with annual returns of up to 3.1 million sockeye from 1948 to 1992 (Hakai, 2021). The Rivers Inlet sockeye stock has recently received much attention because of a dramatic decline in total abundance from the with an estimated 94% decline in sockeye salmon equilibrium population size (from 3,115,000 to 200,000) hitting a low of under 10,000 in 1999 (Adams et al 2021). In the 1980’s Machmell River escapement numbers averaged 20,000, dropping to 5000 in the 1990’s (Rutherford et al 1998). Harvest rates were reduced in the 1980’s and the commercial fishery closed in 1996. The commercial fishery has remained closed since 1996, with a small amount of fishing permitted by the Wuikinuxv First Nation maintain a modest food, social, and ceremonial harvest. The Rivers Inlet sockeye salmon stock has experienced limited recovery consistently exceeding ~100,00o, and averaging ~250,000 in the last two decades (Adams et al 2021). The study also examined the decline in grizzly bear population and the connection to salmon decline. They observed grizzly bear diet finding the percentage of the diet from salmon declined from ~70% pre-collapse to 23% in the 1990’s and rebounding today with fewer grizzly bears to 64%.
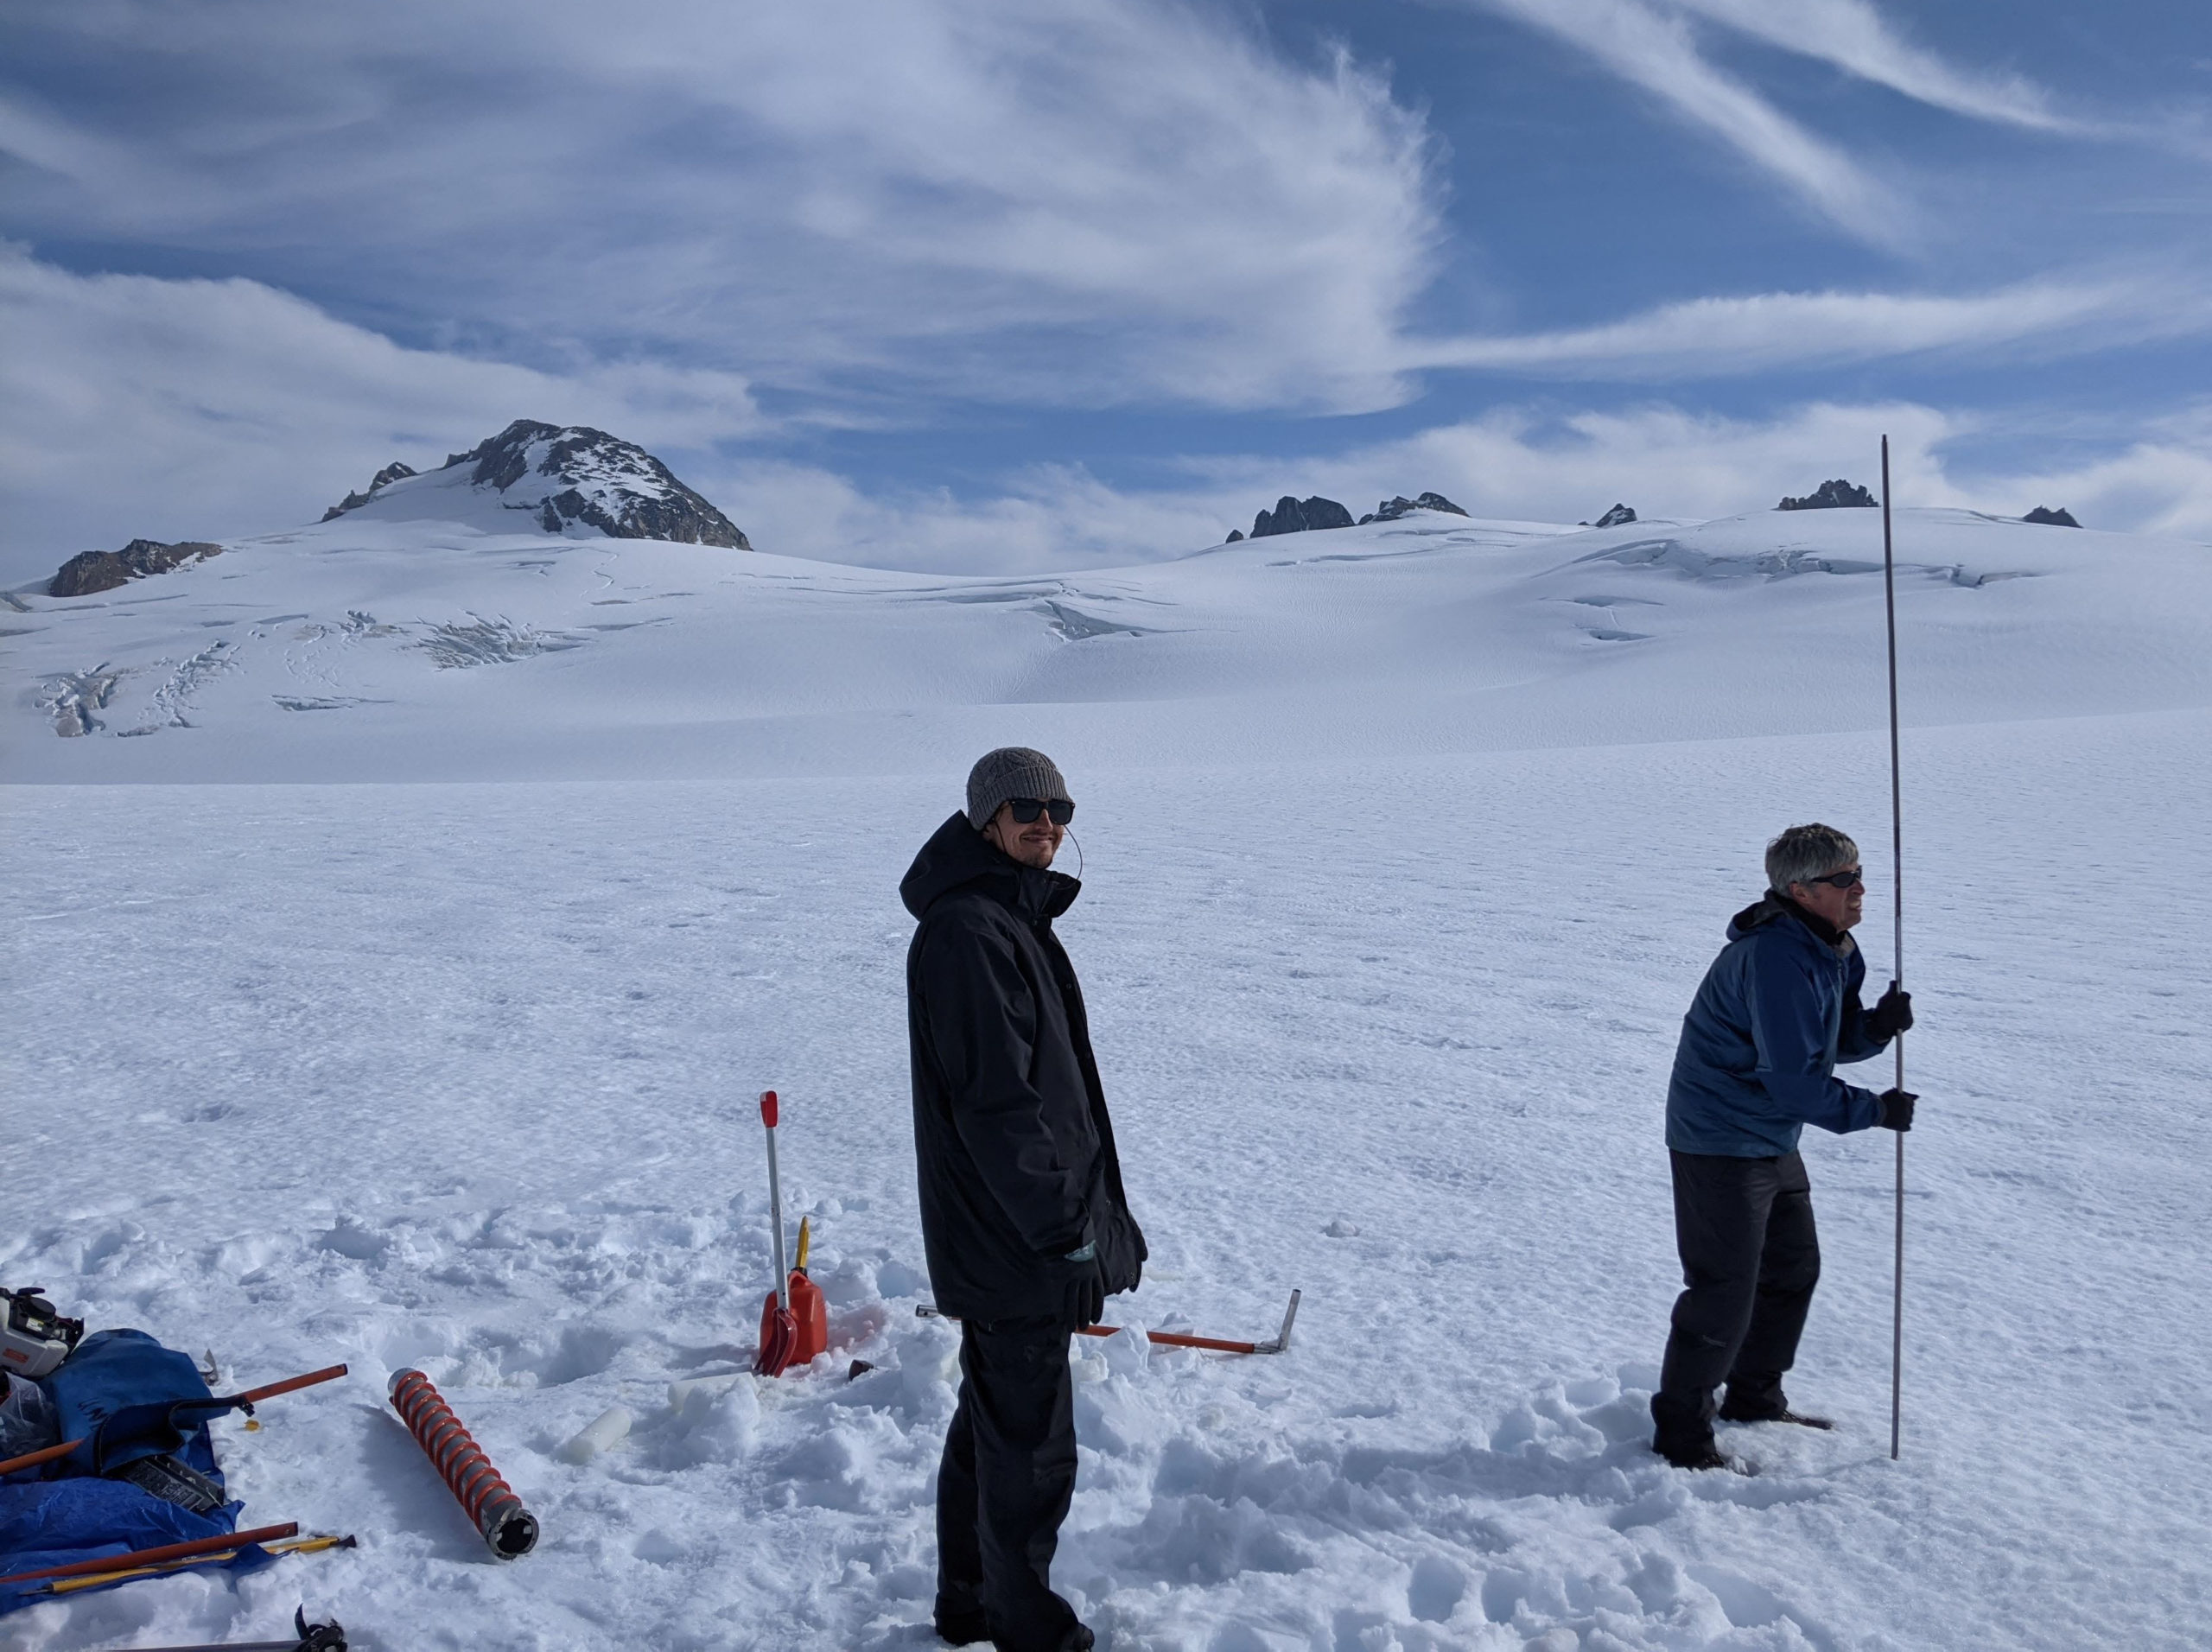
In 1987 Pashleth Glaciers main terminus was at 1000 m and the west terminus at 1100 m, with the snowline at 1700 m. By 2000 significant retreat has occurred and tributaries at Point A-D are all feeding the main glacier. The snowline is at 1800 m in 2000. In 2014 tributaries A-D are still feeding the main glacier. The snowline is at 2000 m in 2014. In 2020 Brian Menounos and Ben Pelto (UNBC) visited the accumulation area of this glacier at 2300 m and found 4.2 m of snow remaining, see below. This area has retained accumulation each and every year. In 2021 tributaries at Point A and B have separated from the main glacier, while the tributary at Point C is on the verge of separation, likely will happen in 2022. At Point D this region is developing a rock rib that indicates contribution from this small triburary is limited and will cease in the near future. The snowline in late August is at 1950 m. The main terminus has retreated 1250 m from 1987-2021 and the west arm 1700 m.
Pashleth Glacier is a large glacier that will continue to supply a large magnitude of summer glacier runoff. The challenge for the salmon will continue to be in the ocean. The neighboring Klippi Glacier retreated 1400 m from 1987-2016, with the two main branches having separated and also feeds the Machmal River. Draining the same icefield to the south Klinaklini Glacier is also rapidly retreating (The Tyee, 2021).
Pashleth Glacier in 1987 and 2014 Landsat image Red arrow is 1987 terminus location, yellow arrow 2021 terminus location. Point B-D mark locations where separation has or is occurring along the main glacier and Point A on the western arm.
Brain Menounos, UNBC probing snowpack on the upper glacier. Searching for a potential measurement station high on the glacier (Image from Ben Pelto).
Crevasse stratigraphy indicates the depth of retained accumulation on upper glacier ( (Image from Ben Pelto)
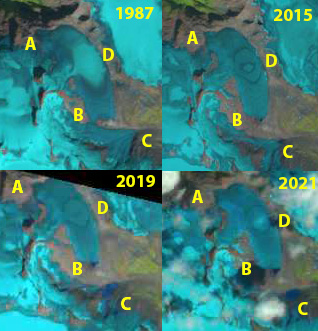
East Creek Glacier, a Braithwaite Icefield glacier in Sentinel images from 2018, 2019 and 2021 illustrating the at Point A and B where the glacier has disconnected from other glaciers of the icefield . Point C is a the terminus of one icefield outlet glacier that develops a proglacial lake. Point D is adjacent to the ice divide where ice flows both north and south from. Note the area is snow free in 2018, 2019 and 2021. The ice divide has ~12 annual layers exposed as rings.
The Braithwaite Icefield is east of Hobson Lake is in the Columbia Mountains an interior range of British Columbia. Our focus here is on a glacier at the headwaters of East Creek, “East Creek ” Glacier. This glacier has experienced changes that exemplify the recent changes of glaciers across western Canada. An extensive western Canada glacier inventory of the 1984-2020 period using optical satellite imagery noted an accelerated area loss Bevington and Menounos (2022). Specifically they quantified glacier fragmentation accelerated from 26 to 88 occurrences per year. They note that about 1141 glaciers disappeared from the inventory falling below the 0.05 km2 detection limit. The retreat also led to proglacial lake area formation accelerating from ~9 km2/year to 49 km2/year.
In 1987 East Creek Glacier accumulation zone adjacent to Point D drains north and south to separate terminus areas. In 1987 the outlet glacier that terminates at Point C is connected at Point B to the East Creek Glacier at its southern terminus. Adjacent to its northern terminus it is connected at Point A to another icefield glacier. By 2015 the glacier has separated at Point B from the outlet glacier terminating at Point C. There is not retained accumuluation at the glacier divide adjacent to Point D. This exposes a ring of ~12 annual layers preserved in glacier ice, from former annual accumulation layers that had been retained. In the ensuing summers of 2016, 2017, 2018 2019 and 2021 all of the snowpack was lost. Two proglacial lakes have formed, the area of the lake at the East Creek southern margin is 0.03 km2, the area of the lake at Point C is now 0.1 km2 .
The persistent lack of an accumulation zone indicates the glacier cannot survive (Pelto, 2010). The glacier still has an area of 2.5 km2, that will allow it to endure for several decades. Ben Pelto, and Menounos a(2021) reported that the mass balance of Zillmer Glacier, due east in the same range, had a mean negative balance of ~-0.7 m/year from 2014-2018, with an average ELA of 2465 m. The glacier had a mean altitude of 2380 m and a high elevation of 2860 m. The mean elevation of Zillmer Glacier is higher than the divide on East Creek Glacier, which along with a relatively steep mass balance gradient of 5 to 8 mm w.e. m-1, leads to the glacier maintaining an accumulation zone. The retreat is not as substantial as many glaciers in the region, note Kiwa Glacier or Franklin Glacier, but the overall changes are profound.
East Creek Glacier a Braithwaite Icefield glacier in Landsat images from 1987, 2015, 2019 and 2021 illustrate the changes. Point A and B are points where the glacier is connected to other glaciers of the icefield that separate-fragment during this period. Point C is a the terminus of one icefield outlet glacier that develops a proglacial lake. Point D is adjacent to the ice divide where ice flows both north and south from. Note the area is snow free in 2015, 2019 and 2021.
Swanson River glaciers, British Columbia in Landsat images from 1984 and 2019. EM=East Meade Glacier, CG=Canning, red arrows=1984 terminus, yellow arrow=2019 terminus, purple dots=snowline. Points 1-8 are specific glacier locations with very limited to no retained snowcover.
The Swanson River feeds into Tagish Lake in NW British Columbia. The watershed is host to dozens of glaciers. Here we exaine the retreat of the two largest glaciers in the watershed from 1984-2019, referred to as “East Meade” and “Canning Glacier” in this post. We also look at the loss of snowcover on glaciers across the watershed in 2018 and 2019. These glaciers are in the northeast sector of the Juneau Icefield, sharing a divide with the retreating Meade Glacier, Alaska. The Juneau Icefield Research Program focuses on glaciers to the south of these including the retreating Llewellyn Glacier.
In 1984 the two glacier tongues terminated at 1000 m, red arrow and the snowline was at 1350 m, purple dots. This was a year of positive glacier mass balance on the Juneau Icefield, where I was working that summer. By 1998 there has ben modest retreat and the snowline is at 1400-1450 m. The retained snowpack at the end of the summer is limited to the upper reaches of the tributary glaciers. This year was a negative balance year on the Juneau Icefield where I was busy probing snowpack.
By 2018 Canning Glacier had retreated 1400 m since 1984 and terminated at 1100 m. East Meade Glacier had retreated 1100 m since 1984 and terminated at 1100 m. In 2018 there is no retained snowpack on East Meade Glacier. There is limited snowpack at the top of some of the tributaries in wind deposition zones, but many ofthe small alpine glaciers in the area have no accumulation zone. This summer led to the highest snowline ever observed on the Taku Glacier (Pelto, 2019). In 2019 the snowlineis even higher and the glaciers of the Swanson River basin are laid bare. There is no snowpack on East Meade (1) or on the adjacent tributaries at Point 2 and 3. There is no snowpack retained on Canning Glacier (4) or on the alpine glaciers east of the Juneau Icefield at Point 6 and 8. At Point 5 and 7 each has a small patch of retained snowpack at its upper margin close below a peak.
These back to back summers are the type of conditions that lead to the loss of alpine glaciers when they become frequent enough to remove any retained snowpack not just from that year, but from previous years. The retreat of East Meade and Canning Glacier is much less than Meade Glacier, 4 km 1986-2018, and similar to Warm Creek Glacier.
.
Swanson River glaciers, British Columbia in Landsat images from 1998 and 2018. EM=East Meade Glacier, CG=Canning, red arrows=1984 terminus, yellow arrow=2019 terminus, purple dots=snowline.
Canadian Topographic map of the area EM=East Meade Glacier, CG=Canning Glacier and TL=Tagish Lake
Landsat images of Tulsequah Glacier on June 22 and July 5, 2021. Lake No Lake is between the yellow arrows with the margin of glacier extending upvally on June 22nd. By July it has receded back to main valley and lake has largely drained. The former location of Tulsequah glacier dammed lake is at red arrow.
Tulsequah Glacier, British Columbia drains east from the Juneau Icefield and is best known for its Jökulhlaups or glacier lake outburst floods (GLOF) from Tulsequah Lake and Lake No Lake dammed by Tulsequah Glacier in northwestern British Columbia, Canada (Neal, 2007). The floods pose a hazard to the Tulsequah Chief mining further downstream. This glacier feeds the Taku River which has seen a significant decline in salmon in the last decade (Juneau Empire, 2017).The continued retreat of the main glacier at a faster rate than its subsidiary glaciers raises the potential for an additional glacier dammed lakes to form. The main terminus has disintegrated in a proglacial lake. Pelto (2017) noted that by 2017 the terminus has retreated 2900 m since 1984, with a new 3 km long proglacial occupying the former glacier terminus. The USGS has a stream gage measuring a range of parameters including turbidity and discharge which can identify a GLOF. Neal (2007) examined the 1988-2004 period identifying 41 outburst floods from 1987-2004. Here we examine Landsat images and USGS records of Taku River to quantify the 2021 GLOF event between June 25 and July 3.
USGS records of turbidity and discharge on Taku River that indicate the onset on glacial lake drainage and of the GLOF event on July 3, note purple arrows.
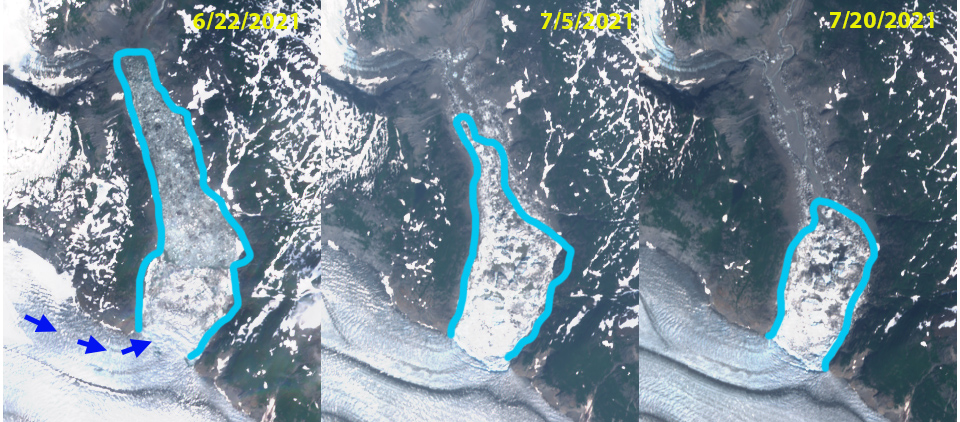
On June 22, 2021 the region between the yellow arrows is an iceberg choked lake. The red arrow indicates the location where Tulsequah Lake used to expand, it is limited. The terminus of the glacier reaching upvalley 600 m from the main glacier. Discharge is at 60,000 cfs and the turbidity is at ~100 FNU. Starting on the June 25th through the 27th turbidity rises to 400 FNU, while discharge rises to 90,000 cfs. This is during a protracted dry period and is the result of the beginning of increased glacier discharge from the lake. On July 27th-June 30th it is evident that the margin of the distributary glacier tongue has receded ~500 m back to the main glacier margin, representing a terminus collapse generating icebergs likely resulting from a fall in water level. There is no change in the small Tulsequah Lake at the red arrow. On July 3rd turbidity rises above 500 FNU and discharge exceeds 130,000 cfs, this is at the high end of the typical peak GLOF events from Lake No Lake as noted by Neal (2007) from 90,000-130,000 cfs. This is the main event and was reported by the USGS. By July 5 Landsat imagery indicates the water level has dropped between the yellow arrows, resulting in more prominent icebergs. The Sentinel image illustrates the zone of iceberg stranding as well. The icebergs continue to melt away by July 20. No change at the red arrow. If we look back to Sept. 2020 we see what Lake No Lake will appear like by the end of summer and that the distributary terminus margin does not extend upvalley at that time. The large proglacial lake that has formed after 1984 due to retreat helps spread out the discharge from ice dammed lake GLOF’s of Tulsequah Glacier. This lake will continue to expand and the damming ability of the glacier will continue to decline, which will eventually lead to less of a GLOF threat from Lake No Lake.
Sentinel images from June 22, July 5 and July 20 of the area of the lake and then the area of stranded icebergs. Note how almost the entire width of a the northern tributary flows into this valley.
Landsat images of Tulsequah Glacier on June 27 and June 30. Lake No Lake is between the yellow arrows. The former location of Tulsequah glacier dammed lake is at red arrow. Tulsequah Glacier in 1984 and 2017 Landsat images. The 1984 terminus location is noted with red arrows for the main and northern distributary tongue, southern distributary red arrow indicates lake margin. The yellow arrows indicate the 2017 glacier terminus locations. The retreat of 2900 m since 1984 led to a lake of the same size forming. Purple dots indicate the snowline.
Landsat images of Tulsequah Glacier on Sept. 15, 2020. Lake No Lake now drained fills between the yellow arrows. The former location of Tulsequah glacier dammed lake is at red arrow.
Porcupine Glacier, British Columbia in a July 4, 2021 Sentinel image illustrating the retreat from 2015-2021 and new iceberg breakup (B). Red arrow is 2015 terminus location and yellow arrows 2021 terminus locations of both branches.
Porcupine Glacier is a 20 km long outlet glacier of an icefield in the Hoodoo Mountains of Northern British Columbia that terminates in an expanding proglacial lake. During 2016 the glacier had an unusually large 1.2 km2iceberg break off (A) the iceberg is still present. NASA generated better imagery to illustrate this observation. The southern branch of the glacier has a tongue poised to breakup at that time (B). Menounos et al (2018) identified a mass loss for glaciers in this region of ~0.6 m year from 2000-2018 which is driving retreat. Here we examine the change in terminus position and iceberg deterioration from 2015-2021 using Landsat and Sentinel images.
In 2015 the glacier had retreated 3.1 km from the 1988 location (Pelto, 2016). In 2015 there are two tongues of the glacier vulnerable to calving at Point A and B. In 2016 Iceberg A has calved generating an immediate retreat of 1.7 km. In June of 2017 the iceberg size has been reduced 10-15%, with little change in position. The iceberg is plugging smaller icebergs from moving down the lake. In August 2018 the iceberg because of its size has still drifted little and at 0.6 km2 has lost half of its area in the two years. This has enabled smaller icebergs to move past the iceberg down the lake. In July of 2019 the iceberg has diminished further to 0.45 km2, but is enmeshed in a melange of other icebergs as well. The glacier has continued to retreat from 2016 to 2019 as expected, ~500 m. The glacier tongue at Point B narrowed considerably from 2015 to 2019 and is poised to separate. The narrowness and potentially shallower depth of this inlet may make it difficult for a single iceberg to emerge from the collapse of this glacier tongue. Iceberg B calved in the summer of 2020 and by July of 2021 is in four main pieces. The retreat of the main terminus from 2015-2021 is 2000 m and for the southern branch it has been 1600 m.
The retreat rate is greater than that at Dawes Glacier to the west in Alaska or Jacobsen Glacier to the south in British Columbia.
Porcupine Glacier in Landsat images from 2015 and 2020. Ice tongue A and B are indicated for 2015 and then Iceberg A and B for 2020.
Porcupine Glacier in Landsat images from 2016 and 2018 and 2019 Sentinel Image. Iceberg A and Ice tongue B are indicated on each. The haziness in 2019 is forest fire smoke. The yellow arrows mark the 2019 terminus location.