Snowcover Free Glaciers Generates Fragmenting in Central Andes, Chile

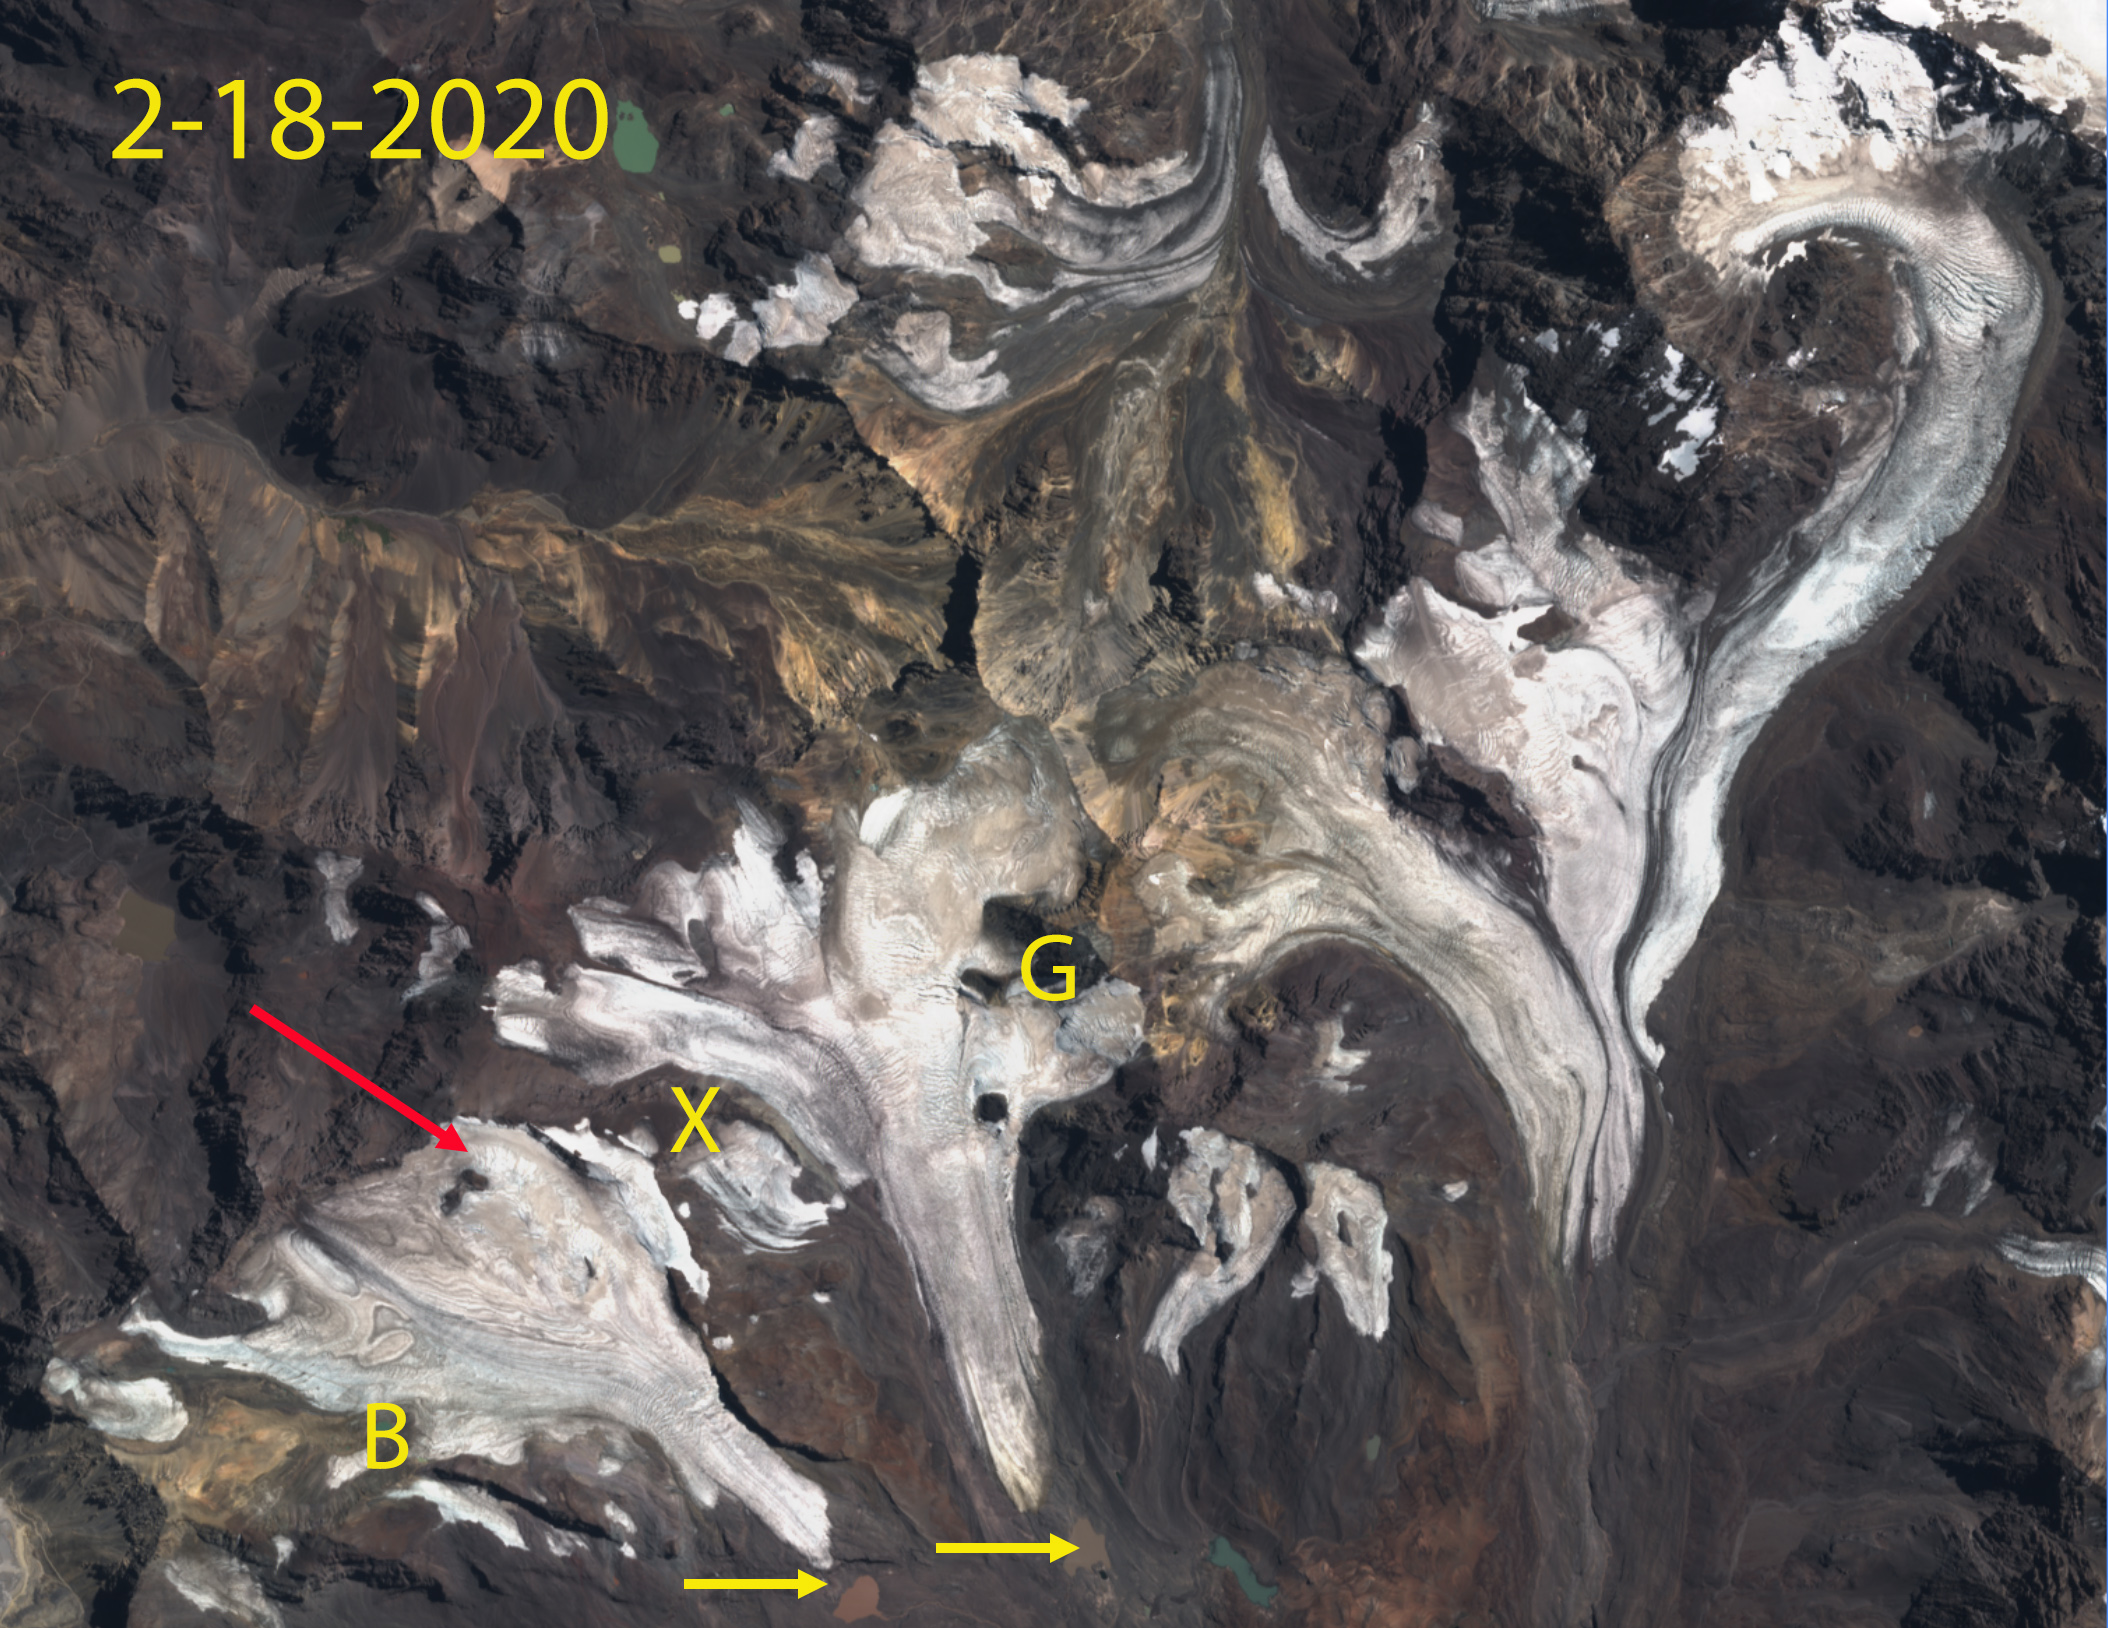
Snowcover free glaciers in the Central Andes in 2014 ad 2023 Landsat images. The ongoing fragmentation and retreat is evident at Point A-H, see closeup details below. The glacier as Point B has melted away, At Point G and H glacier tributaries have separated from the Norte Cipreses Glacier in the valley below. At Point D-F expanding bedrock areas amidst glacier driving further fragmentation. Glaciers at Point A and C rapidly melting away. 

Palomo Glacier and North Cipreses  are three comparatively large glaciers in the Central Andes of Chile. The three glaciers are adjacent to each other with the Palomo and Coton Glacier feeding  the Rio Cortaderal. Rio Cortaderal is part of the Cachapoal River watershed that supplies two Pacific Hydro projects; a 110 MW run of river project at Chacayes and a  78 MW Coya run of river project. Norte Cipreses Glacier feeds the Rio Cipreses. These glaciers are important water resource from December-March Bravo et al (2017) quantified this resource for adjacent Universidad Glacier, which supplied 10-13% of all melt season runoff to the Tinguirica Basin. La Quesne et al (2009) reported that Palomo Glacier retreated 1160 m from 1955-1978 and advanced ~50 m 1987-2007, due tot Palomo Glacier having an equilibrium balance durng the 1987-2000 period. Pelto (2022) reported a retreat of the glacier front of 1250 m from 2002-2022.  Here we examine the changes of this glacier from 2014-2023 using Landsat 8 and 9 images along with Sentinel images, that illustrate the impact of essentially snowcover free glaciers during the summer of  2022 and 2023 due largely to a January heat wave in 2022 (Washington Post, 2022) and February heat wave in 2023 (Pelto, 2023).

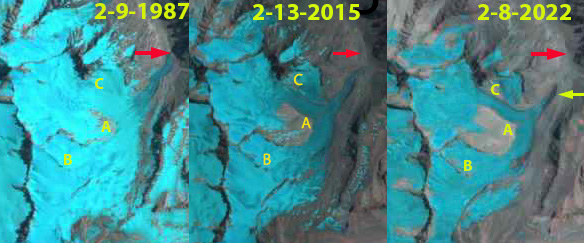
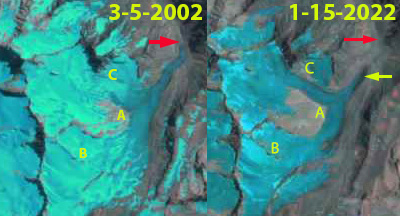
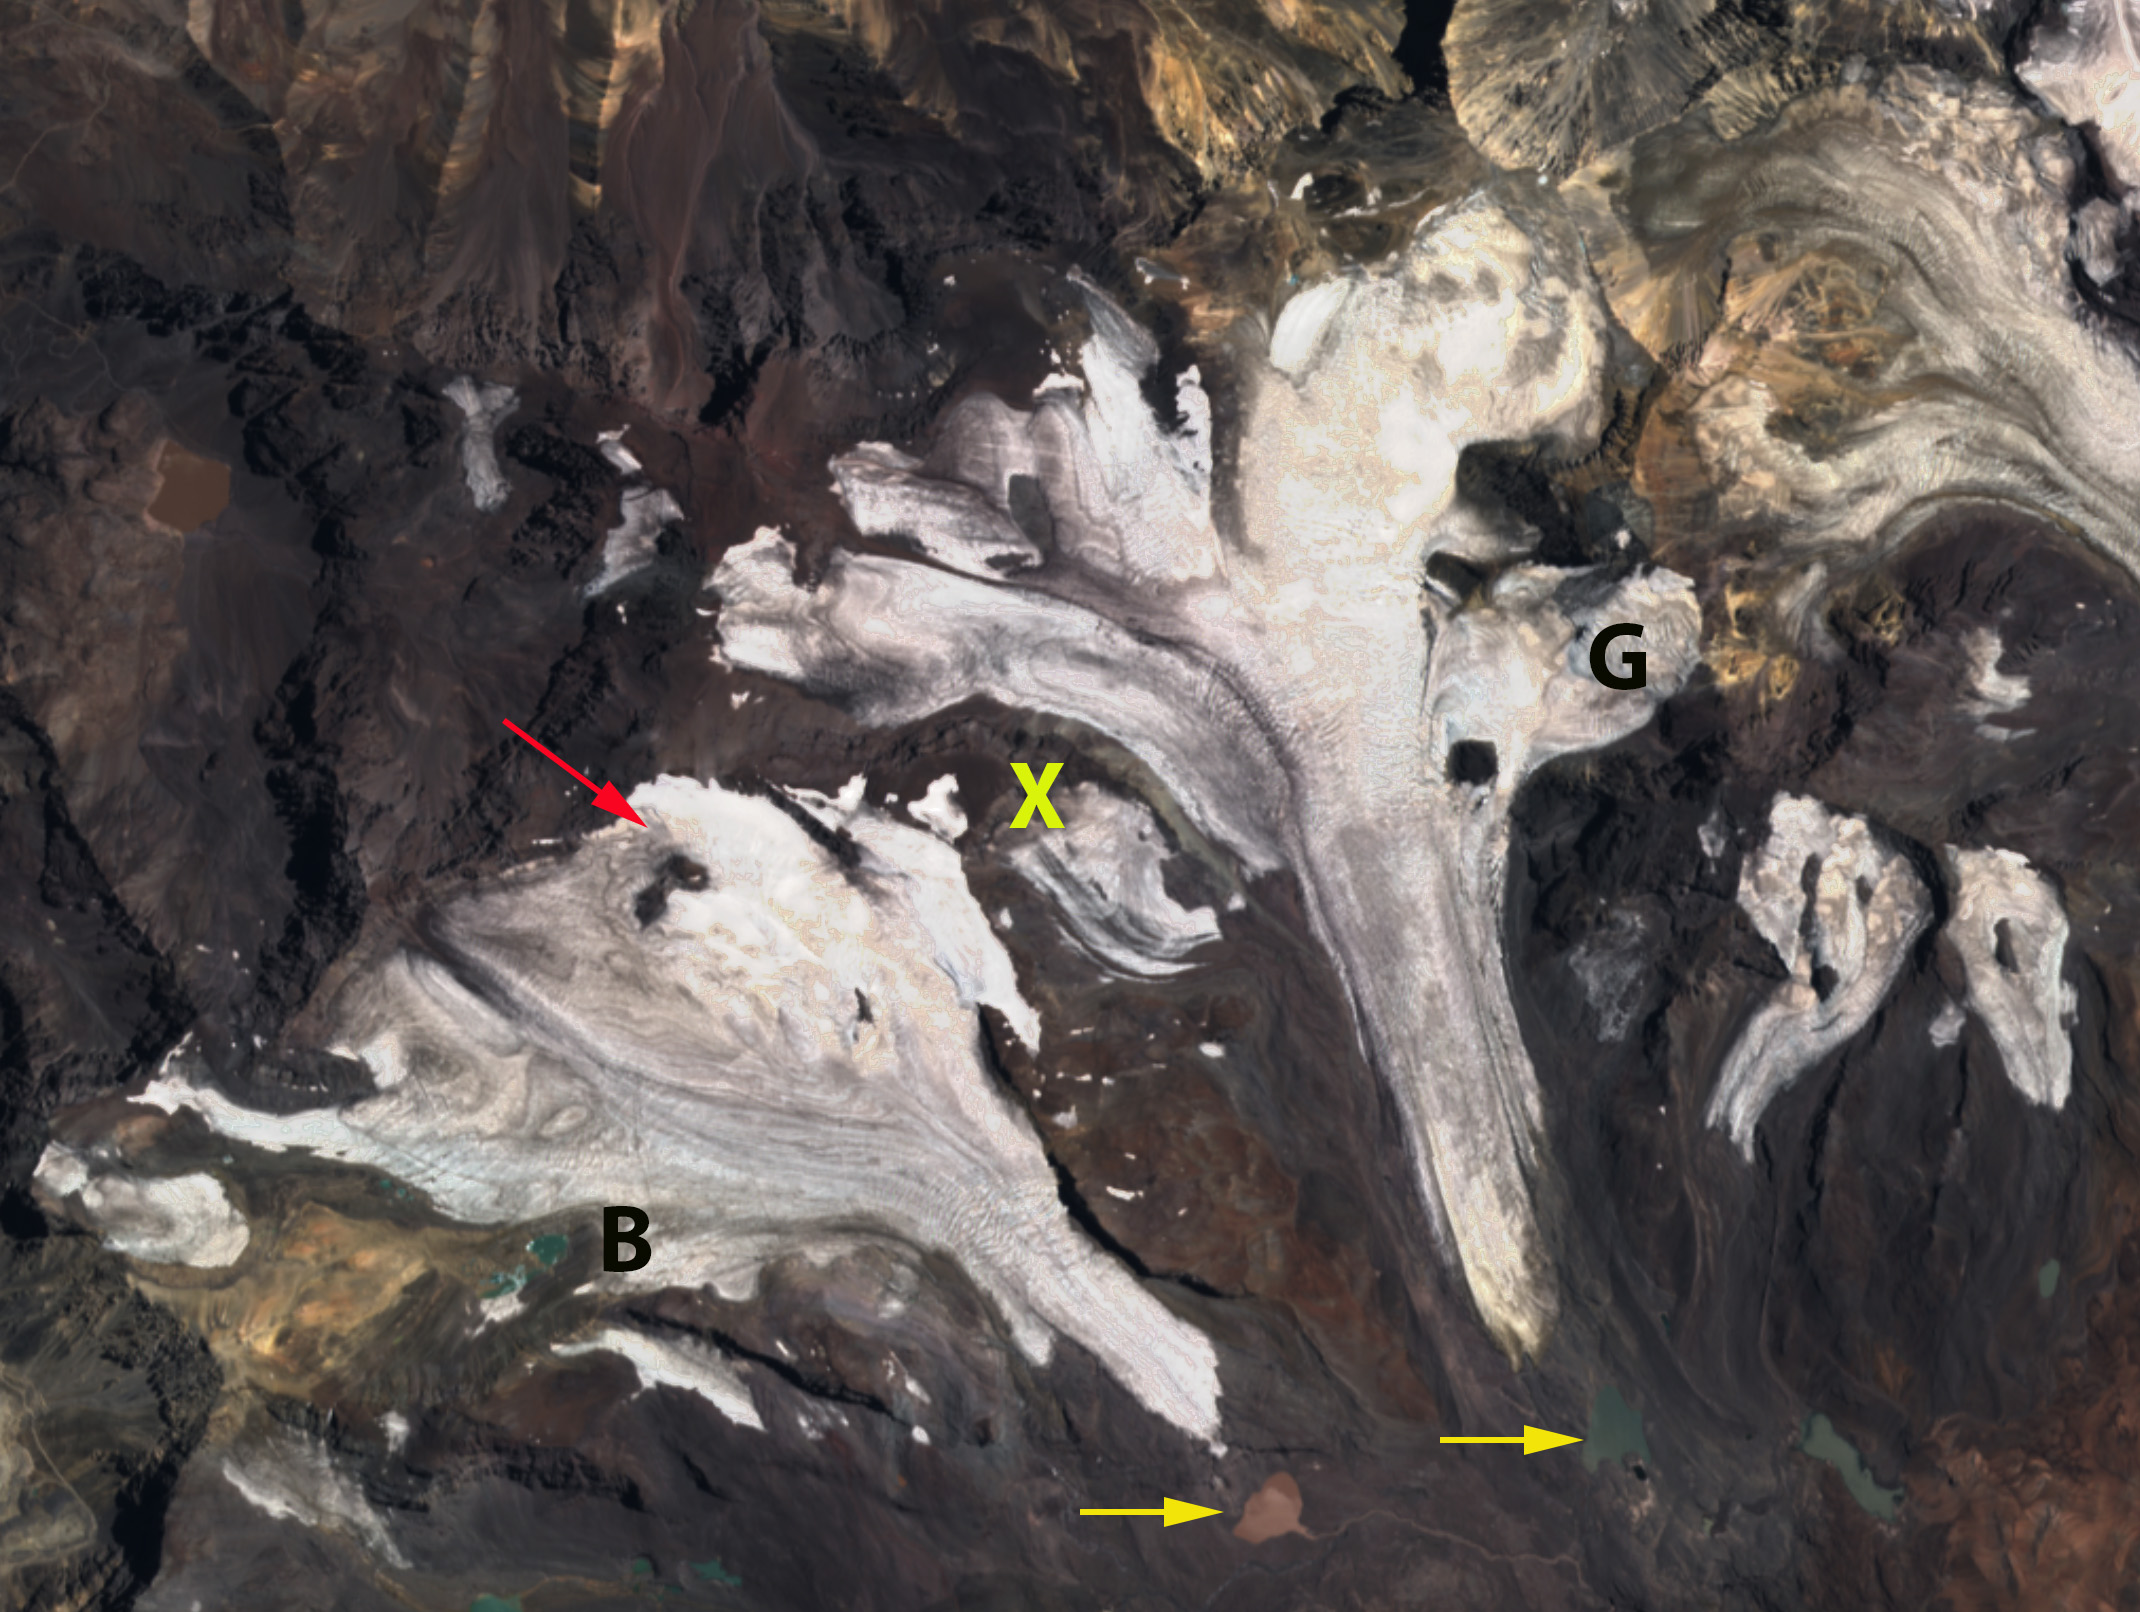
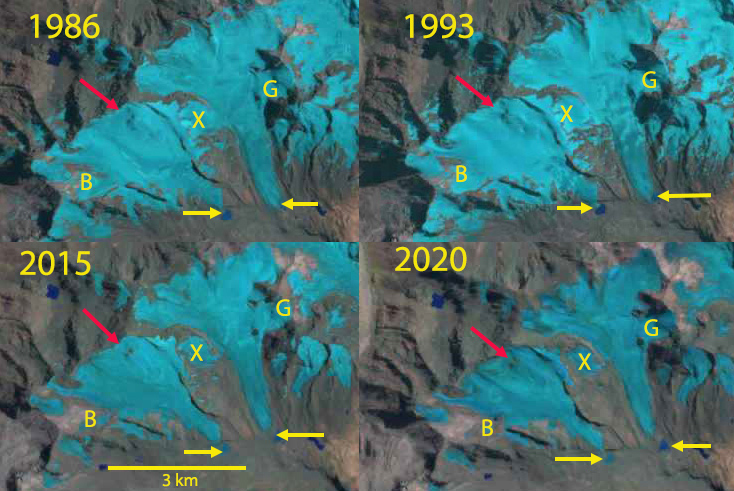
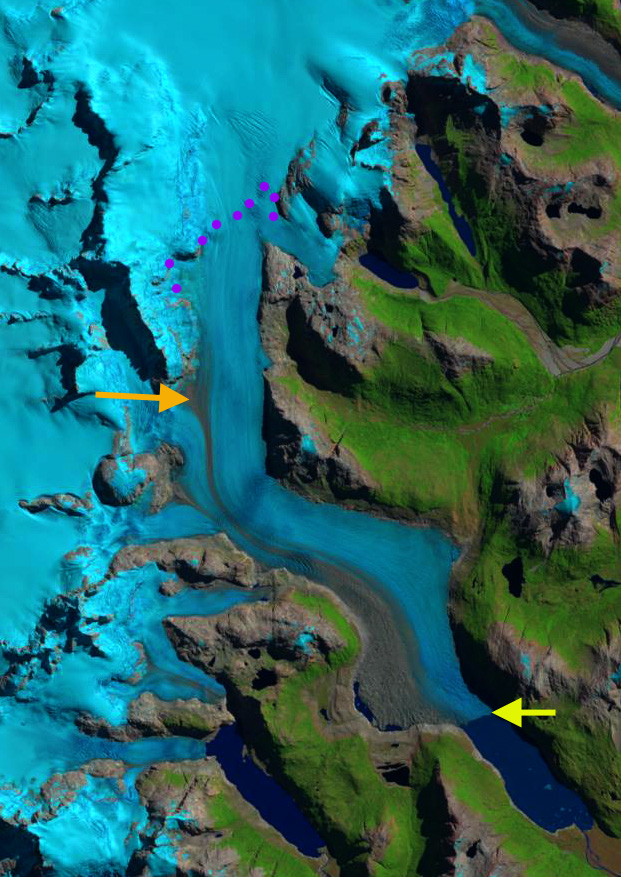
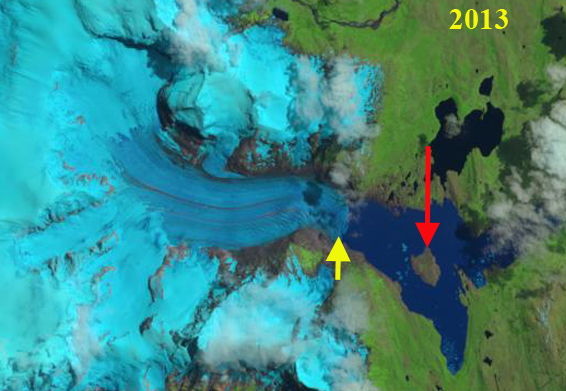
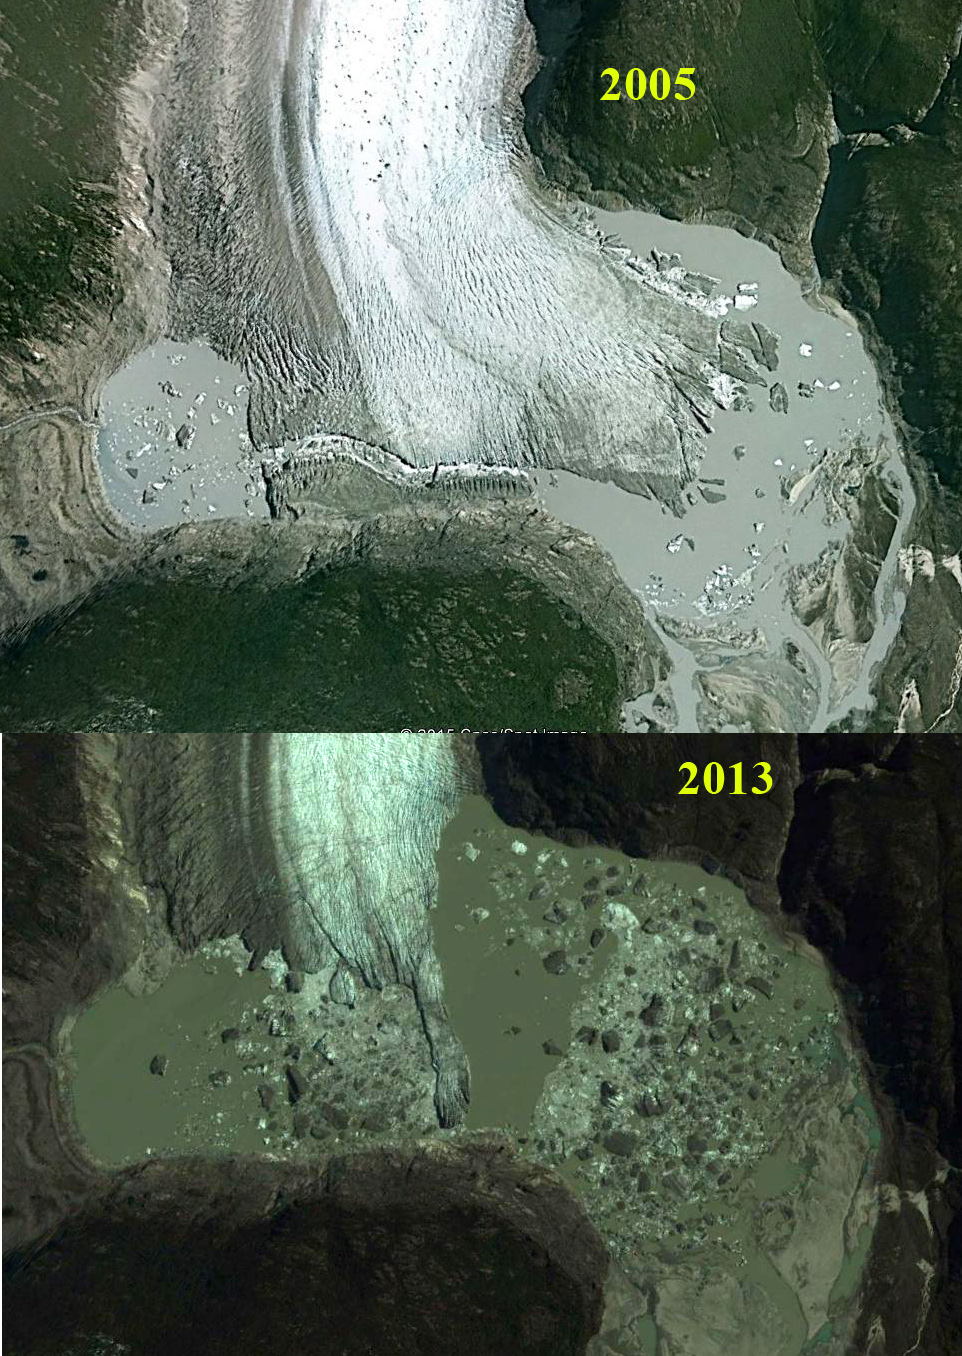
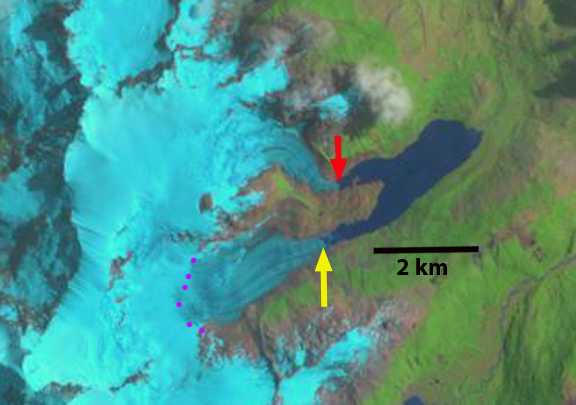
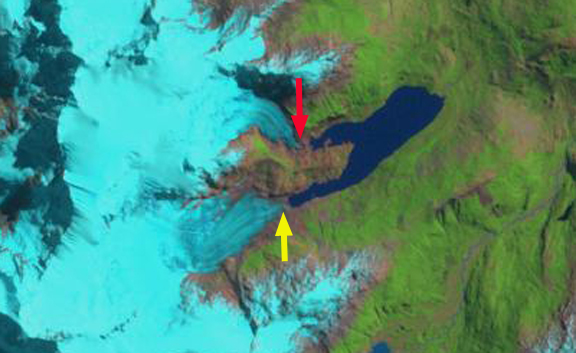
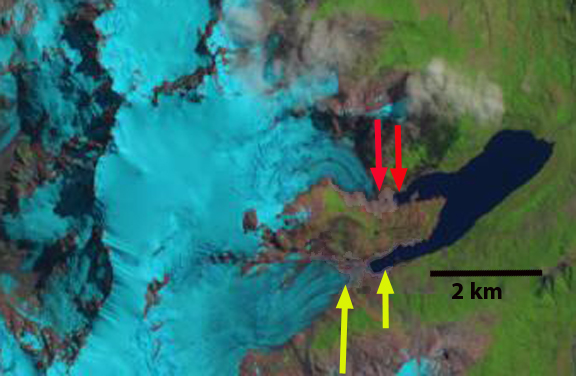
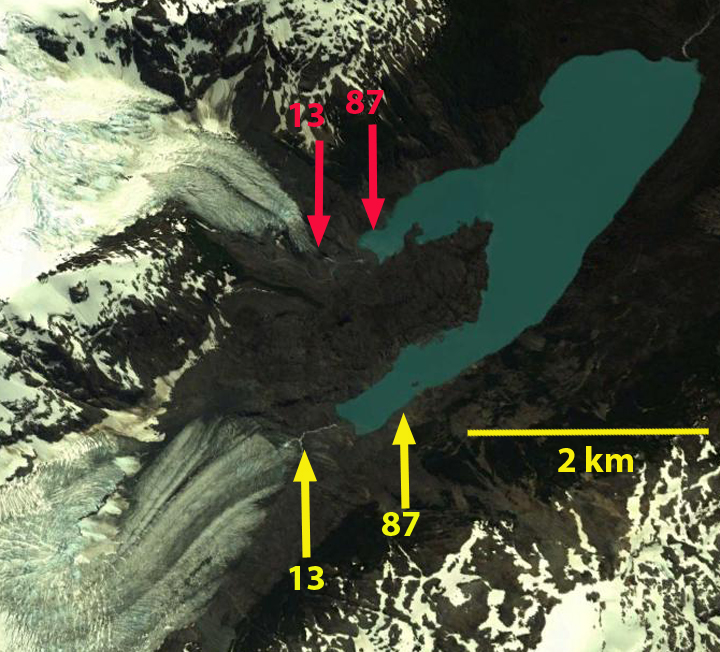
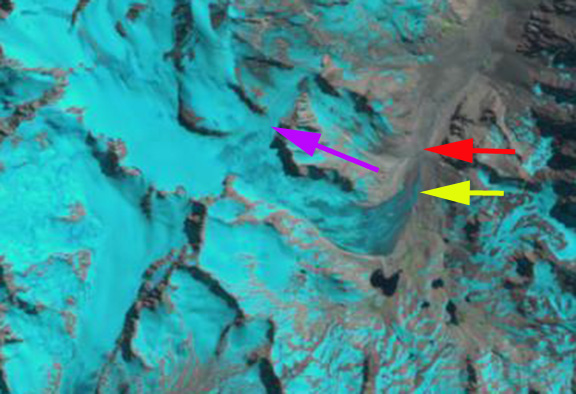
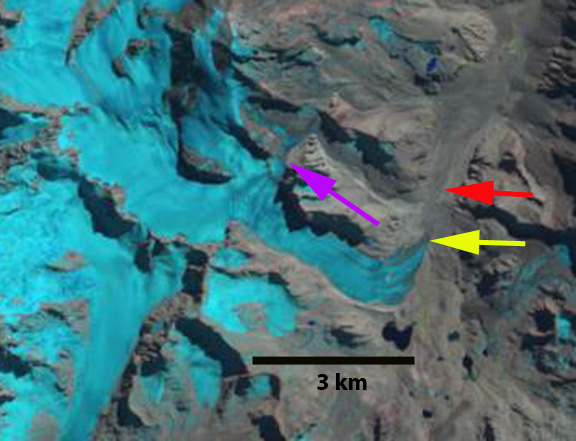
Point A is a small glacier in a south facing cirque below Alto de los Pejerreyes. From 2014 to 2023 area declined from 0.3 km² to 0.1 km². There is remanent glacier ice, but this is no longer active ice and will soon disappear. At Point B in 2014 the area of remanent glacier ice is 0.1 km², by 2023 it is gone. At Point C the glacier has declined from  0.35 km² to 0.15 km² and retreated 300 m from 2014-2023.  At Point D a bedrock area amidst the Maria Angeles Glacier, has expanded from 0.04 km² to 0.20 km², this reflects the lack of flow now reaching the terminus, which retreated 700 m from 2014-2023. At Point E the glacier has retreated 300 m and is separating into three fragments. At Point F the bedrock area amist Palomo Glacier has expanded from 1.1 km² to 1.7 km² between 2016 and 2023. This again reflects diminineshed flow to the terminus which has retreated 800 m during this period, ~100 m/year.  At Point G two glacier tongues connected to the Norte Cipreses Glacier in the valley below in 2014. By 2018 they had nealy separated and by 2023 they had completely separated from the glacier below, retreating 200-300 m to the top of this bedrock step. At Point H, the glacier disconnected from Norte Cipreses Glacier in the valley below after 2002 and retreated 300 m from 2014-2023. There is also a new expanding bedrock area high on the glacier, Point I below. The story is not unique with Sollipulli Glacier to the south and Rio Atuel glaciers in the next watershed to the east also having lost their snowcover in 2022 and 2023.

Retreat of Palomo Glacier from 2016 (red arrow) to 2023 (yellow arrow), 800 m. Separation of tributaries at G, yellow arrows that had fed Norte Cipreses Glacier. False color Sentinel images.


Glacier loss at Point B, Glacier retreat at Point C, yellow arrows marks 2016 location. Bedrock expansion at Point D, E and I. retreat from green arrow to yellow arrow of the Maria Angeles Glacier terminating near Point D. Glacier retreat at Point H, yellow arrows marks 2016 location. False color Sentinel images.

Palomo Glacier, Chile Snow Cover Loss in 2022 and Accelerating Retreat

Palomo Glacier, Chile in Landsat 5, 8 and 9 images illustrating retreat from 1987 position, red arrow, and expansion of bare rock areas amidst the glacier at Point A,B and C. Note lack of retained snowcover in 2022.

Palomo Glacier is a large valley glacier in Central Andes of Chile. Adjacent to the Cortaderal Glacier and Universidad Glacier, it flows east from Volcan Paloma (4860 m)  and drains into the Rio Cortaderal. Rio Cortaderal is in the Cachapoal River watershed that supplies two Pacific Hydro projects; a 110 MW run of river project at Chacayes and the 78 MW Coya run of river project a short distance downstream. The glacier is an important water resource from December-March. Bravo et al (2017) quantified this resource for nearby Universidad Glacier that supplied 10-13% of all runoff to the Tinguirica Basin during the melt season. La Quesne et al (2009) reported that Palomo Glacier retreated 1160 m from 1955-1978 and advaned ~50 m from 450 m 1987-2007. They reported that Palomo Glacier had an equilibrium balance durng the 1987-2000 period, which drove the lack of retreat. Here we examine the changes of this glacier from 1987-2022 using Landsat 5, 7, 8 and 9 images, and the unusually high snow lines during the winter of  2022 due largely to a January heat wave (Washington Post, 2022). This is the first post using Landsat 9, that extends this invaluable data record.


In 1987 Palomo Glacier terminus had been in slight advance over the previous decade. The area of bare rock at Point A was 0.25 km2. At Point B and C limited exposed rock was evident on two rock ribs.  The snowline is below Point A at 3300 m. By 2002 there is minor retreat and the area of exposed rock at Point A has expanded, with the snowline at 3600 m. By 2015 the terminus has retreated 700 m to the north end of steep slope on the east margin of the glacier. The exposed bedrock area at Point A is now 1 km2. the snowline is at 3800 m.  By mid-January 2022 the glacier has only ~10% snowcover remaining, mostly above 4000 m. Retreat since 1987 is now ~1200 m. The bedrock area at Point A is 1.5 km2. Point B is expanding ridge of bedrock and the rib or rock at Point C now separates the glacier from flow on the south facing slope east of Point C.

By February 8, 2022 with six weeks left in the melt season there is no evident retained snowpack. This will accelerate both retreat, thinning and area loss of this glacier.  This story is playing out at glaciers across the region such at Olivares Glacier, Chile,  Cortaderal Glacier, Chile and Volcan Overo, Argentina

Palomo Glacier, Chile in Landsat 7 and 9 images illustrating retreat from 1987 position, red arrow, and expansion of bare rock areas amidst the glacier at Point A,B and C.

Olivares Beta and Gamma Glaciers, Chile Bare of Snowcover in 2022

Olivares Beta (B) and Olivares Gamma (G) Glacier in Sentinel image from 1-23-2022, illustrating the lack of retained snowcover with 8 weeks left in the melt season. The yellow arrow marks proglacial lakes below each glacier. The red arrow an area of emerging bedrock on the upper Beta, X marks a location where the glaciers were joined in 1986 and now have separated. 

Olivares Beta and Olivares Gamma Glacier are adjacent glaciers 50 km NE of Santiago Chile in the central Andes of Chile. The glaciers are at the headwaters of the Olivares River, which drains into the Coloardo River. The Alfalfal Hydropower Planton the Colorado River is a 178 MW run of river plant completed in 1991 and owned by AES Andes. Malmros et al (2016) identified the retreat and area change of te Olivares glaciers for the 1955-2013 period. They noted a retreat of 979 m from 1955-1994 on Olivares Beta and 753 m on Olivares Gamma Glacier. The identified area loss from 1955-2013 was 21% on Olivares Beta and 34% Olivares Gamma.  Dussaillant et al (2019) identified a slower mass loss  -0.28 m/year in this region from 2000-2018, than further south in the Patagonia Andes or north in the Tropical Andes. Here we examine Landsat imagery from 1986-2020 and Sentinel Imagery from 2020-2022 to identify changes in area and snowcover.  The lack of retained snowcover indicates mass balance losses which will drive further retreat.

Olivares Beta (B) and Olivares Gamma (G) Glacier in Landsat images from 1986, 1993, 2015 and 2020. The yellow arrow marks the terminus location in 1993 of both glaciers, the red arrow an area of emerging bedrock on the upper Beta, X marks a location where the glaciers were joined in 1986 and now have separated. 

In  1986 and 1993 both glaciers terminated in small proglacial lakes, yellow arrows, and were connected adjacent to Point X.  There is no evident bedrock emerging on the upper Beta. In 1986 there is limited retained snowcover, ~10% of total area by early March. In 1993 there is 30% snowcover on the glaciers in March. By 2015 the glacier had receded from the proglacial lakes, bedrock is emerging at the red arrow on the upper Beta, and the glaciers are barely connected at Point X. Snowcover is ~10% of total area in mid-February.  In 2020 the glaciers have disconnected at Point X and there is less than ~10% retained snowcover by mid-February. The proglacial lakes are also quite brown suggesting high runoff from the dirtier/darker glacier. By January 23, 2022 both glaciers have again lost almost all snowcover with 8 weeks left in the melt season. The dirtier firn and ice at the surface melts at a faster rate than snow for the same weather conditions.  The result will be large mass balance losses in 2022 that will further lead to glacier thinning and recession. Both glaciers currently extend from ~3800 m to ~4800 m, with areas below 4600 m consistently being in the ablation zone.

The early loss of snowcover has been seen on other nearby glaciers Cortaderal Glacier, Chile and Volcan Overo, Argentina due to the unsually warm conditions in the region, particularly in the first half of January.

Olivares Beta (B) and Olivares Gamma (G) Glacier in Sentinel image from 2-18-2020 illustrating the lack of retained snowcover with 4 weeks left in the melt season. The yellow arrow marks proglacial lakes below each glacier. The red arrow an area of emerging bedrock on the upper Beta, X marks a location where the glaciers were joined in 1986 and now have separated. 

Olivares Beta and Olivares Gamm


Cortaderal Glacier, Chile 2022 Heat Wave Reduces Snow Cover, Retreat Continues

Cortaderal Glacier in Landsat images from 2014 and 2022. The glacier retreated 1400 m during this interval. The snowline in January 2014 is at 3750 m. On January 15, 2022 the snowline averages 4100 m with less than 15% snowcovered with 2.5 months left in the melt season. Red arrow is 2014 terminus and yellow arrow is 2022 terminus.

Cortaderal Glacier is a large valley glacier in Central Andes of Chile. Adjacent to the Universidad Glacier, it flows from Volcan Paloma (4860 m) and Nevado Penitente (4350 m) and drains into the Rio Cortaderal. Rio Cortaderal joins the Cachapoal River, that supplies two Pacific Hydro projects; a 110 MW run of river project at Chacayes and the 78 MW Coya run of river project a short distance downstream. The glacier is an important water resource from December-March. Bravo et al (2017) noted for Universidad Glacier that it supplied 10-13% of all runoff to the Tinguirica Basin during the melt season. La Quesne et al (2009) reported that Cortaderal Glacier retreated 110 m from 1970-2000 and 450 m from 2000-2007. Here we examine the retreat of this glacier from 2014-2022 and the unusually high snow lines in mid-January of 2022 due to the recent January heat wave (Washington Post, 2022).

Cortaderal Glacier in Sentinel images from 2016 and 2022. Point A is the bedrock area that emerged in 2016 and was at the glacier front by 2022. Point T marks the 2016 terminus position, Point B is at 3750 m and Point C is at 4200 m. Snowline on January 22, 2016 is at 3200 m and averages 4100 m on January 13, 2022.

In February of 2014 the glacier terminated on the outwash plain at 2800 m. The snowline in mid January was at 3750 m. On January 9, 2016 the snowline was at 3200 m.  At Point A a small bedrock area has emerged from beneath the ice  1 km upglacier of the terminus. On January 16, 2017 the snowline is at 3750 m. On January 19, 2019 the snowline is at 3700 m. The bedrock exposed at Point A is no longer surrounded by ice due to expansion and glacier retreat. On December 14th the snowline is at 3700 m and the glacier is 50% snowcovered. By January 15 there is less than 15 % snowcover, and the snowline averages 4100 m, nearly at the top of the glacier. With 10 weeks left in the melt season snowcover will decline further. This is reminiscent of reduced snowcover on glaciers in the Pacific Northwest due to the summer 2021 heat wave (Pelto, 2021).

The glacier has retreated to Point A, with an average frontal recession of 1300 m from 2014-2022. This is greater than the retreat from 1990-2014 of ~800-900 m (Pelto, 2014).  The glacier now terminates at 3050 m in a region of much steeper slope that will reduce the retreat rate in the near future.

Cortaderal Glacier snow covered area change in two Landsat images one month apart. Snowcover declined from ~50% to 15%.

Cortaderal Glacier in Sentinel images from 2017 and 2019. Point A is the bedrock area that emerged in 2016 and was at the glacier front by 2022. Point T marks the 2016 terminus position, Point B is at 3750 m and Point C is at 4200 m. Snowline on January 16, 2017 is at 3750 m and averages 3700 m on January 19, 2019.

Landsat image indicating retreat from 1990-2014 of Cortaderal Glacier, red arrow 1990 position, yellow arrow 2014 position.

Glacier Nef, Patagonia, Chile retreat 1987-2016.

nef compare

Comparison of 1987 and 2015 Landsat images of Nef Glacier at right and Cachet Glacier at left.  Indicating retreat of Nef Glacier from red arrows to yellow arrows of 1.8 km and development of a new lake at the terminus. Purple arrows indicate upglacier thinning leading to separation of glacier tributaries. 

Glacier retreat and thinning is particularly strong in the Patagonian icefields of South America. The two largest temperate ice bodies of the Southern Hemisphere are the Northern Patagonia Icefield 4,000 km2 and the Southern Patagonia Icefield, 13,000 km2. It has been estimated that the wastage of the two icefields from 1995–2000 has contributed to sea level rise by 0.105 ± 0.011 mm year,which is double the ice loss calculated for 1975-2000 (Rignot et al. 2003).   Davies and Glasser (2012) work, has an excellent figure indicating two periods of fastest recession since 1870, are 1975-1986 and 2001-2011 for NPI glaciers, which suggests that ice volume loss increased after 2000. They noted the loss was 0.07% from 1870-1986, 0.14% annually from 1986-2001 and 0.22% annually from 2001-2011. Glasser et al (2011) find the recent ice volume rate loss is an order of magnitude faster than at other time intervals since the Little Ice Age. Baker River (Rio Baker) is located to the east of the Northern Patagonia Icefield and is fed mainly by glacier melt water originating from the eastern outlet glaciers of the icefield Leones, Soler, Nef, Colonia. Rio Baker is the most important Chilean river in terms of runoff, with an annual mean discharge of about 1000 m3/s Lopez and Casassa (2009). Glacier Nef is one of the main glaciers feeding Rio Baker. Rio Baker was a proposed critical hydropower resource for Chile. Hidroaysen Project had proposed 5 dams on the Baker and Pascua River generating 2750 MW of power, all three proposed dams on the Rio Baker have been cancelled.

Glacier Nef began to retreat into a moraine dammed proglacial lake in 1945 (Loriaux and Casassa, 2014). By 1987 the lake remained less than 1 km long, with glacier thinning predominating over retreat. From 1987 to 2015 the glacier has retreated 1.8 km calving into the growing lake.  The lake width was essentially uniform during this phase of retreat There is not significant retreat from 2015 to 2016. The lake is currently about 5.4 square kilometers and has a mean depth of ~125 m (Loriaux and Casassa, 2014).  In 2015 Glacier Nef has not reached the head of this proglacial lake and will continue to retreat. The west side of the terminus is debris covered and has a fringing proglacial lake that has developed after 2000 and will aid in the continuing retreat. The terminus is currently at a pinning point, where the valley is constricted providing greater terminus stability. Further retreat will lead to an expansion of the embayment and calving front, leading to a further increase in glacier retreat. The lack of elevation change of the lower glacier and the isolated proglacial lake here suggests the lake will expand laterally as well as in length. The debris cover is slowing the thinning and retreat of the western margin. The purple arrows indicate thinning upglacier in a former tributary glacier. The 2016 Landsat image indicates a high snowline at 1350 m, purple dots.  Willis et al (2011) observed that the thinning rate of NPI glaciers below the equilibrium line has increased substantially from 2000-2012, partly an indication of a higher snowline indicative of greater ablation and a longer snow free period lower in the ablation zone. For example on Nef Glacier by January 8, 2016  the snowline was at 1300 m and remained high up until at least the mid-march image below. The retreat follows the pattern of enhanced calving in a proglacial lake for NPI glaciers such as Gualas GlacierReichert Glacier, Steffen Glacier, and Colonia Glacier.
nef 2016

2016 Landsat image of Nef Glacier indicating terminus yellow arrow and source of the debris for the debris covered terminus. 

nef terminus

Closeup of Nef Terminus from Chile Topographic Application.  Notice the widening valley just above terminus.  Debris cover is insulating ice on west side of terminus.  

Balmaceda Glacier Retreat, Chile Releases Island

balmaceda compare

1986 and 2015 Landsat images of the Balmaceda Glacier, Chile region.  Red arrow indicates 1986 ice front, yellow arrow 2015 ice front and purple arrow a tributary that has detached.

Balmaceda Glacier (Felicia Glacier) is at the southeastern end of the Southern Patagonia Ice Cap (SPI) field and drains into the Serrano River.  There is another glacier referred to as Balmaceda  that descends steeply almost to the shores of Fiordo Ultima Esperanza, hence Felicia Glacier will be used here.  Willis et al (2012) observed that between February 2000 and March 2012, indicate that SPI is rapidly losing volume, that thinning extends to the highest elevations.  The mass balance loss is occurring at a rate of −20.0 ± Gt/year, which is +0.055 mm/year of sea level rise. The retreat is driven by increasing calving rates from the 1975-2000 to the 2000-10 period (Schaefer et al, 2015). The pattern of retreat is consistent between these glaciers and the region as noted by Davies and Glasser (2012),  annual rates of shrinkage in the Patagonian Andes increased in  from 0.10% year from 1870-1986, 0.14% year from 1986-2001, and 0.22% year from 2001-2011. These losses have led to retreat such as at Glaciar Marconi and Glacier Onelli

In 1986 the glacier terminated on an island in that acts as pinning point stabilizing the glacier front.  The calving front is over 2.5 km wide. By 2000 Landsat imagery indicates the glacier has retreated from the island with the greatest retreat on the north side.  By 2013 the glacier has receded into a narrow western arm of the lake, the snowline is at 600 m. By 2015 a southern tributary has separated from the main glacier at the purple arrow. The terminus at the yellow arrow is 1 km from an increase in surface slope indicating a rise in bedrock that may be the inland margin of the lake. The retreat from 1986 to 2015 is 2100 m and the current calving front is 1.2 km wide.  The snowline in 2015 is at 1000 m is quite high.  De Angelis (2014) notes the ELA for this glacier at 690 m.  Above the snowline the linear wind sculpted features oriented west to east indicate the ferocious winds of the region Schaefer et al (2015) note the exceptional accumulation rates in the region

The Balmaceda Glacier drains into the Serrano River, the headwaters being Del Toro Lake on the southern boundary of Torres del Paine National Park.  The river is home to numerous giant Chinook salmon which can weigh up to 35 kg with fishing season from June to December.  Chinook salmon have just recently started populating rivers in Chile and Argentina. Fish hatcheries in southern Chile release thousands of Chinook smolts. The introduced Chinook originate from tributaries of the Columbia River of Washington and Oregon.

balmaceda 2000

2000 Landsat Image

balmaceda 2013

2013 landsat image

balmaceda 2015

2015 Landsat image the purple dots are the snowline which at 1100 m is quite high.  Also note the long wind drift features extending west to east above the snowline.


Colonia Glacier, Chile Retreat and Periodic Lake Outbursts


colonia-compare-1024x495

Comparison of 1987 and 2015 Landsat images indicating retreat from red arrows to yellow arrows of 2.5 km and development of a new lake at the terminus. orange arrow indicates glacier dammed lake that fills and empties periodically. 

Colonia Glacier drains east from the Northern Patagonia Icefield feeding the Baker River, Chile. It is the largest glacier draining east from the NPI.  A comparison of the 1987  and 2015 images indicate a 2.5 km retreat of the glacier front, development of a large lake and areas of thinning well upglacier at the purple arrows. The recent substantial retreat of Colonia Glacier like Glacier Nef just to its north is posing new hazards. The glacier is unusual in the number of lakes that are adjacent to or feed into the adjacent glacier dammed or proglacial lakes. In the image below Lake A=Arco Lake, Lake B=East Terminal Lake, Lake C=Cachet 1 , Lake D= West terminal Lake, Lake E=Colonia Lake and Lake F=Cachet 2. In the case of Baker River the outburst floods are a threat to the planned hydropower developments as documented by Dusaillant and others (2009).  Hidroaysen Project proposed 5 dams on the Baker and Pascua River generating 2750 MW of power that after initial permit approval in 2011Chile’s Committee of Ministers overturned the environmental permits in 2015.

Slide1

Google Earth image from 2005.

The glaciers recent retreat and glacier lake outburst floods have been closely monitored by the Laboratorio de Glaciología in Valdivia, Chile.  Aniya and others (1999) observed that Colonia Glacier began a rapid retreat after 1985 from 1997-2005 that has further accelerated, with a general frontal retreat of 2 km. Rivera and others (2007) observed that the Colonia Glacier had lost 9.1 square kilometers of area from 1979-2001, which is 3% of the total glacier area and thinned 1.1 m per year in the ablation zone.

Image from Laboratorio de Glaciologia, frontal change 1944-2005.

The Laboratorio de Glaciologia’s observed in the spring of 2008 Baker River suddenly tripled in size, in less than 48 hours, roads, bridges, and farms were severely damaged. Lake Cachet 2 had vanished the 5 square kilometer glacial lake had emptied 200 million cubic meters of water in just a matter of hours. This lake drained beneath the glacier after sufficient water had filled the lake to buoy part of the glacier and subglacial conduits had begun to develop. Since Cachet 2 emptied in April 2008, the lake has emptied at least six more times October, December 2008, March and September 2009, March 2010, and early 2013 with peak flows released of 3000 cubic meters per second. Below are images of Cachet 2 full iand empty in 2008 from Laboratorio de Glaciologia’s. Also a  comparison of before and after drainage in Landsat images from Sept. 2012 and Feb. 2013.

cachet 2 empty

Cachhet Lake full looking toward Colonia Dam 2008

Cachet Lake after emptying looking upvalley away from Colonia Glacier 2008. 

colonia outburst 2013

Cachet lake full in Sept. 2012 and emptied in Feb. 2013 Landsat images.

The two lakes at the terminus of the glacier did not exist in 1979, the western most terminus lake drained into the easternmost terminus lake (D) via a sub-glacial tunnel after formation in the late 1980’s until 2005 when a channel was cut right through the glacier terminus. Retreat of the glacier terminus first led to significant lake development in 2001.  This is evident in the image below, there is still glacier ice on both sides of this drainage channel.  By 2015 the lakes have merged into a single large proglacial lake at the terminus that is 3.2 km wide.The development and demise of glacier dammed lakes and the resultant problem of glacier lake outburst floods is not rare today, Imja Glacier, and Tulsequah Glacier are other examples.

Lake expansion at the end of the Colonia Glacier from 2005 to 2013, Google Earth images. 

colonia terminus lake

Cordillera Lago General Carrera Glacier Retreat, Chile

You know southern Chile has lots of glaciers when an icefield with an area of 132 square kilometers has no named glaciers.  Davies and Glasser (2012) referred to this icefield as Cordillera Lago General Carrera, since it drains into that lake, the icefield is just east of the Northern Patagonia Icefield.   Davies and Glasser (2012)  noted that the icefield has a mean elevation of 1670 m and has declined from an area of 190 square kilometers in 1870, to 139 square kilometers in 1986, and 132 square kilometers in 2011.  They further noted that the area loss of Patagonia glaciers has been most rapid from 2001 to 2011.  Paul and Molg (2014) observed a more rapid retreat of 25% total area lost from glaciers in northern Patagonia from 1985-2011, the study area was north of the Northern Patagonia Icefield. Lago General Carrera drains into the Baker River, which is fed by most glaciers on the east side of the Northern Patagonia Icefield.  This river had a series of proposed hydropower projects that have now been cancelled by the Chilean government.

clcg

Here we examine Landsat imagery from 1987 to 2014 to identify the changes in a pair of outlet glaciers that drain the eastern side of the icefield, images below. In 1987 both outlet glaciers terminated in an unnamed lake that drains into the Leones River. The southern glacier is 5.5 km long beginning at 2400 m and terminates at the yellow arrow, with the snowline marked by purple dots, in the images below.  The northern glacier is 5.0 km long beginning at 2200 m with the terminus at the red arrow. In 1987 the glaciers were in shallow enough water  that calving was limited and no icebergs are evident. By 2001 both glaciers are no longer terminating in the lake.  The retreat can no longer be enhanced by calving into the lake.  By 2014 both glaciers have retreated several hundred meters from the lake.  It is easier to measure the retreat in the 2013 Google Earth image.  The retreat from the 1987 to 2013 position are indicated by the pair of arrows.  The northern glacier has retreated 400 m and the southern glacier 600 m from 1987 to 2013.  In both cases this is approximately 10% of the glacier length.  The beautiful green color of the lake is indicative of the contribution of glacier flour from actively moving and eroding glaciers.  This glaciers retreat is similar to that of the nearby Nef Glacier and Verde Glacier.

clgc 1987
1987 Landsat image
clgc icefield 2001

2001 Landsat image
clgc 2014

2014 Landsat image

clgc ge 2013
2013 Google Earth image.  With arrows indicating terminus change from 1987 to 2013.

Cortaderal Glacier Retreat, Chile

Cortaderal Glacier is in central Chile on the south slope of Paloma a stratovolcano. The glacier feeds the Cortaderal River which joins the Cachapoal River. Pacific Hydro has opened a new hydropower plant at Chacayes that is fed by this and other glaciers. It is a 111 MW run of river project with water taken out at a small dam run through a canal a small reservoir and back into the river. There is an older Coya Hydropower Plant a short distance downstream. Pacific Hydro plans to add several more plants in the area.  Continued glacier retreat in the regions will lead to further glacier runoff declines during the melt season.cortaderal ge 2007
Cortaderal Glacier Google Earth image

chacayes intake
Chacayes Hydropower intake and canal

chacayes canal
Chacayes Hydropower Canal and Reservoir

coya hydro
Coya Hydropower Plant
La Quesne et al (2009) reported a that Cortaderal Glacier retreated 110 m from 1970-2000 and 450 m from 2000-2007. Here we use satellite imagery from 1990-2014 to observe this retreat and more recent changes. In each image the red arrow is the 1990 terminus the 2014 is marked by a yellow arrow and the purple arrow a smaller side glacier feeding a secondary terminus. In 1990 the glacier after descending turned north in the main river valley and extended 1 km north. The side glacier has a significant width of 300 m. By 2000 the glacier had retreated 300 m and with a high snowline the connection to the secondary terminus at the purple arrow is narrowing but still significant. In 2003 further change is hard to discern. In 2013 substantial further retreat has occurred, the snowline is high at 3800 m and the secondary terminus connection is nearly gone. By 2014 the retreat since 1990 is 800 to 900 m, the snowline is at 3700 m and the secondary terminus connection is to narrow to actually feed glacier ice.  The retreat here is similar to that of nearby Glaciar del Humo, Argentina.  The Laboratorio de Glaciologia in Valdivia, Chile, Rivera et al (2002), has noted the extensive retreat of the Central Chile glaciers over the last four decades.
cortaderal 1990
1990 Landsat image
cortaderal 2000
2000 Landsat image
cortaderal 2003
2003 Landsat image
cortaderal 2013
2013 Landsat image
cortaderal 2014 2014 Landsat image