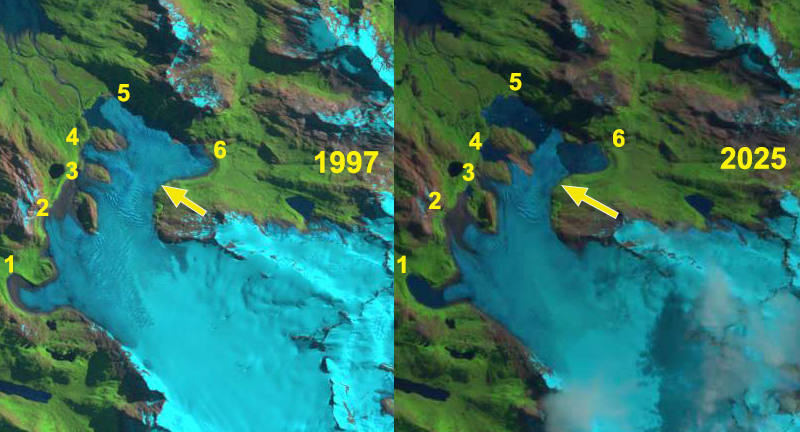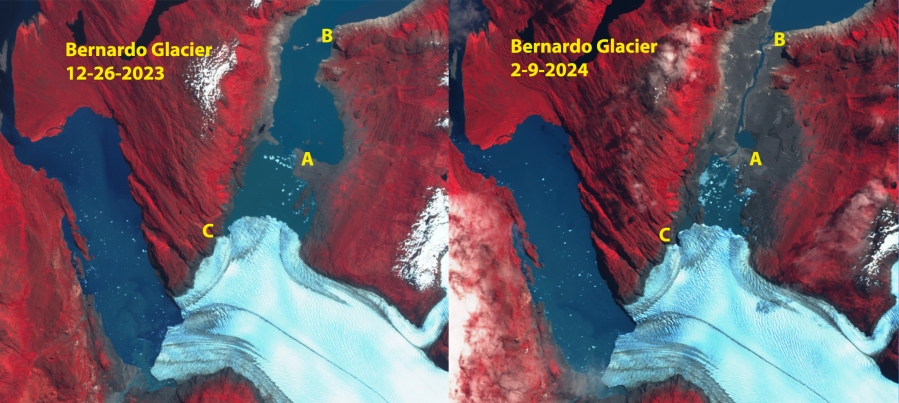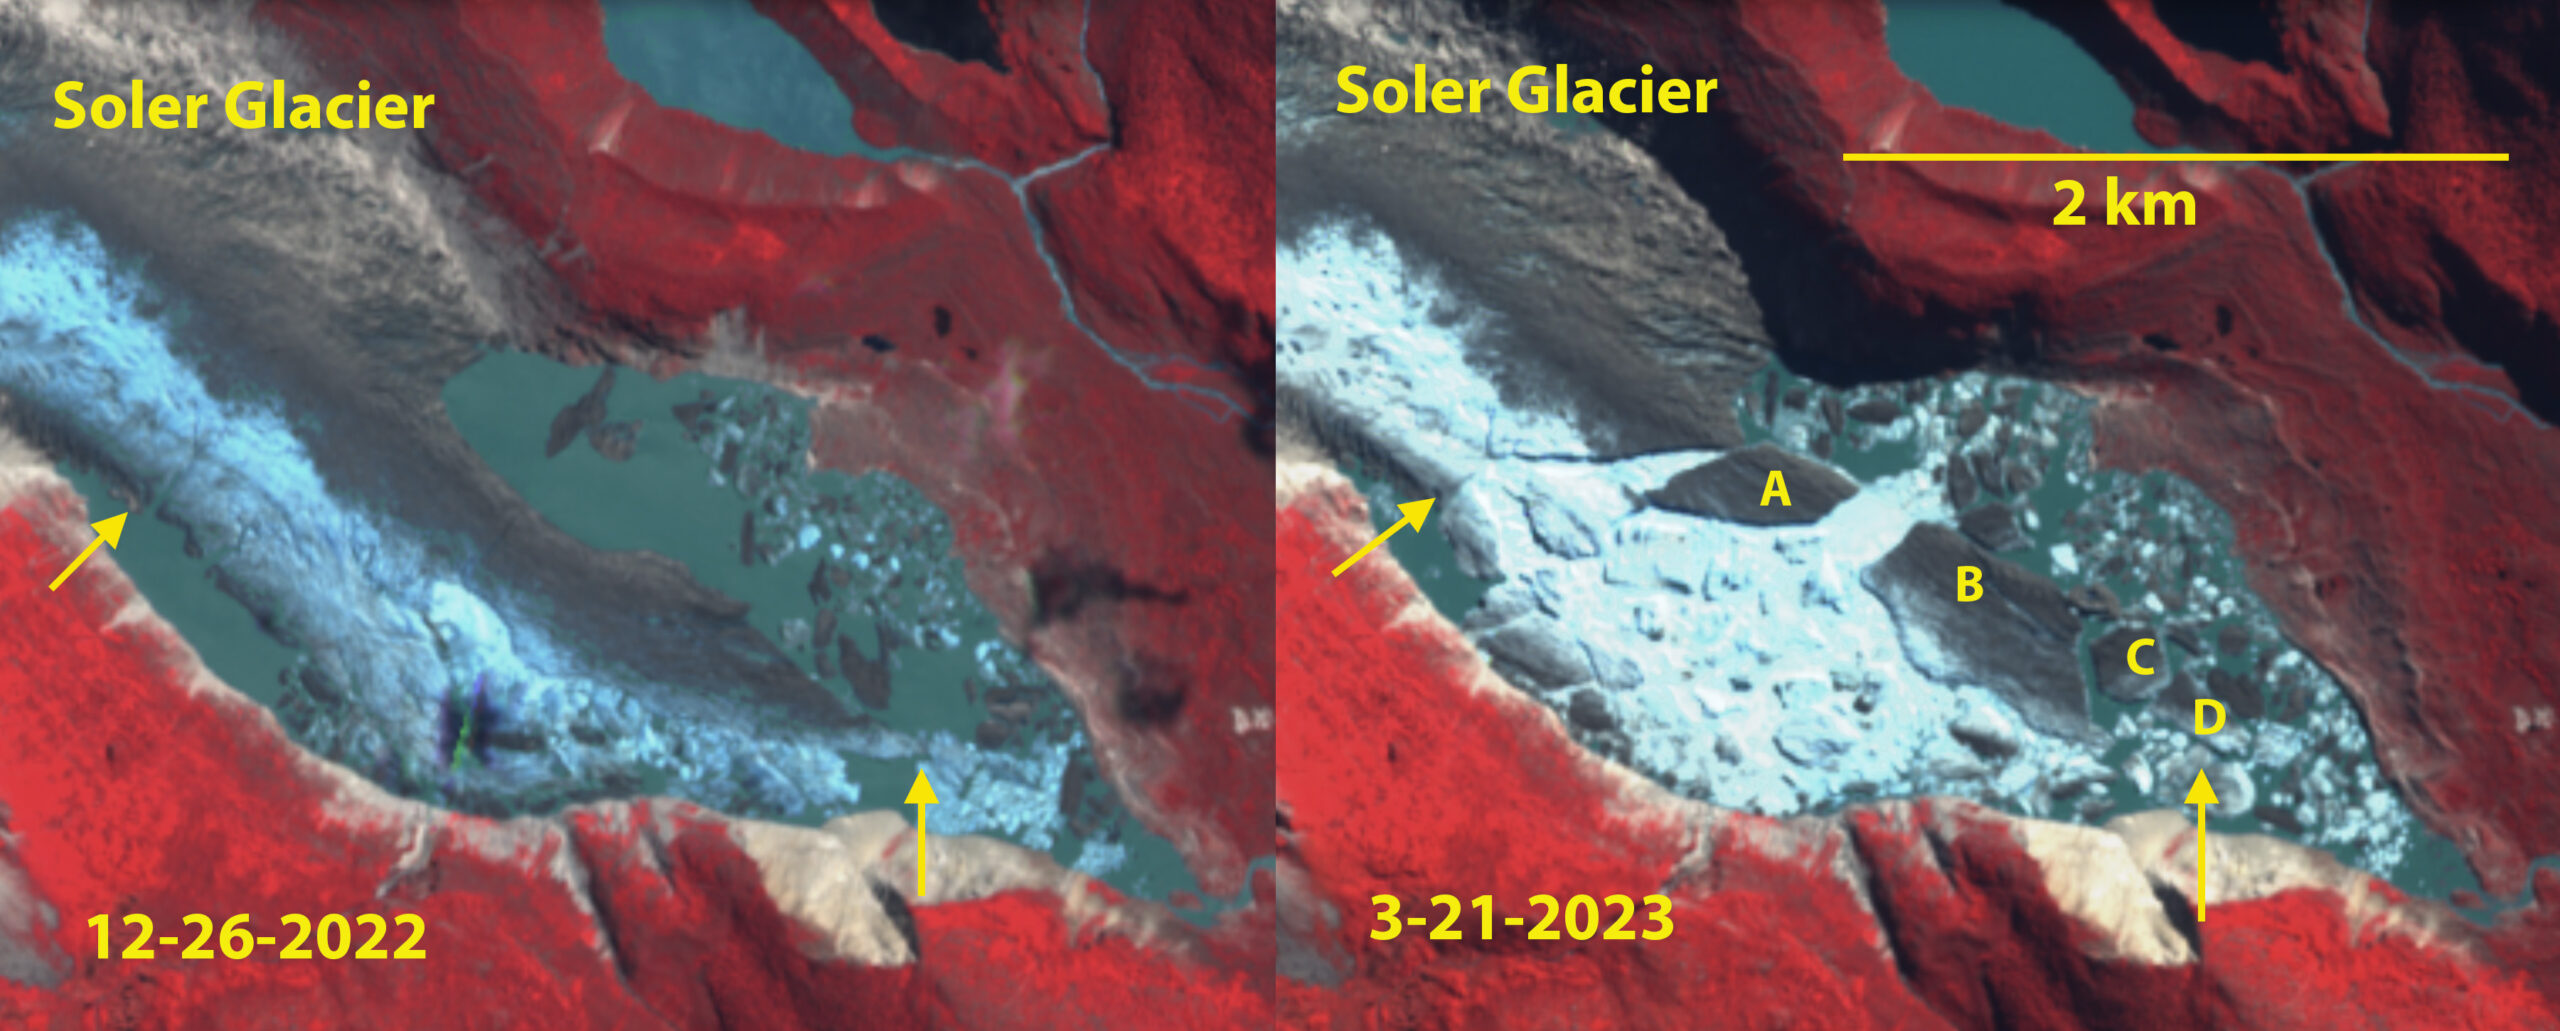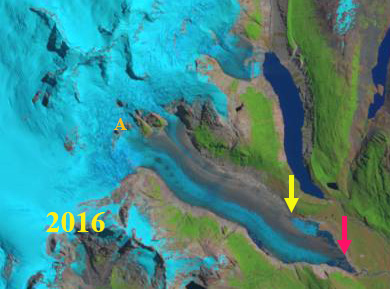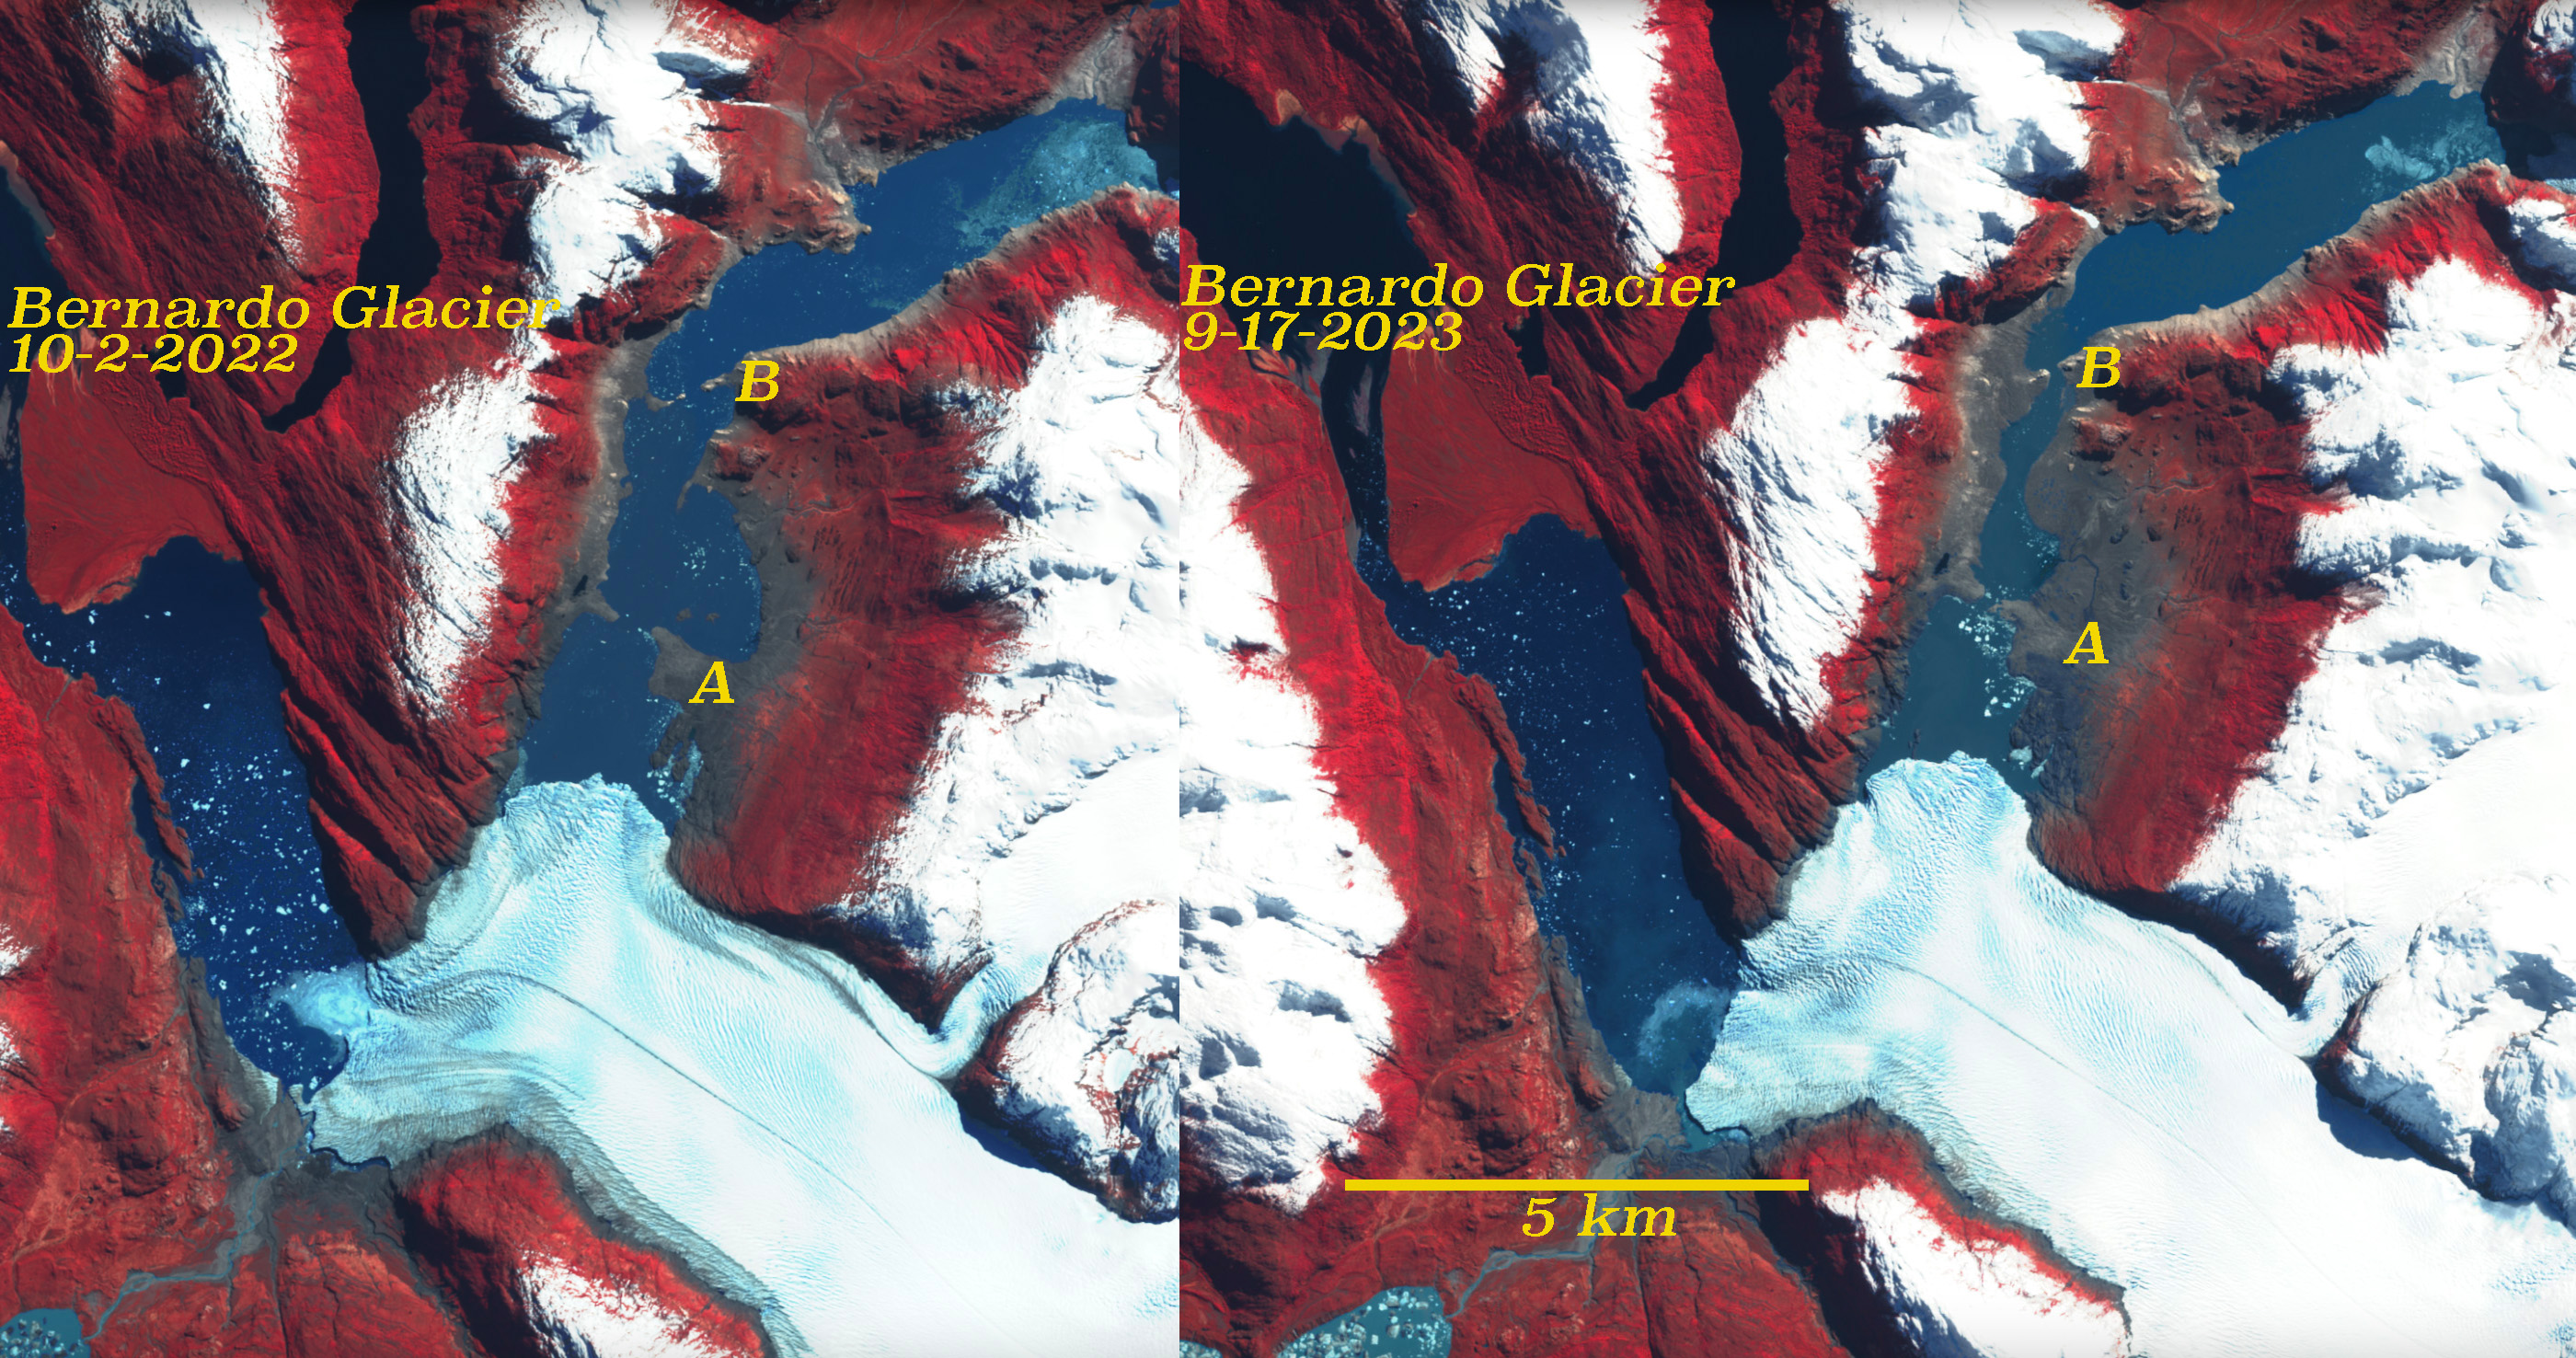
Bernardo Glacier in Landsat images from Oct. 16, 2022 and Sept. 17, 2023 illustrating the drainage of the southern end of the proglacial lake by the northern terminus (N). The lake was full in 2021, partially drained by Oct. 2022, further drained by March 2023 and has not signficantly refilled by Sept. 2023, still 8 km² of exposed lake bed.

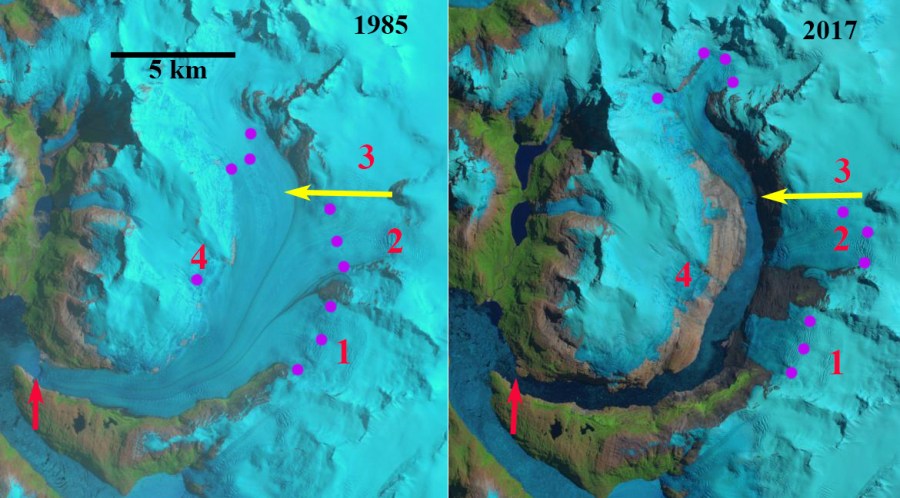
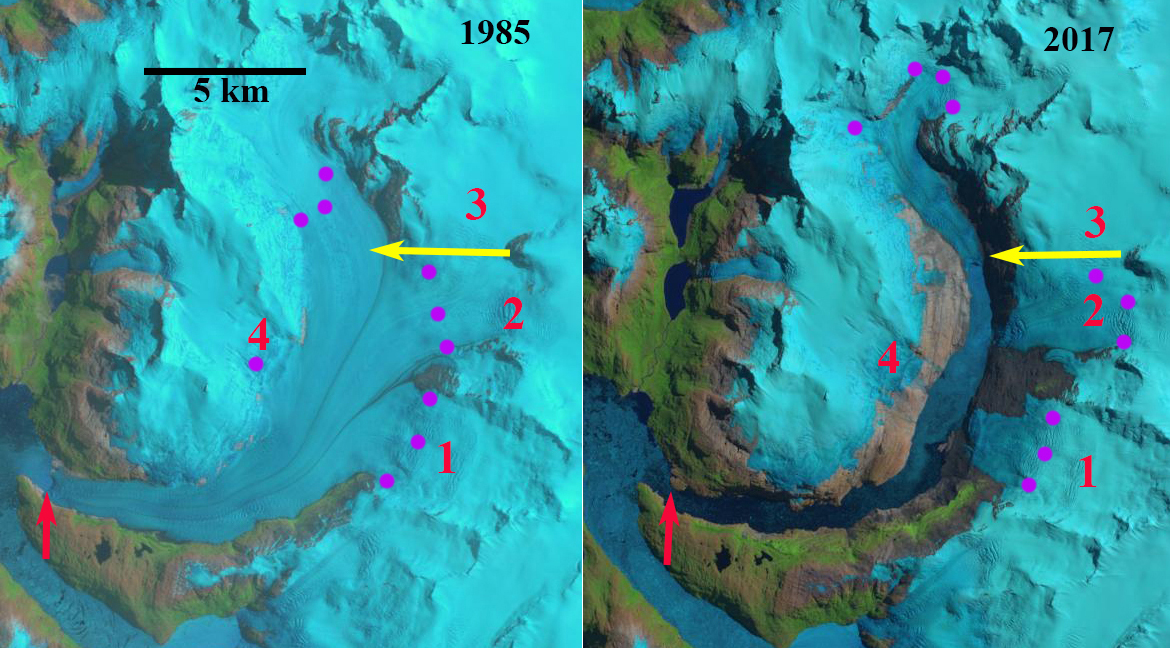
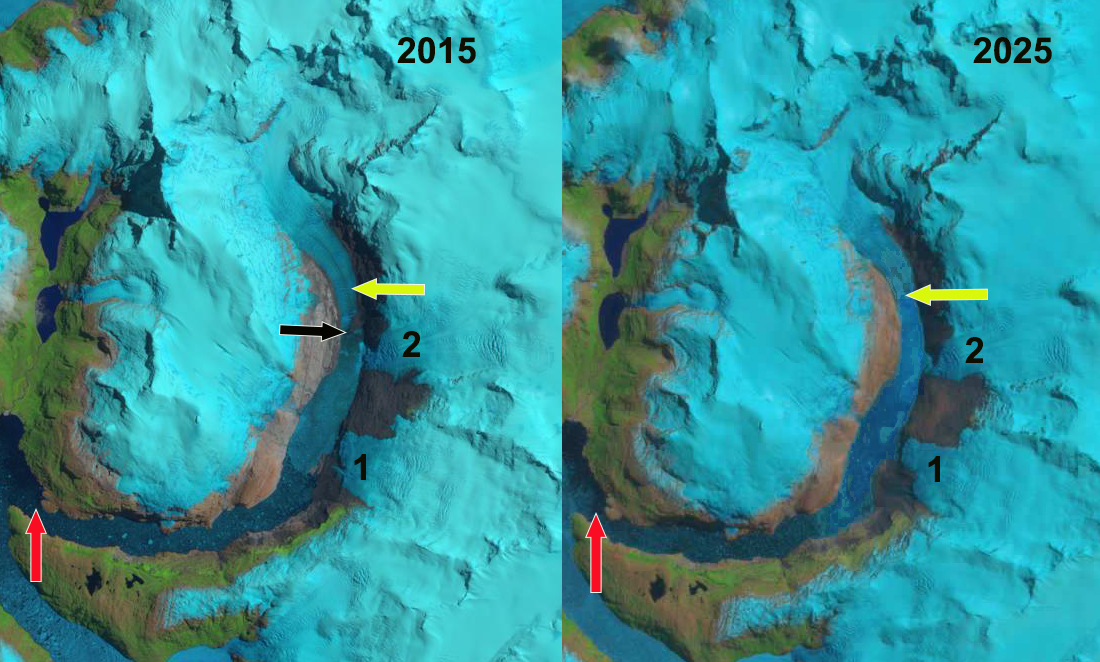
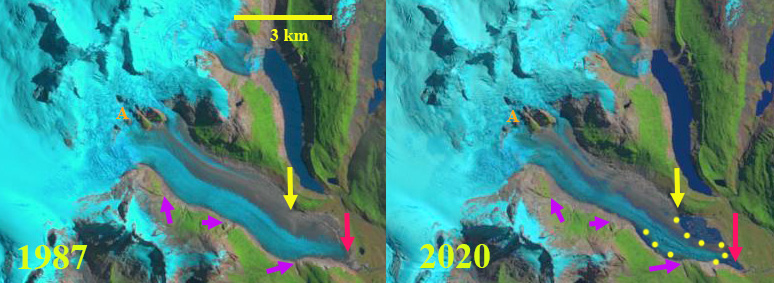
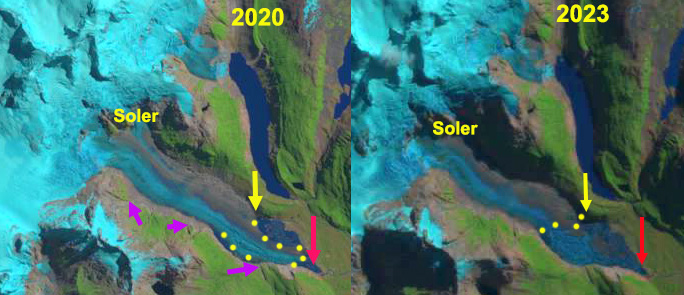
Bernardo Glacier in Landsat images from 1986 and 2021 illustrating retreat at the southern (S), middle (M) and northern (N) terminus respectively. Red arrows are 1986 terminus locations, yellow arrows are 2021 terminus locations. Separation from Tempano (T) occurs at southern terminus, while lake expansion occurs at M and N.
Bernardo Glacier is an outlet glacier on the west side of the Southern Patagonia Icefield (SPI) that currently ends in an expanding proglacial lake system, with three primary termini. The northern terminus retreated 4.1 km from 1986-2021 leading to an 8.7 km² lake expansion. Total lake area which had remained filled during this period was Their was a significant drainage of the lake at the north terminus that by late summer of 2023 had left 8 km² of lake bed exposed, and as spring arrives in 2023 has yet to refill. Davies and Glasser (2012) indicate that over the last century the most rapid retreat was from 2000 to 2011. Willis et a (2012) note a thinning rate of 3.4 meters per year during this period of the Bernardo Glacier region, which drives the retreat. Eñaut Izagirre conducted fieldwork in this area in 2019 and provided two images from the middle terminus of Bernardo Glacier, see below.

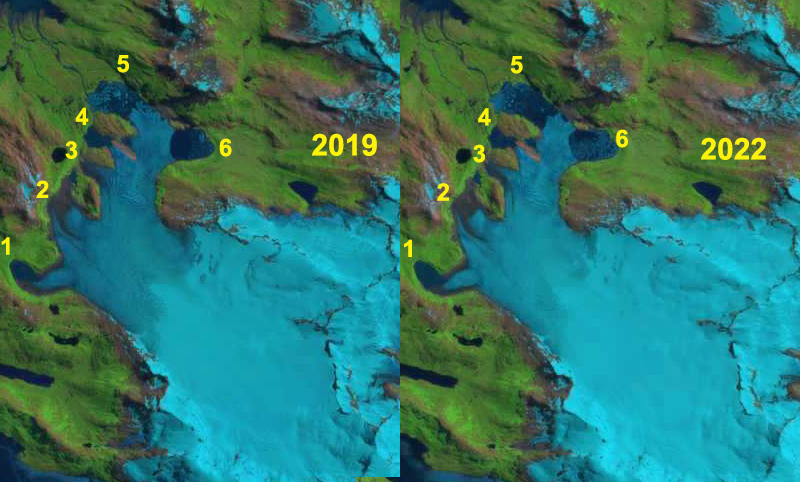
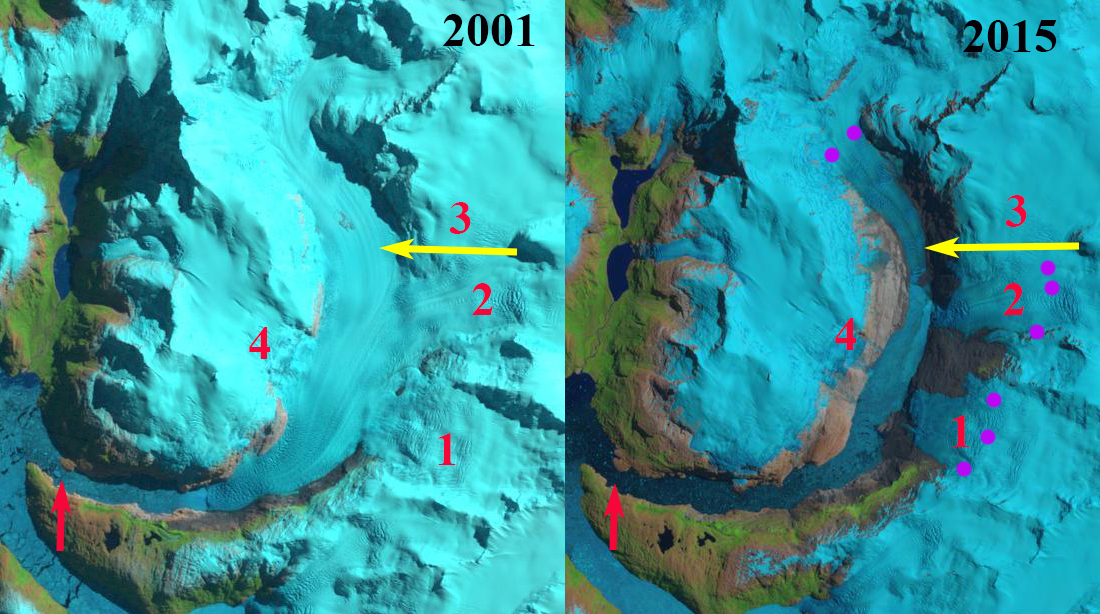
Bernardo Glacier in Landsat images from 1998 and 2020 illustrating retreat at the southern (S), middle (M) and northern (N) terminus respectively. Proglacial lakes not yet signficant in 1998, expansive by 2020. Red arrows are 1986 terminus locations, yellow arrows are 2021 terminus locations. Separation from Tempano (T) occurs at southern terminus, while lake expansion occurs at M and N.
In 1986 Bernardo the southern terminus of the glacier was in tenuous contact with Tempano Glacier. The middle terminus primarily ended on an outwash plain with a fringing proglacial lake developing. The northern terminus had retreated a short distance south from a peninsula that had acted as a pinning point. A small lake developed completely separating Bernardo Glacier and Tempano Glacier. By 1998 the northern terminus had retreated into the wider,deeper portion of the lake basin that was now filled with icebergs. In 2015 the northern terminus had retreated 3.5 km since 1986. By 2021 the northern terminus had retreated 4.1 km. This led to a 7.8 km² lake expansion at the northern terminus, with a total area of 17.5 km². On October 2, 2022 the water level had dropped some, with lake area falling slightly. The lake continued to fall through the summer season of 2023. The lake has not refilled through the winter and into the spring of 2023, with the lake having an area of 9.5 km², and 8 km² of lake bed still exposed. Will the lake refill this summer or drop even further? Gourlet et al (2016) identify Bernardo Glacier as having thinner ice than other large outlet glaciers such Jorge Montt or O’Higgins, which helps lead to rapid terminus change. Other glaciers experiencing singificant retreat in this region of the Souther Patagonia Icefield include Oriental Glacier, Lucia Glacier, and Ofhidro Glacier.

Southern Andean huemel an endemic deer on the foreland beyond Bernardo Glacier (photograph from Eñaut Izagirre).

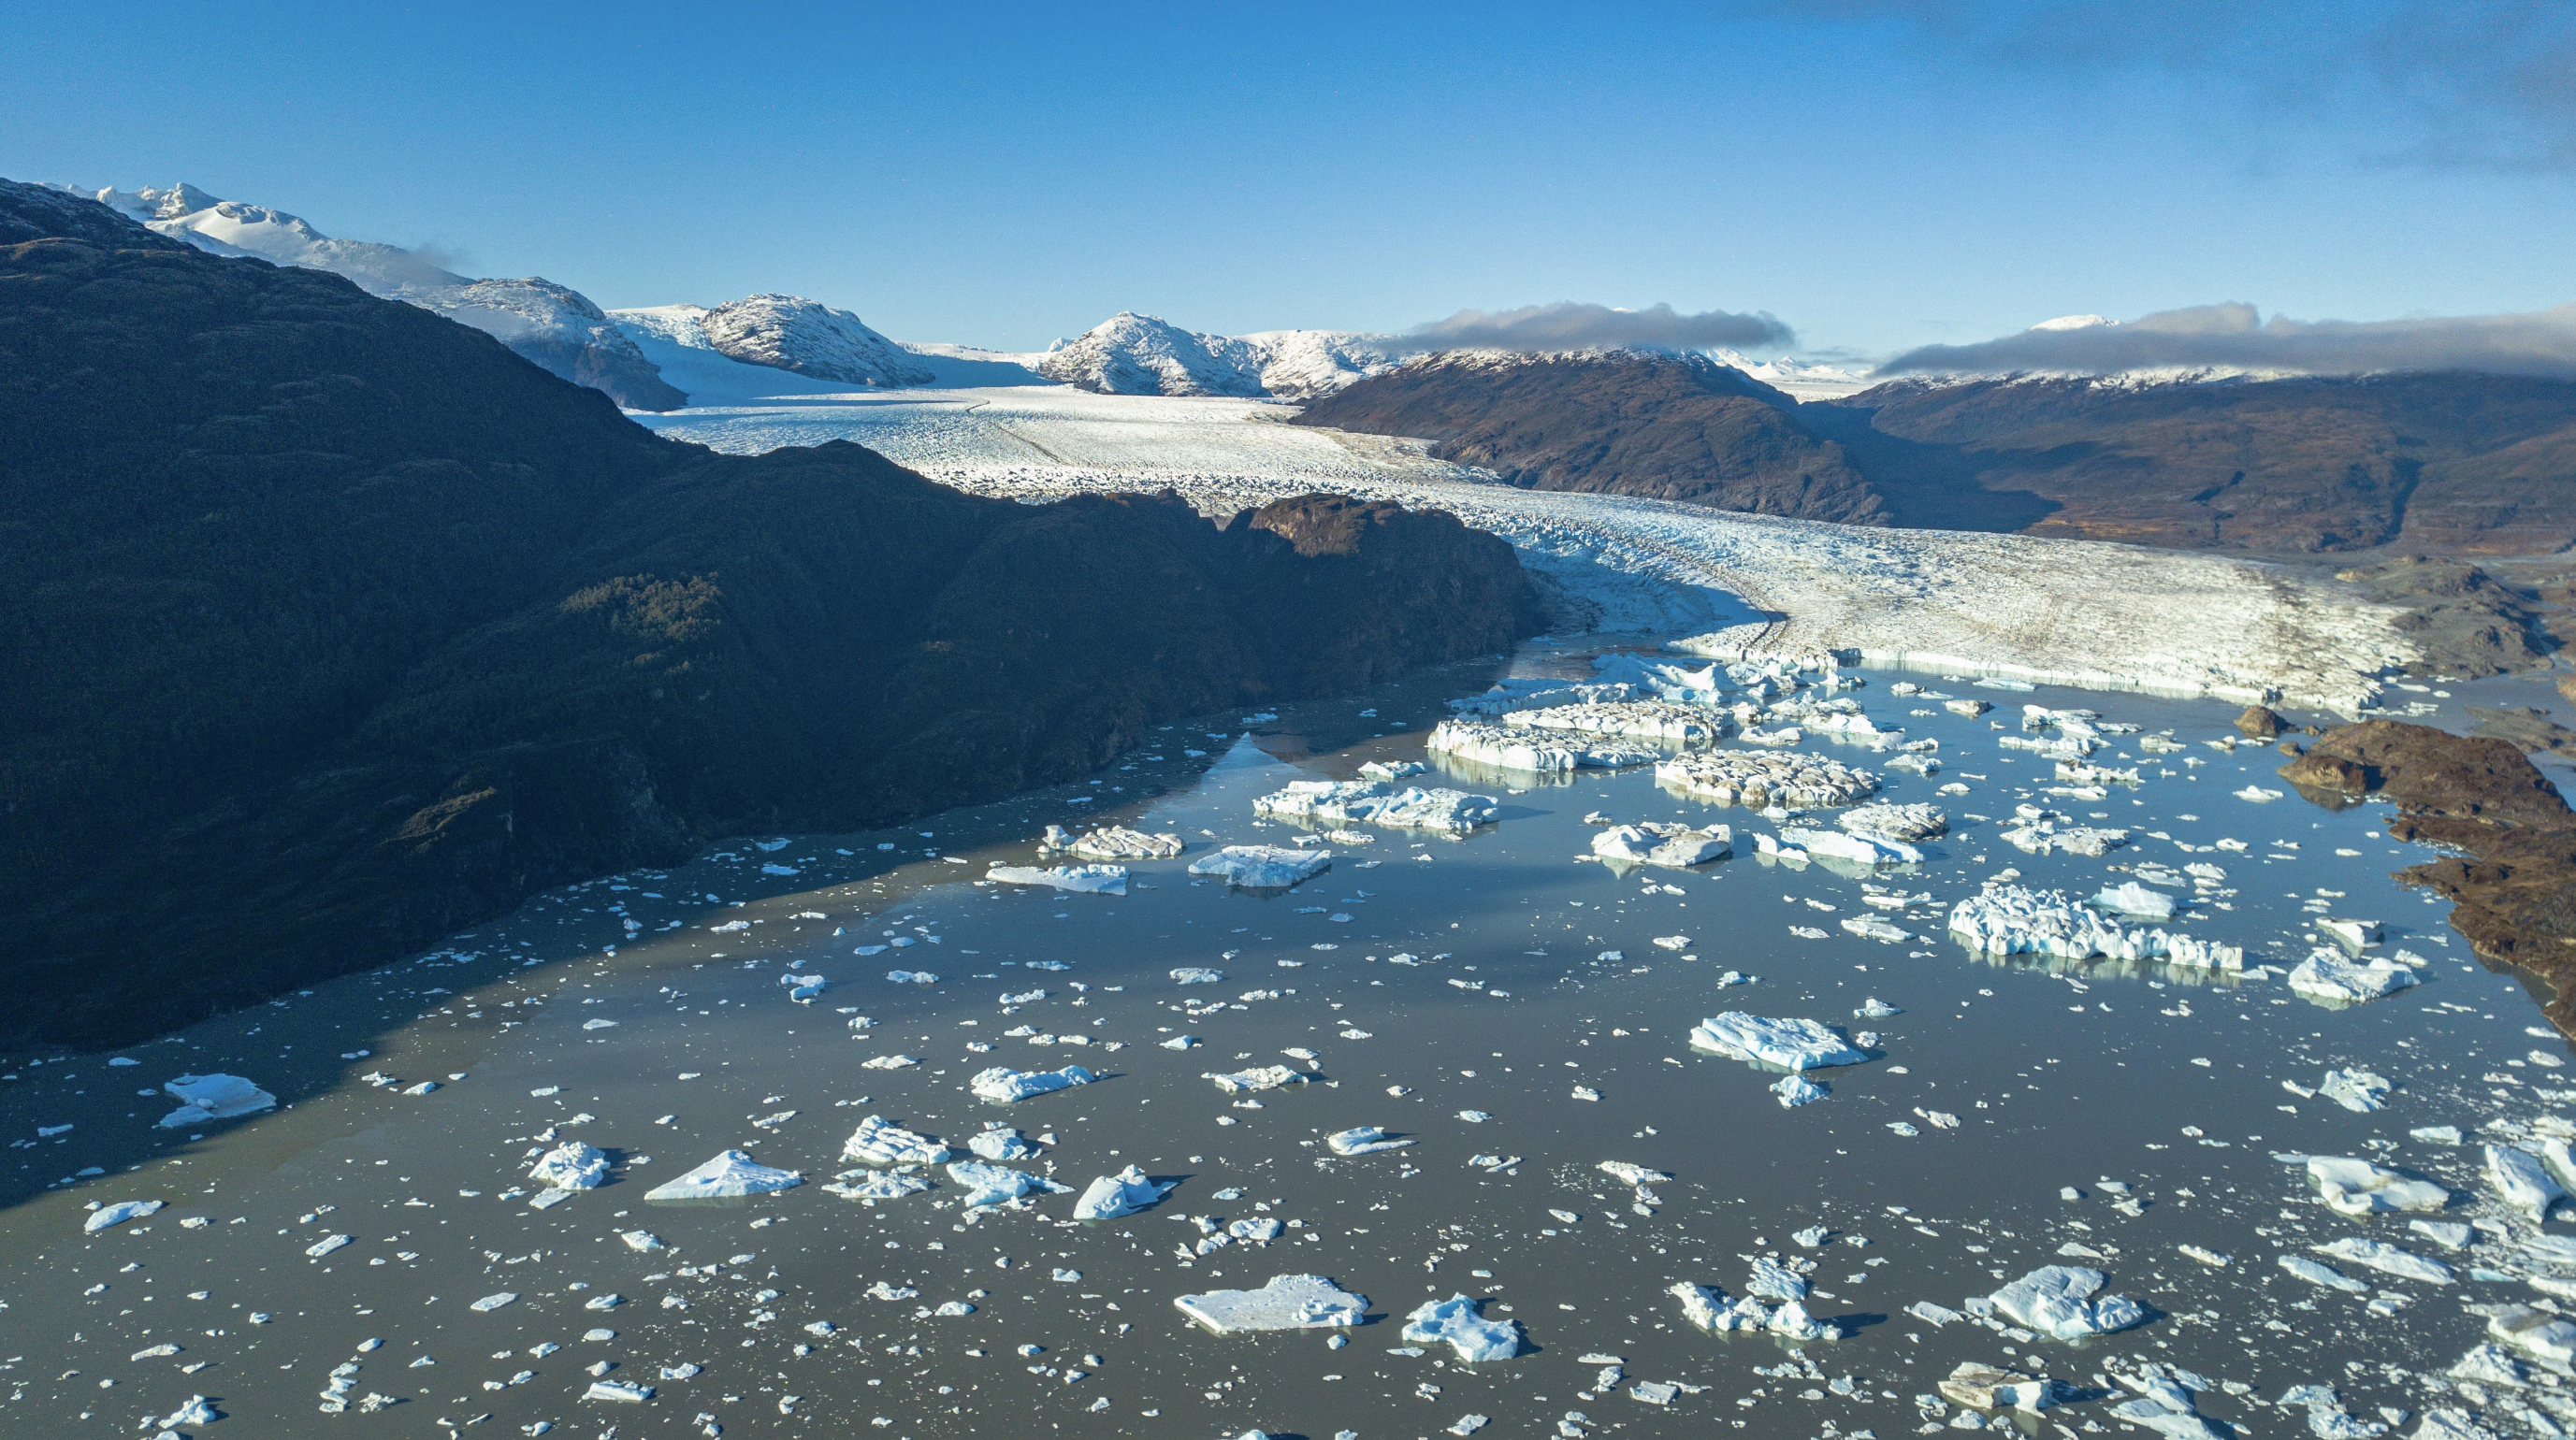
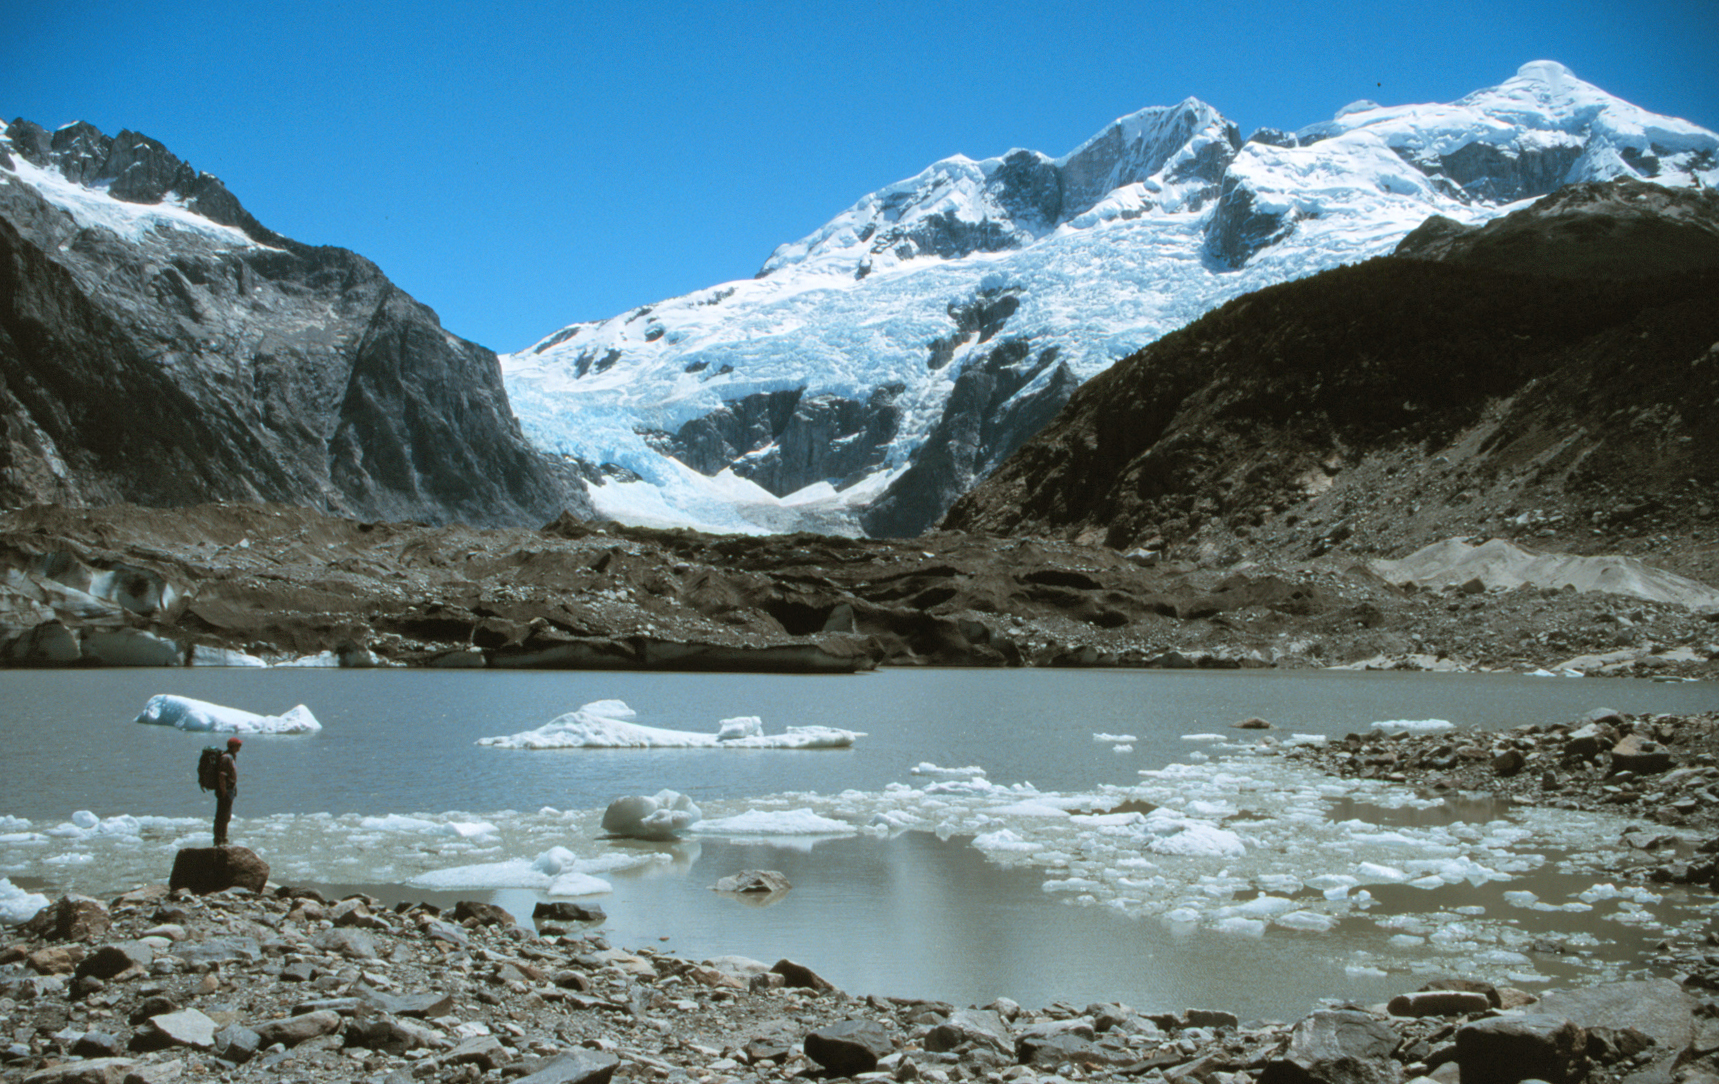
Middle terminus of Bernardo Glacier in 2019 taken by Eñaut Izagirre who considers this a condor-view
Sentinel images illustrating drop in lake level and resulting lake drainage from Oct. 2, 2022 to Sept. 17, 2023.

Retreat of Bernardo Glacier in Landsat images from 2003 and 2015.