Sholes Glacier, WA and a Cascade of Ologies

Watercolor painting of Sholes Glacier. The small figure is at the current terminus of the glacier, and the photo that inspired this painting was taken from where the glacier used to end about 35 years prior. By Jill Pelto

Sholes Glacier is on the northeast flank of Mount Baker, WA.  We have spent the last 32 years completing detailed measurments on this glacier that has revealed a story of glacier mass balance loss, thinning, retreat, declining area, and a cascade of other consequences impacting other “ologies” beyond the glacier.  If you are intrigued by many ologies, the Podcast by Allie Ward will be inspiring as it was to this title.

Sholes Glacier and stream gage station.  We have constructed a rating curve for this station, that the Nooksack Indian Tribe maintains (Grah and Beaulieu, 2013).

The climatology of the region has shifted, with one key change being more frequent and intense heat waves.  Glaciers and heat waves just are not compatible. Using daily maximum temperatures for the 1981-2021 period for Mount Baker from ERA5 temperature reanalysis, completed by Tom Matthews at Loughborough University, indicates that there have been 83 days where the maximum temperature exceeded 12°C, an average of 2 days/year.  In the last five years there have been 22 days exceeding 12°C,  over 4 days/year. There have been 16 days during 1981-2021 period when the maximum temperature exceeded 14°C, 75% (12) of these have been in the last five years.

Probing snow depth on Sholes Glacier in 2014, this is completed annually at a fixed network of over 100 locations.

In terms of glaciology the result of the climate shift is that the glacier has lost 25-30% of its volume from 1990-2021. The terminus has retreated 155 m while the area has decreased by 25%.  The changes have been most rapid in the last 8 years. The two years of largest mass loss were 2015 and 2021. We measure both melting (ablation) on the glacier and runoff from the glacier. This combination allows determination of the amount of glacier runoff. During 24 heat waves in the region from 2009-2021 mean daily ablation during the heat waves has ranged from 4.5-7.2 cm w.e./day (w.e.=water equivalent).  The highest rate of 7.2 cm was during the June 26-July 1, 2021 period.

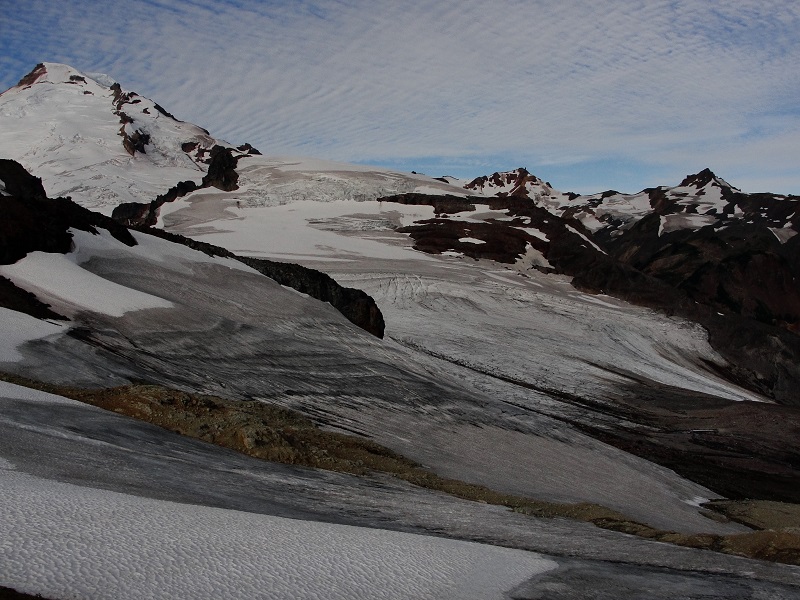
Sholes Glacier in 2015 exhibiting the darkening of the surface that occurs in high melt years, increasing melt rates. How much black carbon and algae is part of this darkening is the research of Alia Khan (WWU).

For a glacier to be in equilibrium or have a positive mass balance the majority of the glacier must be in the accumulation zone, snow covered at the end of the summer, that is an accumulation are ratio (AAR) greater than 50%.  Pelto and Brown (2012) noted that for Mount Baker an AAR of 60% is required for a break even balance for the year.  From 2013-2021 the average accumulation area ratio has been 35%.  For Sholes Glacier if 50% of the glacier is exposed ice and firn in early August that increases mass loss.  The ice and firn for the same weather conditions have a 30-40% higher melt rate than the snowpack.  An early season heat wave strips the snow off earlier exposing the darker faster melting glacier surfaces for longer further increasing mass loss, note image above.

Sholes Glacier in 2021. The glacier has retreated 170 m from 1990-2021, the terminus in 1990 is approximately whre the goats are crossing the stream.

Hydrology downstream in Wells Creek and the North Fork Nooksack River is changing in part because of the changes in glacier runoff. Glacier runoff is a major source of streamflow during the summer low-flow season and mitigates both low flow and high water temperatures (Pelto, 2015). This is particularly true during summer heat wavesbut this ability has been diminishing in the region (Moore et al 2020)  For the last 37 summers we have been in the field monitoring North Cascade glaciers response to climate change including during heat waves (Pelto, 2018). In the last decade we have made synchronous observations of glacier ablation and stream discharge immediately below Sholes Glacier, Mount Baker (Pelto, 2015). This in conjunction with observed daily discharge and temperature data from the USGS stations on the ~6% glaciated North Fork Nooksack River (NFN) and the unglaciated South Fork Nooksack River (SFN), contrasts and quantifies the ameliorating role of glacier runoff on discharge and water temperature during 24 late summer heat wave events.

Measuring discharge below Sholes Glacier in 2016.

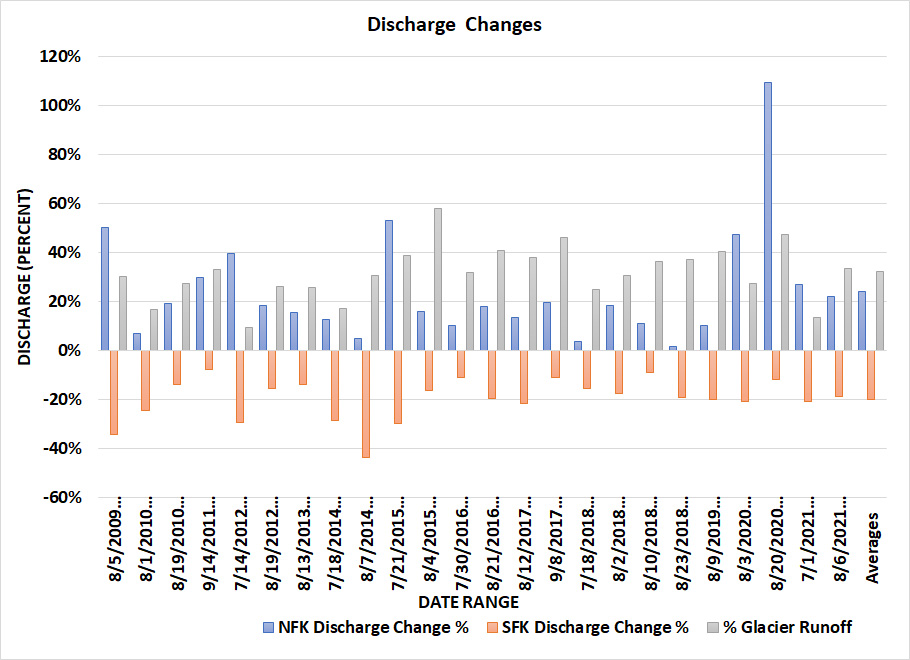
Sholes Glacier and ablation measurements on Sholes Glacier indicate daily ablation ranging from 5-6 cm/day, which for the NFN currently yields 9-11 cubic meters/second. This is 40-50% of the August mean discharge of 24 cubic meters/second, despite glaciers only covering 6% of the watershed. In the unglaciated SFN warm weather events generated a mean stream temperature change of +2°C, only 1 event in the NFN generated this rise and the mean was +0.7°C. Durng the June 2021 heatwave from June 21-29 maxium daily stream temperature in SFN warmed 3°C, vs 0.8°C for NFN.  This illustrates that a greater proportion of snowmelt, which NFN recieves, has limited the temperature rise.  Discharge rose at least 10% in 20 of the 24 events in the NFN with an average increase of 24%.  In the SFN all 24 events led to a decreased discharge with an average decrease of 20%. The primary response to these summer heat waes is increased discharge in the heavily glaciated NFN, and increased stream temperature in the unglaciated SFN.

Discharge change during heat waves in South Fork (decreases) and North Fork Nooksack River  (increases) above.  Below temperature change during heat waves in South Fork (significant rise) and North Fork Nooksack River (small rise).

Glacier runoff is a product of glacier area and melt rate.  Overall glacier runoff declines when area reductions exceed, ablation rate increases.  This has already occurred in the NFN and now glacier runoff is declining (Pelto, 2015). The measured ablation rate is applied to glaciers across the NFN watershed, providing daily glacier runoff discharge to the North Fork Nooksack River.  For the NFN glacier runoff production was equivalent to 34% of the total discharge during the 24 later summer heat wave events. As the glaciers continue to retreat the NFN will have a declining mitigation of heat waves for discharge and temperature and trend towards the the highly sensitive SFN where warm weather leads to declining streamflow and warming temperatures.

Nooksack Falls heavily glacier fed.

Aquatic ecology in glaciated watershed in turn is impacted. Glaciers are important in maintaining sufficient discharge and stream temperature that are critical for salmon in the North Fork Nooksack. Some cold-water trout and salmon species are already constrained by warm water temperatures and additional warming will result in net habitat loss (Isaak et al 2012). In the Fraser River and Thompson River, BC fish community thresholds were obsrved for mean weekly average temperatures of about 12°C and again above 19°C (Parkinson et al 2015). Below 12°C the community were characterized by bull trout and some cold water species, between 12°C and 19°C by salmonids and sculpins and above 19°C by minnows and some cold water salmonids (Parkinson et al 2015). These thresholds indicated small temperature changes can be expected to drive substantial changes in fish communities. During the 24 warm weather events noted in the North Fork only two events exceeded 12°C, while in the South Fork 15 of the events exceeded 19°C.  This suggest that both rivers are near a threshold that could alter the fish community.

In the North Fork Nooksack the number of returning chinook is divided into natural and hatchery spawned salmon. The Chum and Coho salmon data for the Nooksack River during the 1999-2013 interval indicate there are two salmon population peaks for each species. The early peak is in 2002 and the second peak occurs in 2010 (Washington Dept. Fish & Wildlife, 2020). Overall numbers have not sustained an increase and remain endangered.

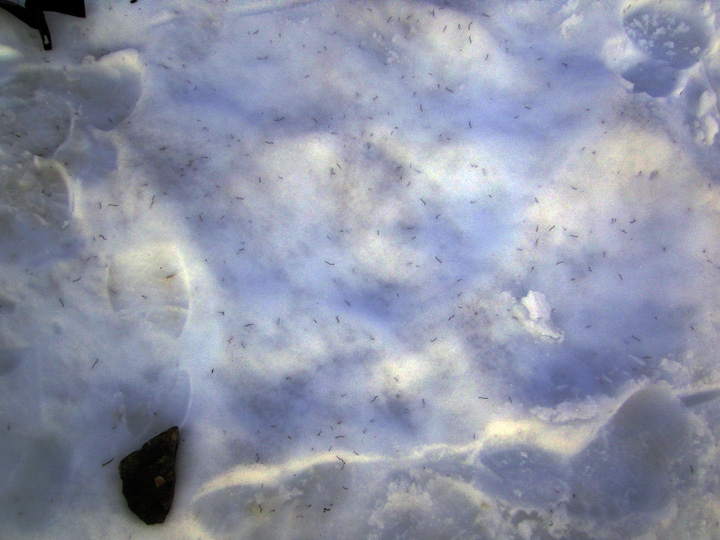
Ice Worm counts as the sunsets, 110 worms per square meter.

The climatology and glaciology has been difficult for ice wormology  On the glacier itself ice worm population density surveys conducted annually indicate the density of ice worms has decreased since 2000 and that even 10 m beyond the edge of the glacier on snowpack they do not exist.  This combined with the reduction in glacier area indicate population decline of ice worms.

In 2009 we observed the largest goat herd 62 goats (13 kids), some of them seen here below Sholes Glacier.

The climatology has been more favorable in terms of Goatology.We have conducted annual mountain goat surveys in the Ptarmigan Ridge-Sholes Glacier region each years since 1984.  Populations stayed steady from 1984-2000, before rising dramatically through 2010. The difficult winters of 2011 and 2012 reduced the population, followed by a recovery up to 2021.
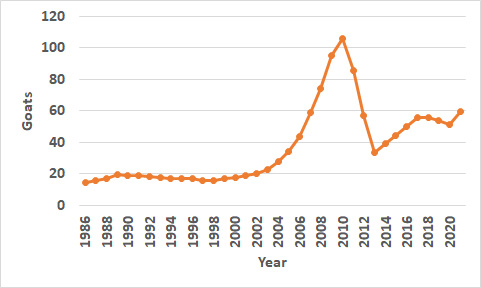
Three year running mean of mountain goat census conducted each summer while we are working on Ptarmigan Ridge, Sholes Glacier and Rainbow Glacier.


Observing Glacier Runoff Changes Under the Same Weather Conditions


View of Sholes Glacier on August 8th in 2015 left and 2017 right.  Note difference in ratio of snow surface to ice surface exposed. 

Sholes Glacier is at the headwaters of Wells Creek in North Fork Nooksack River watershed in Washington.  We have been measuring the mass balance of this glacier annually since 1990 and runoff in detail since 2012 (Pelto, 2015).  Glacier runoff in this watershed during late summer frequently provides more than a third of all runoff for the watershed, this occurred on 37 days in 2015 and 19 days in 2016.  This water is critical for local hydropower, irrigation and fall salmon runs. We measure glacier runoff all summer long directly at a stream gage 150 m from the glacier.  We also measure ablation directly on the glacier.  The amount of runoff is dependent on the area exposed for melting, glacier area in this case, the melt rate which is largely determined by temperature and the surface type, snow and ice having different melt rates.

A typically reliable method to calculate glacier runoff is a degree day model.  This model is based solely on daily observed temperature and the glacier surface type. The degree day melt rate factor for snow and for ice are different.  Based on 27 years of ablation measurements on the glacier the melt factors for snow is 0.0045 m w.e. d-1C-1 and for ice 0.0060 m w.e. d-1C-1  which falls within the range of temperate glacier observations (Hock, 2003).  If you multiply this result by the area of the glacier the glacier runoff is determined. 


For a specific day the determination of runoff looks like:

Glacier Runoff=( 14 C * 0.0045 m w.e. d-1C-1)(550,000 m2) + (14C*0.0060 m w.e. d-1C-1)(100,000m2)

This equals 43,000 m3 for the day or 0.5 m3/second from Sholes Glacier.  In fact our measurement of discharge on this day was 41,330 m3 and the observed melt rate was within 5% of the calculated amount.  In August the average streamflow in the North Fork Nooksack at the USGS gage is 22 m3/second.  We have observed that ablation rates on Sholes Glacier are consistent with those on other glaciers in the watershed.  For the watershed as a whole the glacier runoff on this particular day would be 9.4 m3/second or ~40% of mean daily August runoff provided by glacier melt. 
It has been interesting in the case of the Sholes Glacier to observe how different the runoff rate/volume is for the same weather conditions depending solely on changes in snow and ice cover area.  Note in the images above from 2015 and 2016 the change in the percent of the glacier that is snowcovered.  Also note the difference below from 2014 and 2017.  Given the same weather conditions the melt rate formula suggest that ice covered areas will yield 33% more runoff.  This in fact has been the case with observed runoff on a 14 C day in 2015 yielding 30% more runoff than on the a 14 C day in 2017.  The difference is no ice exposed in 2017 and 85% of the glacier area being bare ice on the observed day in 2015.  The change during a melt season as indicated by snowcover change in 2016 from August 16th to Sept. 8th, illustrates the importance of understanding the changing distribution of snow and ice on the glacier on a weekly basis for determining glacier runoff. 

On 8/8/2014 the glacier was 85% snowcovered

On 8/8/2015 the glacier was 15% snowcovered

On 8/8/2016 the glacier was 97% snowcovered

On 8/8/2017 the glacier was 100% snowcovered

View of Sholes Glacier on August 8th in 2014 left and 2016 right.  Note difference in ratio of snow surface to ice surface exposed. 

Jill Pelto and Andrew Hollyday measuring flow below Sholes Glacier.
Pete Durr Probing snowpack on Sholes Glacier

Sholes Glacier August, 16 2016
Sholes Glacier Sept., 8 2016

2016 Field Season Results-North Cascade Glacier Climate Project

For Mount Baker, Washington the freezing level from January-April 20 was not as high as the record from 2015, but still was 400 m above the long term mean. April 1 snowpack at the key long term sites in the North Cascades was 8% above average. A warm spring altered this, with April being the warmest on record. The three-four weeks ahead of normal on June 10th, but three weeks behind 2015 record melt.  The year was poised to be better than last year, but still bad for the glaciers.  Fortunately summer turned out to be cooler, and ablation lagged.  Average June-August temperatures were 0.5 F above the 1984-2016 mean and 3 F below the 2015 mean. The end result of our 33rd annual field season assessing glacier mass balance in the North Cascades quantifies this. Our Nooksack Indian Tribe partners again installed a weather and stream discharge station below Sholes Glacier.

The primary field team consisted of myself, 33rd year, Jill Pelto, grad student UMaine for the 8th year, Megan Pelto, Chicago based illustrator 2nd year, and Andrew Hollyday, Middlebury College.  We were joined by Tom Hammond, NCCC President 13th year, Pete Durr, Mount Baker Ski Patrol, Taryn Black, UW grad student and Oliver Grah Nooksack Indian Tribe.  The weather during the field season Aug. 1-17th was comparatively cool.

Mass Balance: Easton Glacier provides the greatest elevation range of observations.  On Aug 2, 2016 the mean snow depth ranged from 0.75 m w.e. at 1800 m to 1.5 m w.e. at 2200 m and 3.0 m w.e. at 2500 m. Typically the gradient of snowpack increase is less than this.  There was a sharp rise in accumulation above 2300 m.  This is the result of the high freezing levels.  The mass balances observed fit the pattern of a warm but wet winter.  The high freezing levels left the lowest elevation glaciers Lower Curtis and Columbia Glacier with the most negative mass balance of approximately 1.5 m. The other six glaciers had negative balances of -0.6 to -1.2 m. This following on the losses of the last three years has left the glaciers with a net thinning of 6 m, which on glaciers averaging close to 50 m is a 12% volume loss in four years.  We anticipate with that this winter will be cooler and next summer the glaciers happier.  We will back to determine this.

Snowpack loss from Aug. 5-Sept. 22 is evident in the pictures below on Sholes Glacier.  Detailed snow depth probing, 112 measurements, of the glacier on August 5th allows determination of ablation as the transient snow line traverses probing locations from Aug. 5. GPS locations were recorded along the edge of blue ice on each of the dates. Ablation during this period was 2.15 m.


Terminus Change: We measured terminus change at several glaciers and found that a combination of the 2015 record mass balance loss and early loss of snowcover from glacier snouts in 2016 led to considerable retreat since August 2015.  The retreat was 25 m on Easton Glacier, 20 m on Columbia Glacier, 20 m on Daniels Glacier, Sholes Glacier 28 m, Rainbow Glacier 15 m, Lower Curtis Glacier 15 m.  The main change at Lower Curtis Glacier was the vertical thinning, in 2014 the terminus was 41 m high, in 2016 the terminus seracs were 27 m high.  The area loss of the glaciers will continue to lead to reduced glacier runoff. We continued to monitor daily flow below Sholes Glacier which allowed us to determine that in August 2016 45% of the flow of North Fork Nooksack River came from glacier runoff.  This is turns has impacts for the late summer and fall salmon runs.


Thirty-third Annual North Cascade Glacier Climate Project Field Season Underway

fig8-1
Base Map of the region showing main study glaciers, produced by Ben Pelto.

From President Reagan to President Obama each August since 1984 I have headed to the North Cascade Range of Washington to measure the response of glaciers to climate change.  Specifically we will measure the mass balance of nine glaciers, runoff from three glaciers and map the terminus change on 12 glaciers. The data is reported to the World Glacier Monitoring Service.  Three glaciers that we have monitored annually have disappeared since 1984.

In 2016 for Mount Baker, Washington the freezing level from January-April was not as high as the record from 2015, but still was 400 m above the long term mean. The snowpack on June 1st was three weeks behind last year’s record melt, but still three to four weeks of head of normal. July has been exceptionally cool reducing this gap. With all the snow measurement stations losing snowcover by July 1, the gap is uncertain until we arrive on the glaciers. This will not be a good year, but will be a significant improvement over last year, likely more in the 2012 or 2013 category.  Each location is accessed by backpacking in and camping in tents.

We will first travel north to Mount Baker and the Easton Glacier, we will be joined by Oliver Lazenby, Point Roberts Press.  We will then circle to the north side where I expect we will be joined by Jezra Beaulieu and Oliver Grah, Nooksack Indian Tribe.  Jen Lennon from the Sauk-Suiattle Tribe and Pete Durr, Mount Baker Ski Patrol are also planning to join us here.   When we head into Columbia Glacier Taryn Black from U of Washington will join us. The field team consists of Mauri Pelto, 33rd year, Jill Pelto, UMaine for the 8th year, Megan Pelto, 2nd year, and Andrew Hollyday, Middlebury College.  Tom Hammond, 13th year will join us for a selected period.

[ngg_images source=”galleries” container_ids=”38″ display_type=”photocrati-nextgen_basic_imagebrowser” ajax_pagination=”1″ template=”/nas/wp/www/sites/blogsorg/wp-content/plugins/nextgen-gallery/products/photocrati_nextgen/modules/ngglegacy/view/imagebrowser-caption.php” order_by=”sortorder” order_direction=”ASC” returns=”included” maximum_entity_count=”500″]

Aug.   1:  Hike into Easton Glacier.
Aug.   2:  Easton Glacier
Aug.   3:  Easton Glacier
Aug.   4:  Hike Out Easton Glacier, Hike in Ptarmigan Ridge
Aug.   5:  Sholes Glacier
Aug.   6:  Rainbow Glacier
Aug.   7:  Sholes Glacier and/or Rainbow Glacier
Aug.   8:  Hike out and into Lower Curtis Glacier
Aug.   9:  Lower Curtis Glacier
Aug. 10: Hike out Lower Curtis Glacier- Hike in Blanca Lake Mail Pickup Maple Falls, WA 98266
Aug. 11:  Hike in Columbia Glacier
Aug. 12:  Columbia Glacier
Aug. 13:  Hike out Columbia Glacier; Hike in Mount Daniels
Aug. 14:  Daniels and Lynch Glacier
Aug. 15:  Ice Worm Glacier
Aug. 16:  Ice Worm Glacier, Hike out Mount Daniels-Hike out

Harris Glacier Retreat, Kenai Fjords, Alaska

harris compare

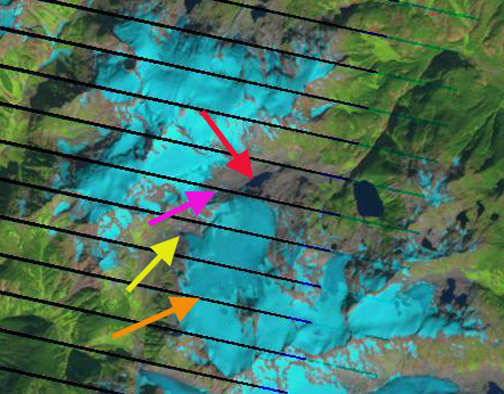
Landsat images of Harris Glacier from 1986 and 2015.  The red arrow indicates 1986 terminus location, yellow arrow the 2015 terminus position.  The orange arrow indicates a key eastern tributary and the pink arrow a smaller eastern tributary. 

Harris Glacier flows from the northwest corner of the Harding Icefield, Alaska and it drains into Skilak Lake.  The glaciers that drain east toward are in the Kenai Fjords National Park, which has a monitoring program.  Giffen et al (2014) observed the retreat of glaciers in the region. From 1950-2005 all 27 glaciers in the Kenai Icefield region examined  are retreating. Giffen et al (2014) observed that Harris Glacier (A Glacier) retreated 469 m from from 1986-2005.  Here we examine Landsat imagery from 1986-2015 to illustrate the retreat of this glacier and other upglacier changes. The glacier supplies meltwater to Skilak Lake which is a critical salmon habitat for the Kenai. Chinook Salmon spawn on a section of the Kenai River between Kenai Lake and Skilak Lake. With Skilak Lake being the resulting home for ninety percent of the salmon fry for the Kenai River, and with the most of any nursery in the Cook Inlet area. Escapements of chinook in the Kenai River exceed 50,000 annually in two runs (Heard et al 2007).

In 1986 the glacier extended to an elevation of 590 m, on the east side of the glacier there were two smaller tributaries reaching the glacier at the orange and pink arrow.  By 2015 the terminus had retreated 600 m from 1986.  The eastern tributary at the pink arrow had detached from the main glacier.  The tributary at the orange arrow still reaches the main glacier, but the blue ice extent after joining the glacier has diminished significantly. Below is a closeup of the terminus from 1996 and 2015 illustrating a 225 m retreat and associated thinning.  It is also interesting to note the prominent ash layer has shifted little.  This suggests the terminus area is relatively stagnant. There is no active crevassing in the lower 1 km suggesting retreat will be ongoing.   In 1989 the snowline is at 975 m whereas in 2014 the snowline is at 1125 m.  This higher snowline is too high to maintain the glacier. The snowline in 2015 was again above 1100 m, though it is lower in the mid-August image at 1050 m. The retreat of this glacier is less than neighboring glaciers such as Grewingk, Pederson and Bear Glacier that have calving termini.

harris snowline

Landsat images from 1989 and 2014, with the snowline indicated by purple dots. 

harris terminus

Terminus of Harris Glacier in Google Earth images from 1996 and 2015.  Margin with purple dot, purple arrow indicates 1996 terminus lcoation, with a 225 m retreat by 2015. Note the prominent ash layer

Shamrock Glacier, Alaska Loses Terminus Tongue

shamrock glacier compare
Shamrock Glacier comparison in 1987 and 2014 Landsat images. Red arrow 1987 terminus, yellow arrow 2014 terminus, purple arrows upglacier thinning and purple dots the snowline. The terminus tongues extending into the lake has been lost.

Shamrock Glacier flows north from the Neacola Mountains into Chakachamna Lake in the Lake Clark National Park of Alaska. This lake is transited by several species of salmon, mainly sockeye, heading into spawning  areas upriver. The lake had been the site of a proposed hydropower plant, that would not have required building of a dam, but this project is currently not being developed. The National Park Service completed a Southwest Alaska Network mapping project that identified the changes of glaciers in the region. Lake Clark NP has 1740 glaciers which have lost 12% of their total area from 1950 to 2009 (Loso et al, 2014). Here we examine Landsat imagery from 1987 to 2014 to identify recent change of Shamrock Glacier.
shamrock glacier profile
July 2015 image looking across Shamrock Lake to Shamrock Glacier, taken by Jerry Pillarelli, note he has many more gorgeous images of area. The trimline on the far side of the glacier between sediment and vegetation indicates the 1950 margin. There is an elevation step several hundred meters inland of the terminus indicating Shamrock Lake will expand little.

In 1987 Shamrock Glacier had receded from a terminal moraine in Chakachamna Lake that it had terminated on in the 1950’s map. The new proglacial lake was less than 500 m across. The snowline was at 1200 m. In 2000 seen below the snowline was at 1350 m, and the terminus had narrowed more than it had retreated. By 2014 the terminus had retreated 900 m leaving the new Shamrock Lake within Chackachamna Lake. The new Shamrock Lake has an area of 4 square kilometers. This is the majority of the loss in glacier area since 1950 as well. In 2014 the snowline is quite high at 1450 m. A snowline that is consistently above 1300 m will drive continued retreat. Thinning upglacier is evident with expanded bedrock areas adjacent to the glacier margin above 1200 m at the purple arrows, indicating the snowline has been consistently higher than this. The retreat is similar to other glaciers in the region South Sheep Glacier, Sovereign Glacier and Fourpeaked Glacier.  With the glacier retreating out of the lake basin soon, the rate of retreat should decline.

shamrock glacier 2000
2000 Landsat image

shamrock glacier ge 2013
2013 Image of Shamrock Glacier, Shamrock Lake and Chakachamna Glacier.


Murchison Glacier, New Zealand Rapid Retreat Lake Expands 1990-2015

murchison compare

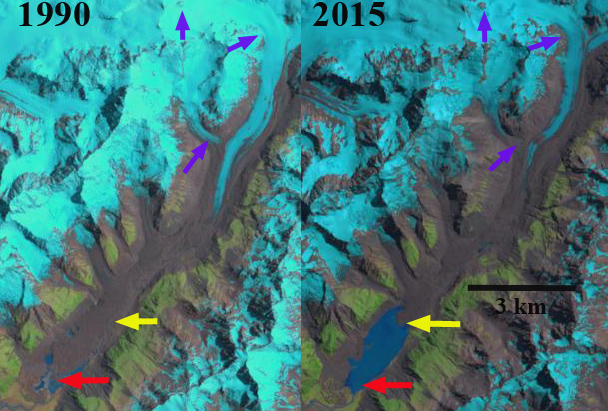
Murchison Glacier change revealed in Landsat images from 1990 and 2015.  The red arrow indicates 1990 terminus location, the yellow arrow indicates 2015 terminus location and the purple arrow indicates upglacier thinning.

Murchison Glacier is the second largest in New Zealand.  The glacier drains south in the next valley east of Tasman Glacier and terminates in a lake that is rapidly developing as the glacier retreats. The lower 6 km section  is debris covered, stagnant, relatively flat and will not survive long. There was not a lake in the 1972 map of the region.  In 1990 the newly formed lake was limited to the southeast margin of the terminus . From 1990 to 2015 the terminus has retreated 2700 m. A rapid retreat will continue as 2010, 2013 and 2015 imagery indicate other proglacial lakes have now developed 3.5 km above the actual terminus. These lakes are glacier dammed and may not endure but do help increase ablation, and in the image below show a glacier that is too narrow to provide flow to the lower 3.5 km. The demise of the lower section of this glacier will parallel that of Tasman Glacier.  The expanding lake will continue to enhance the retreat in part by sub-aqueous calving noted by Robertson et al (2012) on nearby glaciers. The increased retreat has been forecast by the NIWA and Dykes et al (2011). The glacier still has a significant accumulation area above 1650 m to survive at a smaller size.  The ongoing retreat is triggered by warming and a rise in the snowline in the New Zealand Alps observed by the NIWA. Notice the changes upglacier indicated at the purple arrows above, where tributary flow has declined, bedrock areas in accumulation zone have expanded and the snowline is higher.  Gjermundsen et al (2011) examined the change in glacier area in the central Southern Alps and found a 17% reduction in area mainly from reductions of large valley glaciers such as Murchison Glacier.

mucrhison terminus reach compare

Terminus reach of Murchison Glacier in Google Earth images from 2007 and 2013.  Note expansion at pink arrow on the terminus lake and the development of proglacial lakes 3.5 km upglacier at blue arrows.

The Feb. 2011 earthquake near Christchurch led to a major calving event of a portion of the rotten stagnant terminus reach of the Tasman Glacier. There was no evident calving event from Murchison Glacier.This has led to increased exposure of bedrock high on the glacier and reduction of tributary inflow noted at purple arrows.

Murchison Glacier drains into Lake Pukaki,a along with Hooker, Mueller and Tasman Glacier, where water level has been raised 9 m for hydropower purposes. Water from Lake Pukaki is sent through a canal into the Lake Ohau watershed and then through six hydropower plants of the Waitaki hydro scheme: Ohau A, B and C. Benmore, Aviemore and Waitaki with a combined output of 1340 MW.  Meridian owns and operates all six hydro stations located from Lake Pūkaki to Waitaki. Reductions in glacier area in the watershed will lead to reduced summer runoff into the Lake Pukaki system. Below the Benore Dam is pictured,.  Interestingly salmon have been introduced into the Waitaki River system for fishing near its mouth. Benmore Lake itself is an internationally renowned trout fishing spot, providing habitat for both brown trout and rainbow trout.

benmore dam

Google Earth Image with Benmore Dam in foreground and Benmore Lake.  This hydropower system is fed by a canal from Lake Pukaki which in turn is fed by Murchison Glacier.


Visualizing Glacier Melt Impacts

Key questions emerge from the summer of 2015 in the Pacific Northwest glacier basins. That can both be visualized and quantified.

With record temperatures and minimum flows in most rivers in the Cascade Range during July and August of 2015, a key question was how much did glaciers contribute in basins that are glaciated?  Note the water pouring off the glacier and the lack of snowcover in the first few minutes of the video.

You can examine flow per unit watershed area as a first order observation. In the unglaciated South Fork discharge was 0.5 cfs/square mile, rising to 0.7 cfs/square mile in the lightly glaciated Skykomish River and 4.3 cfs/square mile in the heavily glaciated North Fork Nooksack.   For a more direct measure we measured ablation from July 29 to August 17th in the North Fork Nooksack and Skykomish River basin.  With the Nooksack Tribe we also measured discharge below glaciers in the North Fork but those recorders are still deployed in the field.

Because the glaciers had mostly ice, not snow at the surface, melting was enhanced.  We found in the Skykomish Basin that glacier runoff was 45 CFS versus a mean discharge of 375 CFS , this is 12% of the total flow despite covering only 1.3 % of the basin.  In the North Fork Nooksack glacier runoff was 340 CFS versus total flow of  460 CFS, this is 74% of the total flow though only 6.1 % of the basin has glacier cover. In both cases the glaciers contributed a river flow percentage 12 times greater than the percent of basin area they cover.  With a substantial loss in glacier area occurring this summer, next year glacier runoff for the given climate conditions will be reduced. Given this higher flow the glacier fed streams offer less stressful conditions this summer to salmon.

How much did glacier runoff water temperature amelioration?

In the South Fork Nooksack without glaciers stream temperature was above 20 C on eight days between Aug.1 and Aug. 20. In the North Fork Nooksack with glacier contribution, the stream temperature peaked at 13-14 C.

With the early loss of snowcover and exposure of the underlying ice, how are glacier ice worms impacted?  In the video note ice worms featured in the first minute in a glacier filled crevasse.

These worms live on snow algae primarily, which would seem to be in short supply in a summer with limited snowpack on the glaciers.  How well can they survive being on the glacier ice for extended periods?  For the 21st year we conducted ice worm population surveys.  The numbers were the lowest we have seen at 175-250 ice worms per square meter, but it should be next year when the full impact would be evident.

How much glacier area will be lost?  Note the visual of terminus retreat.
The summer is not over, but our observations indicate a 5-7 % volume loss will occur.  This should be approximately equaled by area loss.  Hopefully good satellite imagery in September will provide a specific answer.  The Aug. 17th Landsat image is excellent. Retreat just this summer has been 40 m on Easton Glacier, 32 meters on Columbia Glacier, 25 meters on Sholes Glacier and 30 meters on Lower Curtis Glacier.

mount baker 9172015


Aug. 17 Landsat image.  Arrows indicate areas where we observed rapid area loss of glacier ice this summer. 

Kokanee Glacier Spring 2015 Assessment, British Columbia

Guest Post by Ben Pelto

Kokanee Glacier is located in the Selkirk Mountains of southeastern B.C., 30 km northeast of Nelson in Kokanee Glacier Provincial Park. Kokanee Glacier drains into the Joker Lakes, the uppermost of which are turquoise due to glacier flour input. Joker Creek carries the water downstream, eventually feeding into the Kootenay Lake and the Kootenay River, which flows to meet the Columbia River in Castlegar, B.C. In the last few years a decline in the number of fish inventoried in feeder streams to the lake caused cancellation of the Fishing Derby in 2015. The Meadow Creek spawning channel usually supports 500,000 to one million kokanee spawners, declined to less than 200,000 annually. In fall 2014, their numbers were down to 60,000. A drop of snow melt from this glacier also would pass through 16 hydroelectric facilities before reaching the ocean.

kokannee AZ

Kokanee Glacier looking west towards camp. April 20th, 2015 Photo: Ben Pelto

A research team from the University of Northern British Columbia and the University of Calgary began visiting the glacier each spring and fall beginning in 2013. Fall access to the glacier is via the Gibson Lake trailhead, which is a 7.5 km hike to Kaslo Lake and the new Kokanee Glacier Cabin (Slocan Chief cabin is only 1 km farther up the trail, but is no longer in use as a backcountry cabin). Spring access is via helicopter under a research permit. The Kokanee Glacier is north-facing and extends from 2800 meters at the summit of Kokanee Peak, to 2230 m where it terminates in an unnamed lake.  This lake is a recent addition to the Joker Lakes, due to glacier retreat in the past two decades. The Kokanee Glacier covers about 1.7 km2.
Kokanee map

Contour map of the Kokanee Glacier, with the uppermost Joker Lake. Approximate current terminus position purple-dashed line. Oval indicates new proglacial lake.

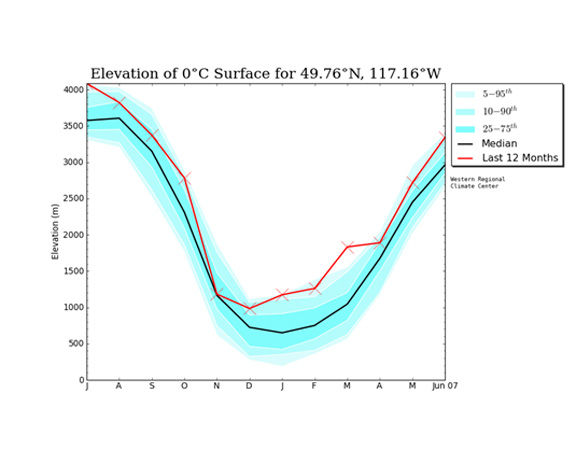
Our spring visit to the glacier documented snowpack deposited during an anomalously warm winter, as shown in the image below from the North American Freezing Level Tracker. The tracker is run by Idaho State University and estimates freezing levels based on the NCEP/NCAR Global Reanalysis, which is determined every six hours. Freezing level is the elevation where air temperature is 0°C at a given time. Freezing levels are important to mountain hydrology and determine whether precipitation falls as rain or snow, the elevation of the rain/snow line, whether the ground is frozen when snow falls in the autumn, the efficiency of snowpack accumulation through the winter (melt events, rain on snow), the internal temperature of the snowpack (which drives melt and metamorphosis of the snowpack), and the length of snow free season at a given elevation. What is immediately apparent is that freezing levels were elevated throughout the accumulation season, which generally begins in late September. Freezing levels were highest relative to the median in the key winter months of January through March. Local skiers and ski guides complained of rain during many storms, which reached to or near the mountain tops and left poor skiing conditions.kokanee fl
Estimated freezing levels for Kokanee Glacier for July 2014 to June 2015 North American Freezing Level Tracker

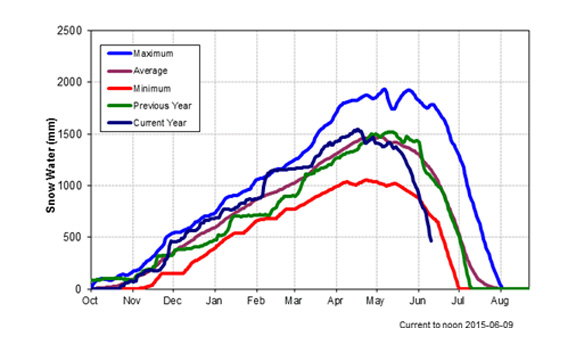
The Redfish Creek snow pillow is the nearest snow pillow site (see below), and is located 7 km southeast of the glacier at 2086 m. The Kokanee Glacier extends from around 2230 m to 2800 m so the snow pillow site may not accurately represent the amount and type of precipitation on the glacier. Regardless, this winter featured a fairly average snowpack, generally hovering above the mean SWE (snow water equivalent), which is calculated from 2001, when the gauge was installed, to present. A precipitous drop in SWE marked an early and strong start to the melt season, with maximum snowpack coinciding with our visit (April 19-21, 2015), roughly two weeks ahead of the usual SWE maximum date (in the first week of May) as seen by the purple line.

kokannee snowdepth

Redfish Creek snow pillow site of the B.C. River Forecast Center for 2014-2015.

The primary goal of our trip was to assess winter accumulation. Our measurements consisted of probing snow depth and digging snow pits. We took 80 probe measurements at 20 locations, and dug two snow pits, one at 2475 m and one at 2675 m. While snow depth was lowest near the terminus at 3 to 3.5 m, there was no correlation between elevation and accumulation from 2300 m and above, which accounts for a majority of the glacier area. Above 2300 m, snow depth ranged from 4.3 to 6.3 m with an average of 4.8 m.

kokanee probing
Probing snow depth on the Kokanee Glacier, April 20th, 2015. Photo: Alison Criscitiello.

Our measurements revealed that this year’s snow pack was a dense one, likely due to mid-winter melt events, rain-on-snow events, and increased temperature during snow events. Given that snowpack was low across B.C. in the winter of 2014-2015, it would have been reasonable to assume that the glacier fared poorly. However, the winter balance was precisely halfway between the healthy winter balance of 2013 and the weak winter balance of 2014. Our data indicate that freezing levels played a large role in this year’s snowpack for the Kokanee Glacier given that the surrounding region is below 50% of normal snowpack, yet the glacier is much closer to normal as it was still above even the high 2015 winter freezing levels. Given our limited sample size, with this being the third measured winter accumulation, it is beyond the scope our data to assess how close to or far from normal this winter’s snowpack was for the Kokanee Glacier.

Standing on the glacier looking down valley, we observed that bare ground began around 1800 m where there should have still been a couple meters of snow. This highlighted the stark contrast between high and low elevations. Clearly, rain dominated below 1800 m this winter. This winter may be a potential model for the immediate future climate, where increased winter temperatures lead to a higher snowline, lower snowpack at lower elevations, and near average snowpack at higher elevations. Given the early start to fire season in B.C. and the Yukon, similar winters will come at a high cost for fire fighting, forest productivity, and water resources.

kokanee twilight

View looking west from Kokanee Glacier April 19, 2015. Approximate snow line yellow dashed line ~1800 m. Red J indicates location of uppermost Joker Lake. Red T is just beyond the terminus, which cannot be seen due to the slope. Photo: Ben Pelto

kokanee snowpit

4.5 m deep snow pit at 2675 m on the Kokanee Glacier, April 20th, 2015. Photo: Alison Criscitiello.

The B.C. River Forecast Center releases a monthly snow report, and stated that temperatures in the Kootenay Region, where the Kokanee Glacier is located, were 3 to 5°C above average. The image below shows that by May 1, snowpack was 67% of average. The June 1st map has all but three sub-regions of B.C. exhibiting less than 50% of normal snowpack, with the West Kootenay region at 30% of normal. The result will be less snowpack across southern BC this summer. At the end of August last year there was considerable bare ice and firn exposed on Kokanee Glacier, this year we anticipate even more upon our return at the end of the melt season. Of course the snow report is critical for hydropower in BC.  For the Kokanee Glacier, meltwater goes through a series of hydropower dams on the Kootenay River.
bcsnowpack

May 1, 2015 Snow Report Map, B.C. River Forecast Center.  Kokanee Glacier located by Nelson in SE B.C.

kokanee 2014

Kokanee Glacier, Aug. 27th 2014. the darker areas are either firn that has survived more than one summer or bare glacier ice. 

kootenay river hydro


Kootenay River Hydropower. 

Salmon Challenges From Glaciers to the Salish Sea

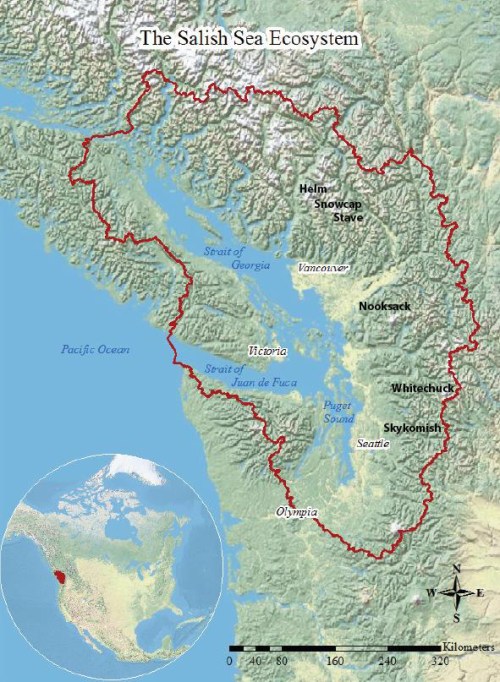
The Salish Sea includes Puget Sound, the Strait of Georgia, and the Strait of Juan de Fuca of Washington and British Columbia. The Salish Sea supports all seven species of Pacific salmon, chinook, chum, coho, cutthroat, pink, sockeye and steelhead. Population declines have prompted initiation of the Salish Sea Marine Survival Project. This project reports that: chinook, coho, and steelhead have experienced tenfold declines in survival during the marine phase of their lifecycle, with total abundance remaining well below levels of 30 years ago. The conditions in the Salish Sea have changed and salmon survival has been declining, Zimmerman et al (2015) observed the primary pattern within the Salish Sea is declining smolt survival from 1977-2010.  Of course the salmon begin and end their life cycle in the streams, many glacier fed, and these too have experienced changes that are not favorable for salmon. The Salish Sea is fed by numerous glacier fed streams, all of which have experienced substantial retreat in the last 30 years, with many already experiencing significant summer declines in overall and glacier runoff (Stahl and Moore, 2006; Pelto, 2008). The largest input river is the Fraser River (FR), Padilla et al (2014) note an increasing variability in summer flow, and with a warming climate greater variability in annual streamflow, and hence in hydrological extremes is anticipated, which is not favorable to salmon. This post provides selected specific examples of observed changes on glaciers in the Salish Sea watershed.

.salish sea map

Modified Map from Environment Canada

Decline-of-Marine-Survival-in-the-Salish-Sea2


Salmon Changes from the Salish Sea Marine Survival Project 

whitechuck change

The loss of the north branch of the Whitechuck Glacier

The Whitechuck Glacier supplies flow to the headwaters of the Whitechuck River. Its white expanse has graced these headwaters for thousands of years. The Whitechuck Glacier retreated slowly from its advanced Little Ice Age position until 1930, while rapidly thinning. Thus, prepared it began a rapid retreat in 1930. This rapid retreat culminated in the total disappearance of the north branch of the glacier in 2001, our third visit to the glacier. No more does this glacier dominate the headwaters, and its demise has and will continue to alter the hydrology of the Whitechuck River headwaters.The amount of runoff entering the Whitechuck River has declined substantially in the summer. For thousands of years each square meter of glacier has contributed 3 cubic meters of runoff from July I-October 1. With the loss of glacier ice, this contribution should drop by 65-80% based on observations at two other sites where glaciers have disappeared (Pelto, 1993 & 2008). The change since 1950 in glacier area has reduced summer glacier runoff by 5.7 million cubic meters annually. This represents a loss of between 0.55 to 0.65 cubic meters/second for the Whitechuck River during the July-September period. The water will also be less sediment laden and warmer. The impact will be less water for the fall salmon runs, and less food in amount and processing for stream invertebrates on which salmon feed downstream in the Sauk and Skagit Rivers.  Milk Lake Glacier also fed this watershed before disappearing in the 1990’s.

milk lake change

Milk Lake Glacier on USGS map from 1979 and in 2009.

Nooksack River: For 31 years we have completed measurements of ablation, glacier area change and runoff in this basin, all are losing mass and retreating (Pelto and Brown, 2012). During stressful warm weather events in the last five years we have measured ablation on and runoff from glaciers in the basin. In addition the USGS gages record discharge and stream temperature in the South Fork, Middle Fork and North Fork Nooksack. During these events runoff measurements below Sholes Glacier and ablation measurements on Sholes Glacier indicate daily ablation ranging from 0.05-0.06 meters per day, which for the North Fork currently yields 9.5-11 cubic meters/second. This is 40-50% of the August mean discharge of 24 cubic meters/second, despite glaciers only covering 6% of the watershed. In the unglaciated South Fork all 12 warm weather events generated a rise in stream temperature of at least 2 C, only 2 event in the North Fork generated this rise. Discharge rose at leasts 15% in 10 of the 12 events in the North Fork and none of the events in the South Fork. As the glaciers continue to retreat the North Fork will trend first toward the more limited impact of the Middle Fork and then the highly sensitive South Fork where warm weather leads to declining streamflow and warming temperatures. Our ongoing measurements of daily runoff and daily streamflow below Sholes Glacier allow determination of the contribution of glaciers to the North Fork Nooksack, which peaked in 2014 at 80% of total streamflow. Glacier runoff surpassed 40% of the total streamflow on 26 days after Aug. 1 in 2014. The Nooksack Salmon Enhancement Association has completed numerous salmon restoration efforts, but climate is one challenge that cannot be restored locally.

deming terminus 2011
Deming Glacier Retreat 1984-2011-headwaters Middle Fork Nooksack River

nooksack response
Response of watersheds to warm weather events.

Skykomish RiverThe reduction of the glacial melt component augmenting summer low flows is already resulting in more low-flow days in the North Cascade region. In the Skykomish River watershed from 1958-2009 glacier area declined from 3.8 km2 to 2.1 km2, a 45% decline (Pelto, 2011). A key threshold of in-stream flow levels considered insufficient to maintain short term survival of fish stocks is below 10% of the mean annual flow (Tennant, 1976). For the Skykomish River 10% of mean annual flow is 14 cubic meter/second. In the Skykomish River from 1950-2013 there have been 230 melt season days with discharge below 14 cubic meter/second. Of these 228, or 99% of the low flow days, have occurred since 1985. The loss of 30-40% of the glacier runoff is a key reason for the onset of more critical low flow days. Of more concern for aquatic life is the occurrence of extended periods of low flow (Tennant, 1976). From 1929-2009 in the Skykomish River basin there have been eight years where streamflow dropped below 14 cubic meter/second. for 10 consecutive days during the melt season, 1986, 1987, 1992, 1998, 2003, 2005, 2006 and 2007. It is likely that 2015 will join this list

lynch change

Lynch Glacier, Skykomish Basin in 1978 (Bill Prater, Photograph) when Pea Soup Lake was filled with ice and in 2007 with the glacier no longer reaching the lake.

Fraser River-Southern BC: Koch et al,(2009) observed a widespread retreat and glacier area loss in Garibaldi Provincial Park just to the west, with 20% area loss from 1988-2005. Bolch et al (2010) noted that from 1985-2005 that glaciers in the southern Coast of British Columbia lost 10% of their area, 0.6% per year and that the rate was increasing. By 2015 this area loss is certainly greater than 15%. For a longer time span Tennant et al (2012) noted that from 1919-2006 the glaciers in the central and southern Canadian Rocky Mountains lost 40% of their area. Of the 523 glaciers they observed 17 disappeared and 124 separated. Many of these do not drain into the Salish Sea, but does give a sense that the overall change is larger than 20%.

The change in glacier area is key because observed melt rates increases have been less than 20%. Hence, as glacier area declines at a greater rate than glacier melt rate, glacier runoff declines.  The Helm Glacier below exemplifies the change from a shrinking area of ice available for summer melt, since 1928 the glacier has lost 78% of its area. Helm Glacier drains into the Cheakamus River, which supplies Daisy lake Reservoir and the BCHydro 157 MW Cheakamus Power Plant.  The Cheakamus River has the Dave Marshall Salmon Reserve with over 14 kilometres of winding, re-enhanced salmon spawning river channels off the Cheakamus.

helm-glacier-20091

Helm Glacier, Garibaldi Provincial Park, BC 1928 extent on 2009 Google Earth image

Snowcap Creek Glacier has retreated 900 m since 1992 with a new lake forming at its terminus.  This glacier drains into Harrison Lake.  Harrison Lake is considered a location where salmon populations have remained stronger and features five species of salmon – sockeye, chinook, pink, coho, and chum that pass through the lake in the summer enroute to spawning grounds.

Snowcap Creek Glacier shares a divide with Stave Glacier at the headwaters of Stave Lake which is the part of the 205 MW Stave Lake-Hayward Reservoir-Ruskin Dam Hydropower facility.  The dams do not have fish passages cutting off salmon from most of the watershed.  There are kokanee salmon a landlocked version of the sockeye salmon.This glacier has retreated at a rate of 100 meters per year from 1996 to 2012. This is the fastest rate of retreat since 1900 (Koch et al, 2009).

snowcap creek glacier 2012

Red and Yellow Arrow indicate new lakes formed in the last six years by retreat of Snowcap Creek Glacier.

stave ge

Stave Glacier Retreat Koch et al (2009) documented retreat from 1952-1996. 

Overall salmon are being faced with increasing climate stress in rivers on top of long term habitat alteration at the beginning and end of their life cycle, then mature in the changing and challenging conditions of the Salish Sea. Our Nooksack Indian Tribe partners Oliver Grah and Jezra Beaulieu discuss glacier runoff measurement, runoff changes and salmon in an interview completed during work at the runoff gage below Heliotrope Glacier on Mount Baker.