Upernavik Glacier Retreat, NW Greenland

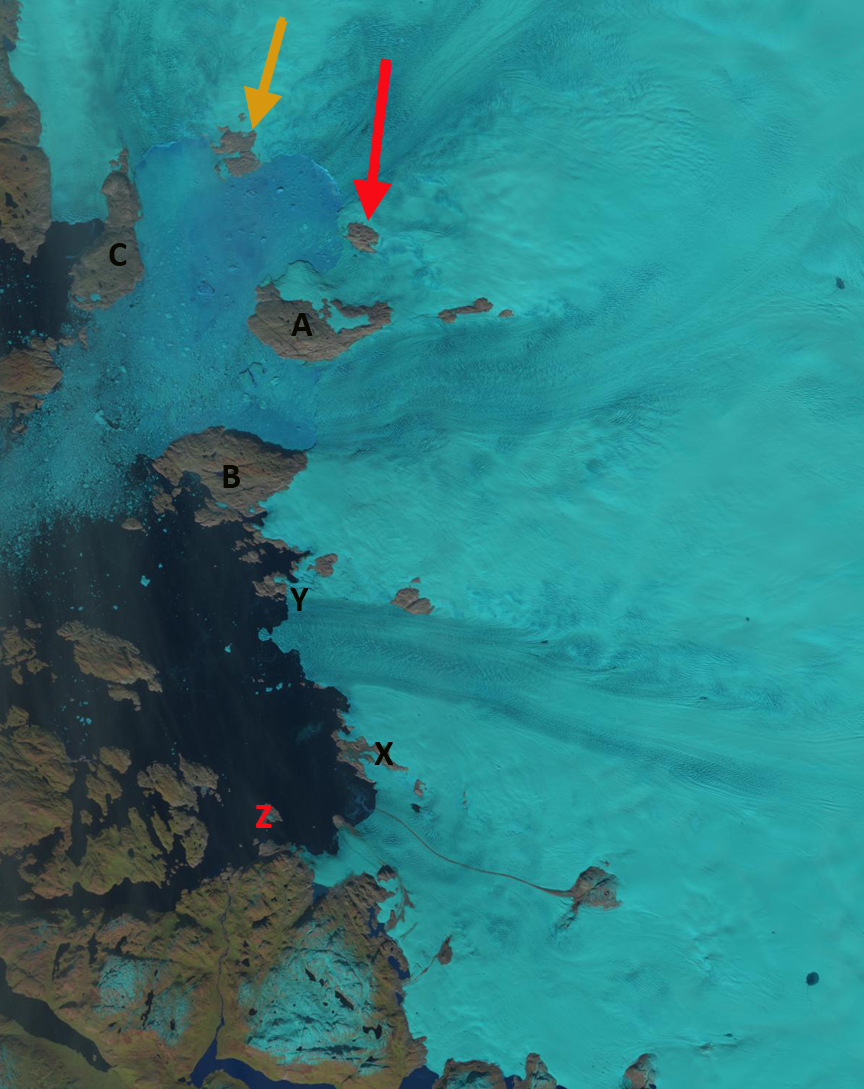
Box and Decker (2011) focused on the changes in the terminus of 39 Greenland Outlet glaciers from 2000-2010. Of these 35 had experienced net loss with the collective loss of 1593 km2 over the last decade. (Box and Decker, 2011). The retreat has occurred irrespective of the different characteristics of various glaciers (Bailey and Pelto, SkS) One of the glaciers in this group is Upernavik Glacier on the NW Greenland Coast. The Upernavik Glacier refers today refers to an increasing number of separate termini that were one termini up through 1950. Jason Box of Ohio State focused on the different termini in a 2008 post, commenting on the separation of termini A and B. Here we will focus on the development of two new islands between 2002 and 2010 due to the retreat of termini C as identified by Box and Benson in the image below. There are three marginal rock islands at the icecap periphery that are consistently labeled in the images below A, B and C. In addition the two arrows indicate two former nunataks, surrounded by ice in the 2002 Landsat image (top image below), and are now becoming rock islands at the glacier front in both Landsat 2010 (middle two images) and MODIS 2011 image (bottom). In the closeup Landsat image the glacier front is indicated in orange, beyond the terminus the fjord is still filled with considerable glacier debris that has calved. The black lines in the image are the uncorrected scan lines. A 2013 Landsat image indicates changes along outlet A as island at Point X, Y and Z emerge from the ice compared to 2002.
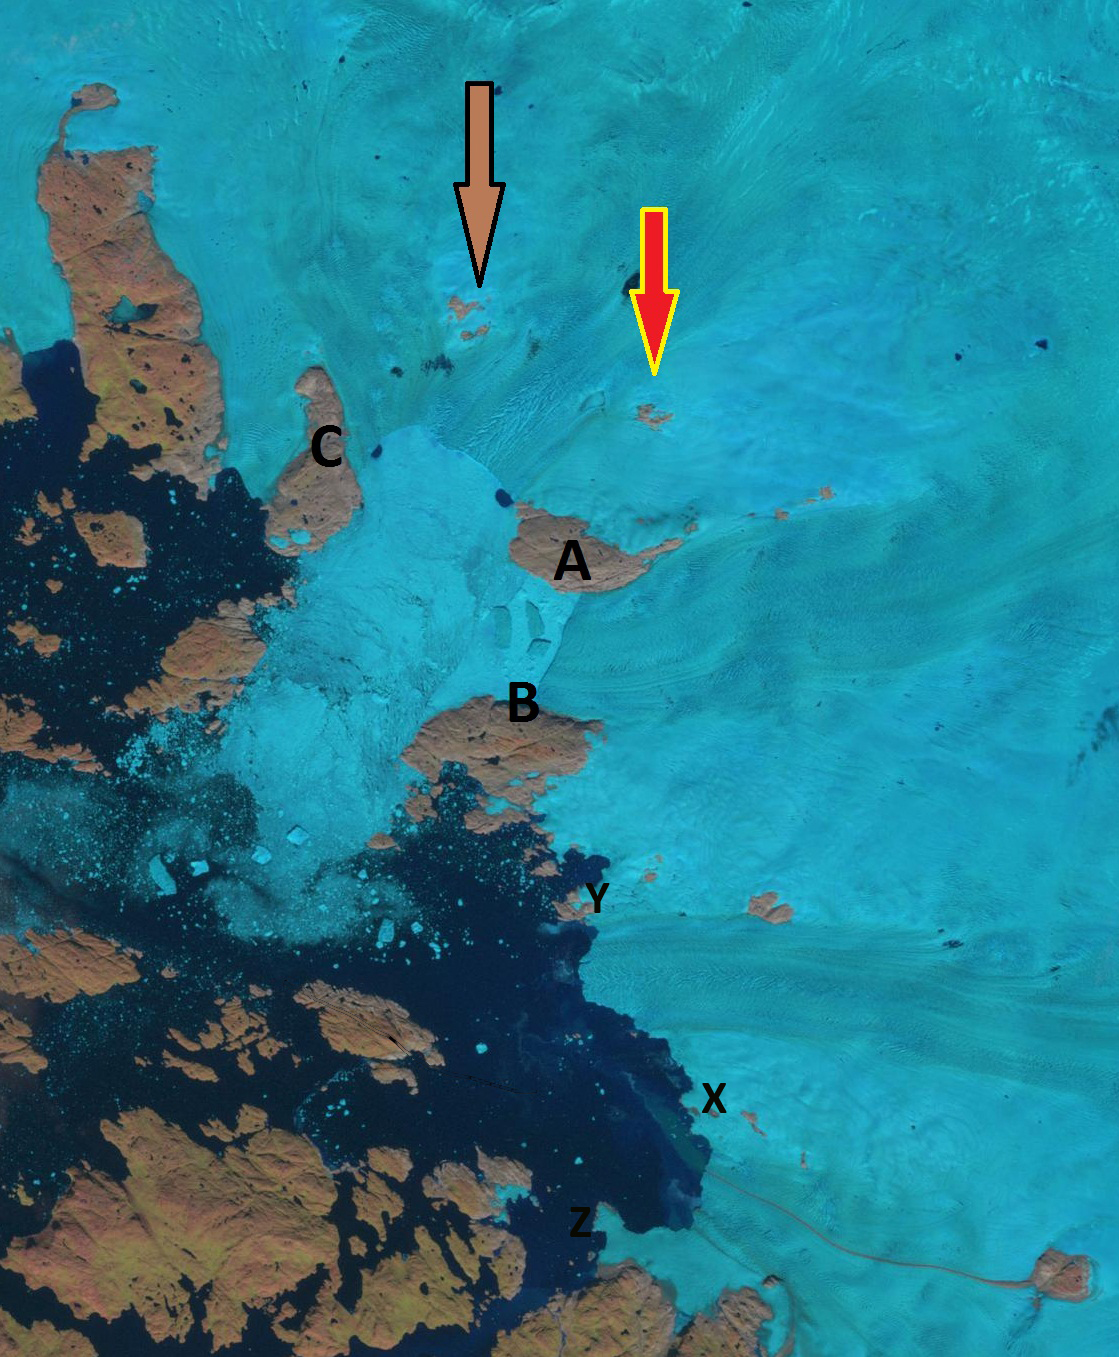
 upernavik2002 upernavik 2013
2013 Landsat image
Google Earth currently has an image that predates the development of the new island as well. This is not the only new island in Greenland by any means. Warming Island on the east coast has gained notoriety. It is seen below in a nice August 2010 Landsat image. Box and Decker (2011) note that ice loss for Upernavik Glacier’s combined termini was 7.9 square kilometers per year from 2000-2010, in Table 2. For the 2002 to 2010 period it is evident the Upernvavik terminus C lost at least 35 square kilometers as the two new islands begin to develop, mostly between 2002 and 2008. This glacier follows the pattern of Umiamako Glacier and Jakobshavn Glacier. It also is worth noting it has a deep bed that extends well under the ice sheet as observed by Morligheim et al (2014). upernavik base

Glacier Retreat Kali Gandaki Headwaters, Nepal

The headwaters of the Kali Gandaki River is in northern Nepal. The basin is identified as having 1025 glaciers covering 2030 square kilometers by ICIMOD. The largest hydropower project is the 144 MW Kali Gandaki A project. The dam is located in Mirmi and the water is then sent through a 6 km long tunnel to Beltari. The Kali Gandaki River is fed by the summer monsoon rains and glacier melt. The glaciers in the range are summer accumulation type. The monsoon precipitation in summer (June- September) provides 80 % of annual precipitation.
Ageta and Higuchi (1984) noted that on summer accumulation type glaciers, accumulation and ablation occur simultaneously in summer. The result is that glacier retreat does not impact streamflow as much, as in other glaciated alpine regions. This post will look at several glaciers north of the highest section of the Himalaya. The Kali Gandaki River passes between the 8000 meter peaks of Annapurna and Dhalaguri. North of these peaks the climate is drier and colder as the peaks act as a barrier to the incursion of warmer monsoonal air masses. The glaciers examined range in altitude from 6000 m to 5500 m. These are cold glaciers where the bulk of the glacier ice is below freezing. The cold based summer accumulation type glacier at the headwaters of the Kali Gandaki are quite susceptible to warming, because of the low elevation and their dependence on frequent summer snowfall events to keep the albedo of the glacier surface high. In the glaciers examined here a point of concern is the extent of the surface drainage systems. Cold-based glaciers move slower and have fewer crevasses as a result. In addition meltwater does not penetrate into the cold glacier ice. Therefore, meltwater tends to drain along the surface and the persistence of meltwater drainage is evident in the formation of channels. If the majority of a cold type glacier has these streams, this indicates a limited accumulation area, which will then lead to glacier retreat. An examination of each of the three glaciers below indicates that the extent of the meltwater channels is unusually large. The meltwater channels are indicated with red arrows. The images are from late October 2009 and in some cases new snow has already covered some of the stream channels which in two cases nearly reach the top of the glacier. This is not an equilibrium situation where meltwater channels cover more than 70% of an alpine glacier. this is an indication of an expanding melt area on these glaciers. A comparison of the middle glacier with a 2000 Landsat image indicates 200 meters of retreat in the last decade. Notice the lake that is at the terminus in 2000 below is now 250 meters from the terminus in the image. above. These glaciers are small compared to the large Himalayan glaciers like Khumbu, Imja or Gangotri, but have the same response to climate, significant retreat.

Quelccaya Ice Cap Retreat, Peru

Quelccaya Ice Cap is in the of Peru. The first detailed investigations were by Lonnie Thompson at Ohio State examining the ice cap for its potential for ice coring (Thompson, 1980). Three decades later he is still involved in research on this ice cap and others, which combined have yielded one of the finest glacier climate records we have. This is nicely chronicled in Thin Ice by Mark Bowen. This research generated an excellent ice core record, that has annual resolution back some 1000 years, that illustrated the global nature of the Little Ice Age (Thompson et al, 1986). This core also indicated the reduced accumulation during El Nino events Thompson et al (1984) In conducting this research Thompson et al (2011) Figure 8, has also chronicled the retreat of one outlet glacier the Qori Kalis and put this in context with other tropical glaciers. The retreat of this glacier had been 1300 meters from 1963-2005. Today the University of Massachusetts, Climate System Research Center has installed weather stations on the glacier. Recent fieldwork has also focussed on ablation, accumulation and energy balance measurements, this is nicely chronicled in photographs by Carsten Braun, slideshow bottom of linked page Westfield State University. This post will focus on the development of new proglacial lakes at the terminus of the Quelccaya Ice Cap southwest of Qori Kalis and on the retreat of the ice cap from several lakes that had been in contact with the terminus. Landsat imagery from 1991 and 2010 is used. Point A is Qori Kalis, Point B, C and D are separate termini.
We see several new proglacial lakes indicated by blue arrows and two lakes that were in contact with the ice cap in 1991, but now are not, red arrows. Qori Kalis (point A) has retreated out of its proglacial lake. The glacier filled this lake in 1963, the lake is now 1300 meters long and the glacier is 1450 meters from the northwest end of the lake, this represents its retreat over the last half century. The next lake indicated by a red arrow south of Point A. was in contact with the ice cap in 1991 it is now 200-250 meters from the ice cap edge. The next lake to the south indicated by a red arrow is was also in contact with the ice cap in 1991 and is now 250 meters from the ice cap margin. Points B,C, and D point two newly formed lakes filling basins exposed by glacier retreat since 1991. The distance from the far edge of each lake to the current ice cap margin indicate retreat of 300 m at C, 400 m at D and 250 meters at B.

Index of 130 Glacier Posts June 2009-August 2011

Glacier Index List
Below is a list of the individual glacier posts examining our warming climates impact on each glacier. This represents the first 2.3 years of posts, 130 total posts, 121 different glaciers. I have worked directly on 36 of the glaciers described below. Other glaciers were selected based on fine research that I had come across, cited in each post, I then look at additional often more recent imagery to expand on that research. The imagery comes either from MODIS, Landsat, Geoeye or Google Earth.
North America
Columbia Glacier, Washington
Lyman Glacier, Washington
Boulder Glacier, Washington
Ptarmigan Ridge Glacier, Washington
Anderson Glacier, Washington
Milk Lake Glacier, Washington
Paradise Glacier, Washington
Easton Glacier, Washington
Redoubt Glacier, Washington
Honeycomb Glacier, Washington
Vista Glacier, Washington
Rainbow Glacier, Washington
Daniels Glacier, Washington
Colonial Glaer, Washington
Quien Sabe Glacier, Washington
Mazama Glacier
Fairchild Glacier, Washington
White Glacier, Washington
Banded Glacier, Washington
Hinman Glacier, Washington
Bridge Glacier, British Columbia
Bubagoo Glacier, British Columbia
Hector Glacier, Alberta
Helm Glacier, British Columbia
Melbern Glacier
Warren Glacier, British Columbia
Castle Creek Glacier, British Columbia
Hoboe Glacier, British Columbia
Tulsequah Glacier, British Columbia
Decker and Spearhead Glacier, British Columbia
Columbia Glacier, British Columbia
Freshfield Glacier, British Columbia
Devon Ice Cap, Nunavut
Penny ice Cap, Nunavut
Minor Glacier, Wyoming
Grasshopper Glacier, Wyoming
Grasshopper Glacier, Montana
Harrison Glacier, Montana
Sperry Glacier, Montana
Hopper Glacier, Montana
Old Sun Glacier, Montana
Yakutat Glacier, Alaska
Grand Plateau Glacier, Alaska
Gilkey Glacier , Alaska
Gilkey Glacier ogives, Alaska
Lemon Creek Glacier, Alaska
Taku Glacier, Alaska
Bear Lake Glacier, Alaska
Chickamin Glacier, Alaska
Okpilak Glacier, Alaska
Sawyer Glacier, Alaska
Antler Glacier, Alaska
East Taklanika Glacier, Alaska
Brady Glacier, Alaska
Brady Glacier Retreat lake expansion 2004-2010
Thiel Glacier, Alaska

New Zealand
Tasman Glacier
Murchison Glacier
Donne Glacier
Africa
Rwenzori Glaciers
Himalaya
Zemu Glacier, Sikkim
Theri Kang Glacier, Bhutan
Zemestan Glacier, Afghanistan
Khumbu Glacier, Nepal
Imja Glacier, Nepal
Gangotri Glacier, India
Satopanth Glacier, India
Menlung Glacier, Tibet
Boshula Glaciers, Tibet
Urumquihe Glacier, Tibet
Sara Umaga Glacier, India

Europe
Mer de Glace, France
Dargentiere Glacier, France
Grand Motte and Pramort Glacier Tignes Ski area, France
Sommelier Glacier
Obeeraar Glacier, Austria
Ochsentaler Glacier, Austria
Pitzal Glacier, Austria
Dosde Glacier, Italy
Maladeta Glacier, Spain
Presena Glacier, Italy
Triftgletscher, Switzerland
Rotmoosferner, Austria
Stubai Glacier, Austria
Ried Glacier, Switzerland
Chuebodengletscher and Ghiacciaio-del-Pizzo-Rotondo
Forni Glacier, Italy
Peridido Glacier, Spain
Engabreen, Norway
Midtdalsbreen, Norway
TungnaarJokull, Iceland
Gigjokull, Iceland
Skeidararjokull, Iceland
Lednik Fytnargin, Russia
Rembesdalsskaka, Norway
Hansbreen
Nannbreen

Greenland
Mittivakkat Glacier
Ryder Glacier
Humboldt Glacier
Petermann Glacier
Kuussuup Sermia
Jakobshavn Isbrae
Umiamako Glacier
South America
Colonia Glacier, Chile
Artesonraju Glacier, Peru
Nef Glacier, Chile
Tyndall Glacier, Chile
Zongo Glacier, Bolivia
Llaca Glacier, Peru
Seco Glacier, Argentina
Antarctica and Circum Antarctic Islands
Pine Island Glacier
Fleming Glacier
Hariot Glacier
Amsler Island
Stephenson Glacier, Heard Island
Neumayer, South Georgia
Ampere, Kerguelen
Nordenskjold Coast, Antarctic Peninsula

North Cascade Glacier Climate Project Reports

Forecasting Glacier Survival
North Cascade Glacier Mass Balance 2010
Columbia Glacier Annual Time Lapse
North Cascade Glacier Climate Project 2009 field season
28th Field Season Schedule of the North Cascade Glacier Climate Project
North Cascade Glacier Climate Project 2011 Field Season
BAMS 2010

Bridge Glacier Retreat Acceleration, BC, Canada

Bridge Glacier is an 17 km long outlet glacier of the Lilloet Icefield in British Columbia. The glacier ends in a rapidly expanding glacial lake with 1100 meters of retreat from 2005-2010. This 200+ m per year retreat is a substantial acceleration over the observed retreat rate of 30 m per year from 1981-2005 by Allen and Smith (2007). They examined the dendrolchronology of Holocene advances of the glacier and found up to 2005 a 3.3 kilometer advance from the primary terminal moraine band, with the most extensive advances being early in the Little Ice Age. The glacier currently ends at 1400 m and in 2010 had a late summer snowline of 2000 m. . The glacier terminus in 1970 is shown in map form, and is indicated by a brown line. The 2003 terminus position from a Landsat image, second image, is next with a red line marking the terminus. The normal Google Earth image, third image, is from 2005 and has a green line. An image from Geoeye from August 2010, last image, terminus purple line indicates the rapid acceleration of retreat. Retreat from 1970-2003 was 48 m per year. The retreat from 2003 to 2010 is 1400 meters, 200 m per year. This continued retreat and area loss will lead to glacier runoff decline in summer. This is crucial to the large Bridge River Hydro complex. This complex managed by BC Hydro can produce 490 MW of power. Stahl et al (2008) note in their modeling study of the glacier that ,”The model results revealed that Bridge Glacier is significantly out of equilibrium with the current climate, and even when a continuation of current climate is assumed, the glacier decreases in area by 20% over the next 50 to100 years. This retreat is accompanied by a similar decreasein summer streamflow.” This parallels our findings on the Skykomish River in the North Cascades, Washington Pelto (2008) and Pelto (2011).

North Cascade Glacier Climate Project 2011 Field Season Report

For the 28th consecutive summer the first three weeks of August were spent observing North Cascade glaciers. The 2011 season exhibited unusual snowpack levels second only to 1999 in the last 28 years. In 1999 the world record annual snowfall record was set at Mount Baker, one of our key field research areas. The difference this year was that it was not the winter snowfall that was extraordinary it was the lack of melt through the spring and early summer. A comparison of snowpack at two USDA Snotel long term sites in the North Cascades illustrates that the bright green 2011 on April 1 was ordinary, and that the dark blue 1999 snowpack level was not approached until early June. Below is a visual look at the field season in a video followed by detailed description of field results, obtained by Ian Delaney, Mariève Desjardins, Tom Hammond, Ben Pelto, Jill Pelto and Mauri Pelto.
The field season began at Columbia Glacier. This is the lowest elevation large glacier in the North Cascades. Enroute to the glacier we probed our way across the still largely frozen Blanca Lake. In the afternoon slush we forded the outlet stream instead. The glacier was 100% snowcovered average snowdepth was just over 5 meters from extensive probing on the glacier. Snow depth in 2009 and 2010 had been nearly identical in early August, this year the depths were consistently 3.8 meters deeper.
The hike in to Lower Curtis Glacier was on snow as was our camp. A climax avalanche descended from the north side of the valley in two locations enroute to the glacier. The steep terminus of this glacier was exposed. The terminus was easier to explore with snowpack below it, a retreat of 8 meters had occurred since the previous August, all of it late last summer. The glacier had an average snowpack of just over 5 m, 3.6 meters more than last summer. The next field area was Easton Glacier and Squak Glacier. We measured the snowpack on both. We found 3.5 meters of snowpack at 6000 feet, where normally it is blue ice and at 6600 feet the average snow depth was 4.75 meters. The measurements were almost all made using crevasse stratigraphy as probing more than 4 meters is difficult. Both termini were buried. On Deming Glacier a new hole had emerged at the base of the icefall on the east side, matching the hole that developed and expanded on the right side (note arrow in top image). We also collected ice worms for an anti-freeze protein project at Queens University, Kingston Ontario (Peter Davies and Mariève Desjardins). These anti-freeze proteins help keep organisms from freezing solid, by coalescing around ice crystals and limiting their expansion in part due to lowering the freezing point without altering the melting point. For us they could be a critical resource in surgical transplant procedures where keeping organs cold is important. We could have used some kind of protein to keep us warm on the four chilly-cloudy but dry days on the Easton Glacier. We visited Lyman Glacier ascending the former Spider Glacier valley, which was this summer of course still snow filled. Lyman Glacier has lost some of its splendor in the last three years. It had a high ice cliff in 2008 and 2009, measured at 18 meters that has now diminished to 8 meters The glacier has gone from an average surface slope of 12 degrees in 1986 to 18 degrees in 2008 to 21 degrees in 2011, as it continues a rapid ice loss. The steepening results from more rapid thinning at the terminus and overall glacier shortening as the 10 meter per year retreat continues. On Mount Daniels snowpack was not as extraordinary as at other locations. Snowpack on Ice Worm Glacier averaged 4.6 meters, and on Lynch and Daniels Glacier 4.3 and 4.6 meters respectively, this was 2.5 meters more than average. This area had significantly less above average snowfall than the other field areas. Pea Soup Lake at the base of Lynch was still ice covered. We ascended the Lynch over the bergshrund pictured in last image below with a snow depth from the winter of 6.7 meters..
The mass balance of North Cascade glaciers will be strongly positive in 2011. We normally take 1100-1300 snow depth measurements. This year the deeper snowpack limited out measurements to 1/3 this total. Each glacier will be checked again in one month, to assess the final mass balance.

Nordenskjöld Coast Glacier Retreat, Antarctic Peninsula

A recent paper by Shuman et al (2011) in the Journal of Glaciology examined the thinning and retreat of glaciers feeding the area that used to contain Larsen Ice Shelf B and the southern end of Larsen Ice Shelf A. They found that the thinning of over 80 meters occurred over large areas of Hektoria, Jorum, Evans, Crane and Green Glaciers. Terminus retreat of five kilometers of the primary glaciers from late 2002-2009 occurred for Larsen B. The rapid loss of thickness and retreat has accompanied the expected and observed acceleration of the glaciers after ice shelf loss. The removal of an ice shelf is a substantial reduction in the backforce on a feeder glacier, or like taking off the brakes. Pine Island Glacier is another example where this is of concern. The Shuman et al (2011) paper particularly the figures are compelling and prompted me to take a look at one embayment in the Larsen A region that is experiencing ongoing glacier retreat. The area has been mapped by USGS and is referred to as the Nordenskjöld Coast. We will look at the unnamed embayment marked B, between Drygalski and Dinsmoor Glacier. This embayment which has formed in the last decade is 25 square kilometers in area.The above map indicates the extensive retreat due to the Larsen A ice Shelf loss that took place in the mid-1990’s and the development of the embayment by 2009. The five glaciers that feed it flow from the center of the Antarctic Peninsula, upper left in the image below. . The embayment itself has numerous icebergs suggesting the rapid ice discharge from the glaciers feeding this bay. This bay has been ice covered for a long time, transitioning from a grounded ice sheet to an ice shelf environment 10,700 years ago, and which has persisted since (Brachfield et al, 2003). The embayment did not expanded notably from the Landsat imagery from 2001 to 2009, as seen in the 2001 Landsat. In 2011 the retreat was significant as seen in MODIS imagery from Jan.27 the embayment has developed two lobes (note black arrows in image below.. The southern lobe has expanded by 1.5 km. The northern lobe by a smaller amount, but the area between glacier 4 and 5 is now a headland, indicating at least 500 meters of retreat.. The glaciers in this bay do not appear to have large floating sections generating tabular icebergs at this point, such as are evident on Fleming Glacier.

Grande Motte, Pramort Glacier Retreat and the Tignes Ski area, France

The Tignes ski area in France is famous for its great summer glacier skiing. The portion of the area that is generally open from early June to early September is on the Grand Motte Glacier. A webcam view for the glacier indicates that on Aug. 20th there is limited snowcover on the glacier, note the 3100 meter camera view, and the ski season will likely be cut short a bit. The bottom of the lift is at 3000 meters and the top of the lift is at 3450 meters. This webcam even has the ability to look back at archive coverage. To protect the ski season on the Grand Motte Glacier the resort has adopted the use of snow guns at the bottom of the Grande Motte Glacier lift. This is similar to the strategy on Pitzal Glacier. A look at the Grande Motte Glacier (Point A) and two neighboring glaciers indicates the issue. The terminus of Grande Motte Glacier at 2700 meters, top image, is thin and uncrevassed, indicating retreat will continue. In 2011 as in most years the majority of the glacier has lost its snowcover. This indicates a negative mass balance and continued glacier loss. The neighboring unnamed glacier, labelled B, is completely bare of snow in the Google Earth imagery, is quite thin and uncrevassed. This glacier has separated into three parts, the largest is labelled and is still 500 meters wide and 400 meters long, it will still melt away in the coming decade. The Parmort Glacier, Point C, used to be connected to the Grande Motte Glacier and the Premou Glacier. It is now a 1 km long debris covered stagnant terminus tongue ranging from 2700 meters to 2400 meters. This glacier has no snowcover at the end of most summer and is melting away. There are several areas of concentric crevasses that indicate basins beneath the glacier that periodicially fill with water lifting the glacier a bit, then drain, leading to the crevasses. The glaciated landscape in this area is changing dramatically(Gardent and Deline, 2011) noted a 30% loss in glacier area since the 1960’s. This trend is following the behavior of Glacier D’Argentiere and Mer De Glace. Those larger glaciers are not currently threatened, as these are with melting away.

28th Field Season of the North Cascade Glacier Climate Project 8-1 to 8-20

During the interval of 8-1 to 8-20 there will be no blog updates, we will be in the field for the entire period. This is the 28th consecutive year we will monitoring the terminus behavior and mass balance of these glaciers identifying how they respond to climate change. In these 28 years all the glaciers have retreated significantly they have lost 20% of their volume and two of the glaciers we monitored every year have disappeared.
If you are in need of glacier observations, please take a look back at the index of 100+ posts to date
Or look at the video footage below from the 2010 field season and the 2009 field season

North Cascades Glacier Documentary Promo 2010 from Cory Kelley on Vimeo.


2009 field season video

We begin the field season on Columbia Glacier near Monte Cristo, WA.
We will then head north to the Lower Curtis Glacier on Mount Shuksan. A traverse west will takes us to Sholes and Rainbow Glacier on the ne side of Mount Baker.

We will then drive around Mount Baker and examine the Easton, Deming, Squak, Talum and Boulder Glaciers on the south and east side of Mount Baker.

We then head to Cache Col Glacier near Cascade Pass and finally south to Mount Daniels for Ice Worm, Daniels and Lynch Glacierto finish the field season. It was a historically cool and wet spring and the glaciers still have a thick blanket of snowcover. How thick is what we will be measuring one glacier at a time.

Umiamako Glacier Acceleration and Retreat

Draining the West side of the Greenland Ice Sheet just north of Disko Island, Umiamako Glacier unlike most of the others in the region reaches close to the end of its fjord. The glacier flows 50 km down this fjord, though in the last 10 years this distance has decline sharply. A recent paper by McFadden et al (2011) explores the dynamic changes of this glacier. The glacier was first chosen for examination in the late 1930’s by the British West Greenland Expedition. The first good data on velocity come from the survey of Carbonell and Bauer in 1964, who reported a velocity of 1200-1900 meters per year. The terminus and the velocity of the glacier both were pretty stable for the next 40 years, much as was the case on the Jakobshavn to the south. In the McFadden et al (2011) paper the velocity is still in the same range of 1500 meters per year until 2005, top box in image below. From 2005 to 2009 the velocity increased to 5000 meters per year. The associated retreat is in the middle box of this image. The extent of the acceleration inland is not identified here directly, but in the surface profiles the bottom of the three boxes in the McFadden image, the inland thinning in 2008 is significant to 20 km inland, suggesting an acceleration to here. The fjord reach of the glacier still extends another 25-30 km, so the acceleration has not reached to the inland ice. In the Joughin et al (2010), second figure below,the extent of high velocity is quite limited for Umiamako compared to Rinks just to the south inn 2005/06. Is this still true? After the retreat of 2003-2005 the acceleration began. This is typical for the marine terminating outlet glaciers as thinning usually leads to retreat and the thinning leads to decoupling of the glacier to extent from the fjord walls and its bed. This typifies the third type of Greenland glaciers reviewed by Bailey and Pelto (2011). The reduced frictional forces lead to acceleration and further retreat. In this case the fjord is longer than many in the sector of West Greenland, leading to a smaller area of contribution from the inland ice and less capability to drawdown this ice. The terminus change can be seen in the map from McFadden , but also in the three images below, first from Google Earth in 2004( top image), than from MODIS in 2010 (middle image)and 2011(bottom image). C marks the terminus position, B the juncture with the first southerly tributary glacier and A the juncture with the second tributary glacier. The two tributary glaciers that clearly feed the glacier in 2004, B now enters the fjord below the glacier and A is right at the terminus. In the McFadden image the 2009 terminus is still downstream of tributary A. Total retreat in the last decade is at least 7.5 km. Extreme Ice Survey set up a camera at the terminus and has a time sequence from 2008, this same camera location in 2011 would show a much different scene as the glacier has retreated 2 kilometers.

Sommelier Glacier, France Disappearing

Index list of over 100 glaciers examined to date
The Sommelier Glacier is close up against the France-Italy border. The glacier is on the north side of Punta Sommelier centered on 3000 meters. The glacier has retreated 1800 meters from its Little Ice Age Maximum and is currently 600 meters long. The most notable aspect of the glacier today is its thin nature and the fact that there are three separated and stagnant ice masses (B, C), the main glacier section is outlined in blue. The large deglaciated fluted moraine is noted by point A. Within the area of the main glacier there are several rock outcrops protruding indicating the thin and decaying nature of the glacier, note blue placemarks. Also note that the glacier has limited snowcover. Both of these indicate a glacier is not forecast to survive. This is not surprising for the Sommelier Glacier given the fate of the nearby Galambra Glacier noted by the Italian Glacier Commission, inn this photo pair from 1954 and 2009. This glacier no longer graces the slopes of Punta Galambra. Punta Sommelier likewise will lose its glacier cover. This is the trend of alpine glaciers in Italy, other examples include Dosde Glacier, Italy and Presena Glacier.

Mazama Glacier Retreat, North Cascades, Washington

Mazama Glacier flows down the north side of Mount Baker, a strato volcano in the North Cascades of Washington. The glacier begins at the summit plateau, 3260 meters, and terminates at the head of Wells Creek 1470 meters. This is a glacier we visit briefly each summer since 1984, but is not a focus of detailed observations. In 2010 we descended from its divide with Rainbow Glacier at 2100 meters to just above the terminus. In the 1970’s the USGS map (top image in sequence) indicates the terminus extended down valley to 1200 meters, this was after a period of advance for the glacier. The glacier advance 450 meters from 1950-1980 (Pelto and Hedlund, 2001). In 1987 we observed the glacier to have begun to retreat. By 1993 the glacier had retreated 200 meters. From 1993 (middle) to 2009 (bottom image) the glacier retreated an additional 750 meters. The rate of retreat has been higher for this glacier because of the loss of the low elevation debris covered terminus that had existed from the 1950’s-1990’s. The glacier is still heavily crevassed and active. The retreat will continue as indicated by thinning near the snowline of the glacier from 1993 to 2009. Note the expansion of the rock outcrop in glacier center (A) from the top image, 1993 to 2009 bottom image. There is also considerably less crevassing near Point A. Also note the stranded glacier ice at Point B and C in 2009. This loss has been due to 7 of the last 10 years having a snowline that rose above the elevation necessary for equilibrium. In 2009 at the end of the summer just 36% of the glacier was snowcovered, 65% needs to be snowcovered for equilibrium. .
In two weeks we will be visiting Mazama Glacier again. Given the heavy 2011 snowpack it is unlikely we will get to see the terminus which should be under avalanche debris.