The Saskatchewan Glacier is a major outlet glacier of the Columbia Icefield in Alberta. The glacier is a 12 km long valley glacier draining east from the icefield that ends within 6 km of Highway 93. This accessibility has led to numerous examinations of this glacier. The glacier is not as famous as its neighbor to the north Athabasca Glacier which the same highway brings a visitor to a parking lot at the margin of the glacier. I visited the glacier twice in the 1980’s, this post is mainly an examination of its retreat since then. A series of photographs from Parker’s Ridge in 1924, 1985, 2011 and 2014 provide a good view of the change in the glacier and the development of a lake that was at the margin and is now separated from the glacier. The first two images are from a report from Dan Smith, Univ. of Victoria BC on the dendrochronology of this glacier, the last image is from Ben Pelto in September of 2014. Interestingly Dan Smith found after a channel erosion event a buried forest that dated to 2800 to 3200 years ago. Indicating that the glacier is now shorter than in had been for at least that long. The lake has expanded in width and length even since 2011. Ben Pelto image 2014
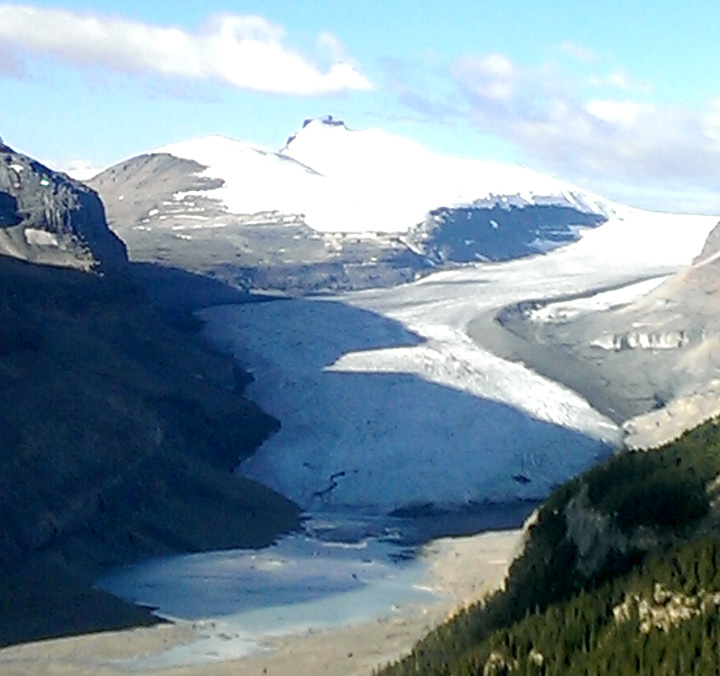
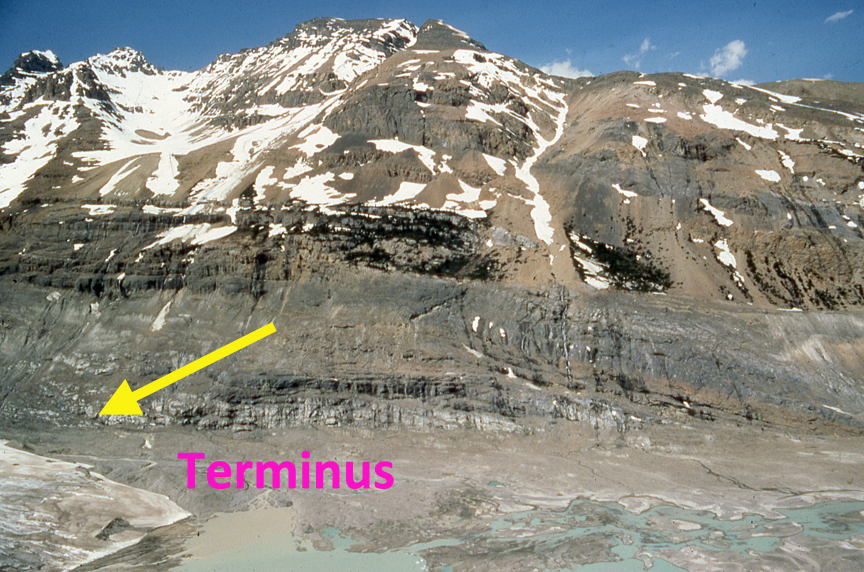
The terminus when I first visited the glacier in 1983 was just at the western margin of the lake that had developed at the glaciers terminus, first image below. The recession of the glacier since the late 19th century is similar to that of other glaciers in the area and was greater than 2 km. middle image from USGS. Bolch et al (2010) identified a 25% loss in glacier area in Alberta from 1985 to 2005, indicating the retreat goes on regionally. The third image is of the trimline above the glacier marking the height of the glacier a century before.
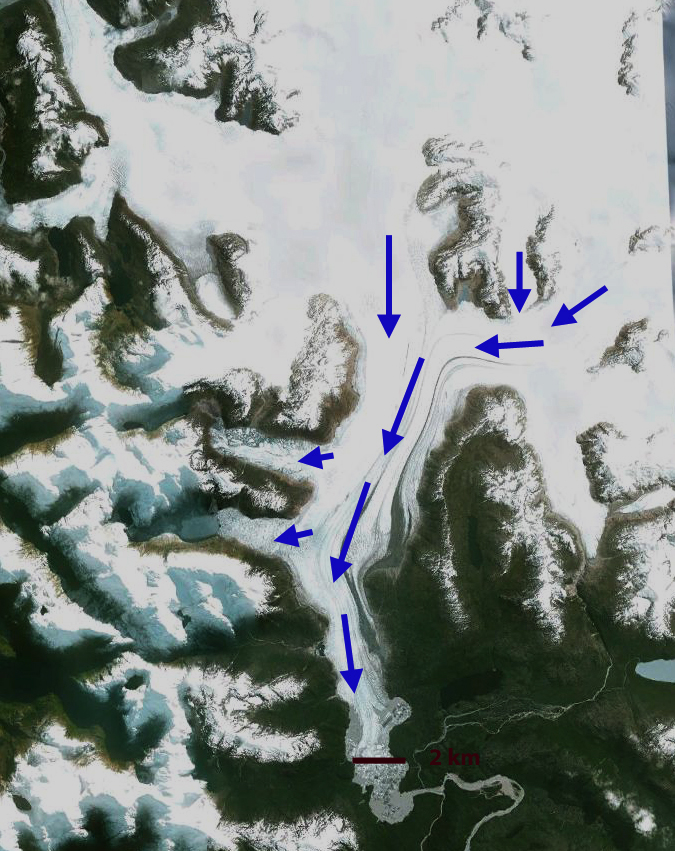
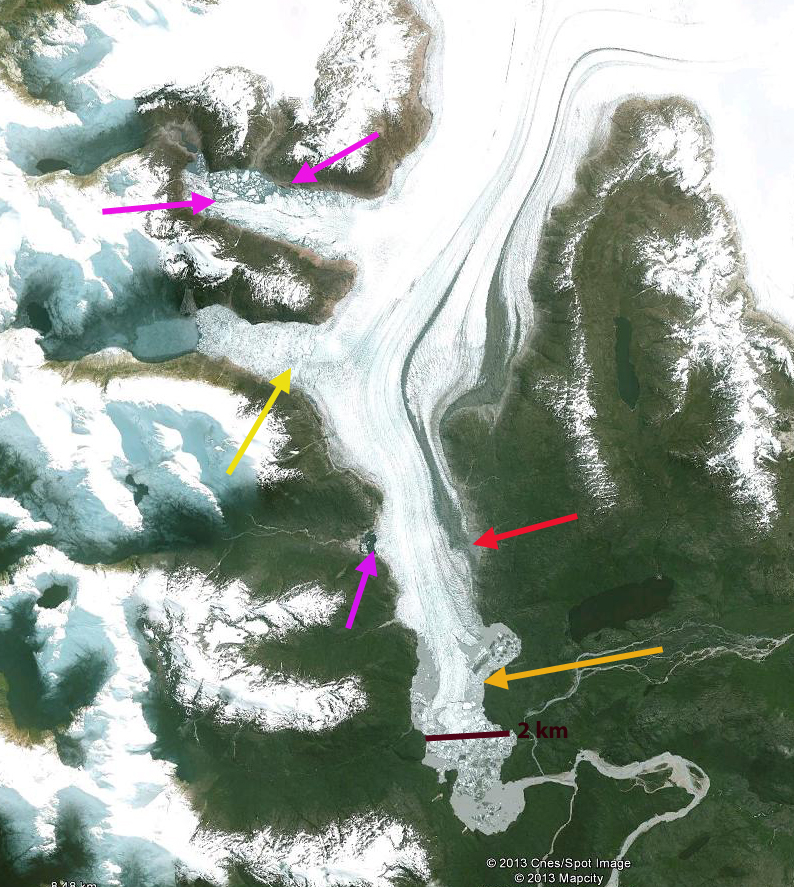
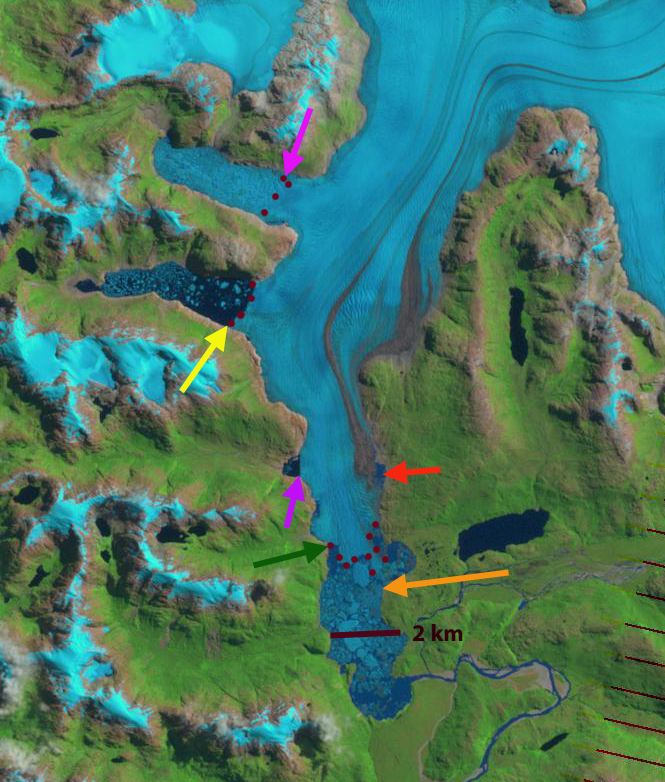
Below is a series of Landsat and Google Earth images from 1986, 2001, 2004 and 2012 in that order. The position of the terminus in the Landsat and Google Earth images rely on a few specific locations for reference. The outlet of the lake has remained the same over the last 25 years and is marked by an O. A ravine angled to the terminus in the 1980s from the north, yellow arrow. There is a pair of deep ravines on the south side that a pink arrow is between. The purple image indicates a tributary and the orange arrow the snowline. The glacier has retreated 700 meters from 1983 to 2012. The change in terminus position with respect to the lake is particularly evident. The tributary from the south has also retreated, purple arrow. The snowline in these images which are not at the end of the summer are at 2500 m, with the snowline rising to 2600 to 2700 m m by summer’s end. This is a higher snowline than reported for the glacier in the 1950’s, (Ommaney, 2002).
A close up view of the terminus in Google Earth indicates a series of recessional moraines that have formed during the retreat, green arrows, these typically form during the winter when the terminus can advance a few meters due to the lack of ablation. The lower portion of the glacier lacks crevassing and has numerous incised streams which suggests the retreat of 25-30 meters/year will continue. This is a slower rate than on the Columbia Glacier that drains east from the icefield.
Variations in Greenland Ice Sheet outlet glacier behavior
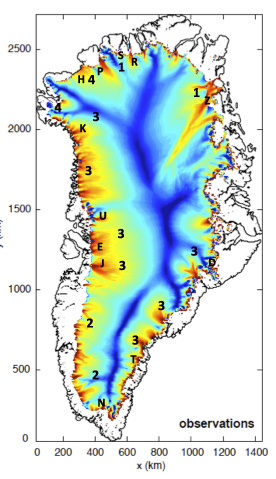
The Greenland Ice Sheet has an area of 2.17 million square kilometers (1.28 million square miles) and spans 18 degrees of latitude from north to south. It is not surprising that over this vast area that the geology and climate vary substantially and that this leads to variations in behavior of Greenland glaciers. Our tendency is to lump the Greenland Ice Sheet into one category impacted similarly by each of the dynamic forces that impact flow. This is akin to saying banks, credit unions and savings and loan institutions are impacted similarly by all the economic forces. In the case of a recession there is a shared signal, just as with global warming there is a shared signal among Greenland glaciers. This is a simplification that does not work. In this article we divide the glaciers into four main categories to illustrate the different properties and sensitiveness of each. This is an updated version of an article Dan Bailey and I wrote first for Skeptical Science, updated here with links immediately below to the individual glaciers that emphasize the specific changes and with new references. In recent years the most striking aspect of Greenland Glaciers is that the signal of change is so strong and on so many of the different glaciers. The specific response is different, which if we try to lump the glaciers into one category, makes the data look noisy. Instead if we look at the response of glaciers with similar dynamics than the signal of response is strong indeed. Base Map indicates the glacier types 1-4 distribution and key glacier locations with specific posts below. P=Petermann, R=Ryder, S=Steensby, H=Humboldt, Z=Zacharaiae, D=De Reste Bugt, T=Thyrm, N=Narssap Sermia, J=Jakobsan, E=Epiq Sermia, U=Umiamako, K=Kong Oscar. Greenland Mittivakkat Glacier Ryder Glacier Humboldt Glacier Petermann Glacier Kuussuup Sermia Thrym Glacier Retreat Tiningnilik Glacier Lake Jakobshavn Isbrae Zachariae Isstrom Umiamako Glacier Alison Gletscher Dodge and Storm Glacier Kong Oscar Glacier De Reste Bugt Qaleraliq Glacier Upernavik Glacier Apuserajik Glacier Epiq Sermia Sarqardliup Seremia Narssap Sermia Steensby Glacier Sortebrae Glacier, Greenland
Greenland glaciers fall into at least 4 common types, each with its own unique sensitivity to sea surface temperature, surface melting, meltwater lubrication, calving changes, etc.
Type 1: Northern, with Large Floating Termini
Northern glaciers with large floating termini (Petermann, Ryder, Steensby, Zachariae, Academy, etc). Each of these is a marine terminating outlet glacier that has an extensive floating ice shelf. The large ice shelves can exist in part due to the lower surface melt rates and the lower flow rates of the glacier. Petermann Glacier is the fastest with a flow speed of 1000 m/year at the grounding line. This is much less than the average outlet glacier speed along the west coast. The large floating ice shelves are susceptible to bottom melting but, except for Petermann Glacier, we have no observations of the process or that more warm water is penetrating under these ice shelves. Rignot and Steffen (2008) found that at Petermann Glacier 80% of the ice loss into the ocean was from basal melting of the floating tongue. If the ice shelves are removed, the feeding glacier is less buttressed and will accelerate for a period and draw down its surface profile. The recent ice area lost by Petermann, Steensby, Academy and Zachariae Ice Stream indicate these glaciers are being impacted by the increased melting at the surface and likely the base of the ice shelf for Petermann Glacier at least.
Examination of how far the high velocities extend inland in Figure 2 and 3 indicates that it is only Zachariae and Petermann that tap far into the ice sheet. This northern area has low accumulation rates, and a shorter less intense melt season. The early onset of melting and lack of accumulation in 2010 led to an early exposure of the ablation zone on these glaciers. This is their sensitivity Achilles Heel: relatively little increases in melt can expand the ablation zone appreciably given the low surface slopes and low accumulation rates. Based on the velocity map, it is the Zachariae that is likely the only of this group that would be comparable to a bank that is too big to fail as its increased velocity band extends well into the ice sheet (Joughin et al, 2010).
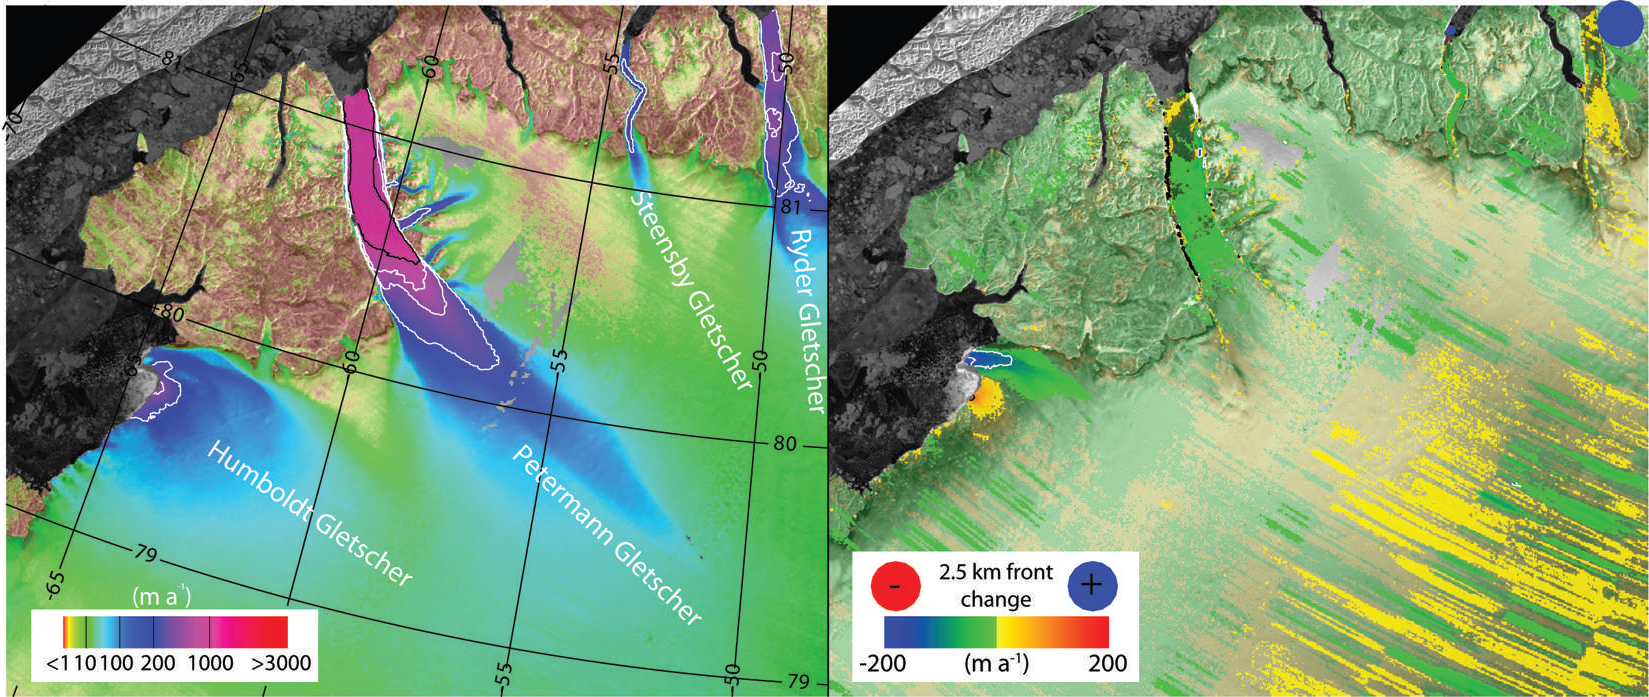
Figure 1. Velocity of Petermann and Humboldt Glacier, the latter does not have a deep bedrock trough extending to the heart of the GIS.
Fig 2. Ice flow speed for Zachariae Glacier (Joughin et al, 2010)
Type 2: Inland-terminating
Glaciers with inland termini lacking any calving (Sukkertoppen, Frederickshaab, Russell, etc). Between the fast flowing marine terminating outlet glaciers, the ice sheet particularly in the southwest quadrant has numerous glaciers that terminate on land or in small lakes. The velocity of these glaciers reaches a maximum of 1-2 meters/day. Each terminates on land because total ablation over the glacier equals total accumulation at the terminus. These glaciers are more like a typical alpine glacier and are susceptible to the forces that tend to cause alpine glaciers to experience peak flow during spring and early summer. Those forces are the delivery of meltwater to the base of the glacier, when a basal conduit system is poorly developed. This leads to high basal water pressure, which enhances sliding. As the conduit system develops the basal water pressure declines as does sliding, even with more water. In the long run it is not clear that more melt will lead to sustained higher velocities as a more efficient drainage system leads to lower basal water pressures. Sundal et al, (2011), best illustrated this.
Fig 3. An example of a two-dimensional ice-velocity map of the study area in southwest Greenland Inland terminating glaciers velocities (Sundal et al, 2011).
This is what has been recently reported to be the case by Sundal et al (2011). The meltwater lubrication mechanism is real, but as observed is limited both in time and area impacted. It is likely that, as on alpine glaciers, the seasonal speedup is offset by a greater slowdown late in the melt season. Most observed acceleration due to high meltwater input has been on the order of several weeks, leading to a 10-20% flow increase for that period. The role of supraglacial lakes in this has been a point of emphasis; Luthje et al, (2006) noted that the area covered by supraglacial lakes was independent of the summer melt rate, but controlled by topography. This led Luthje et al (2006) to conclude that the area covered by supraglacial lakes will remain constant even in a warmer climate. This suggests that the enhancement of flow by the drainage of such lakes would be limited.
The land terminating glaciers such as Sukkertoppen, Russell and Mittivakkat are retreating significantly in response to global warming. This is an indication of negative mass balance. The latter glacier in southeast Greenland has retreated 1200 meters since 1931 (Mernild et al, 2011). The Mernild study identified this slow rate compared to the outlet glaciers and, based on mass balance observations, that the current surface mass balance can only support a glacier at most one-third its current size. This indicates the slow but inexorable sensitivity of the non-calving glacier to surface mass balance change. Moon and Joughin (2008) observed that the retreat of the land terminating glaciers was relatively minor from 1992-2007, averaging 5 m/year or less. These glaciers are the equivalent in our banking system to the local banks: there are many and they are sensitive, but the changes in a single one is not important.
Type 3: Marine-terminating
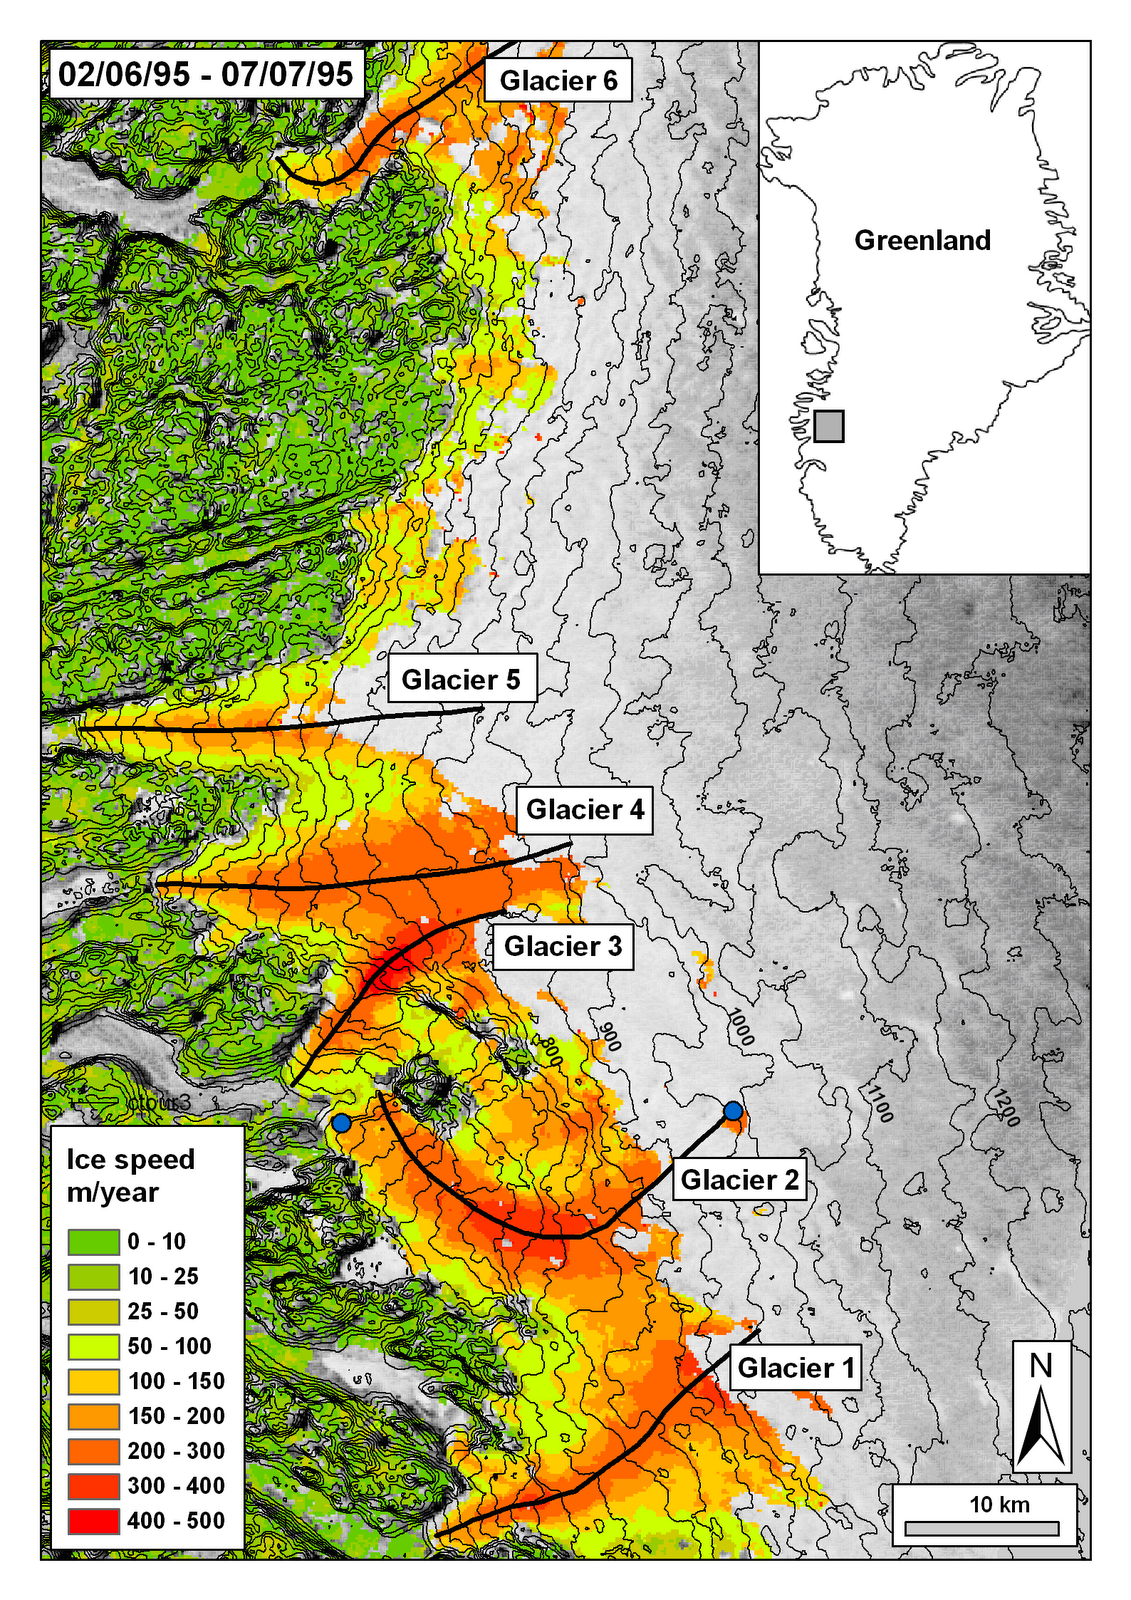
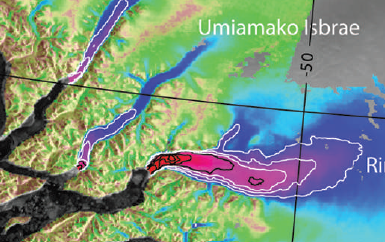
Fast flowing marine terminating outlet glaciers of western and southeast Greenland (Rinks, Umiamako, Helheim, Jakobshavn, Epiq Sermia, etc). These are the glaciers that drain the greatest area of the ice sheet and deliver the greatest volume to the oceans via calving. The flux from many of the larger glaciers is over 10 km3/year (DMI). Each of these glaciers is fast-flowing at the terminus; the fast flow section extends inland into the ice sheet up a sub-glacial trough. The outlet glaciers act like a drain capturing ice from a larger area of the ice sheet than their narrow terminus would suggest.
Figure 4. Umiamako Glacier is typical with the highest velocity near the calving front and the high velocity ice stream extending back into the ice sheet.
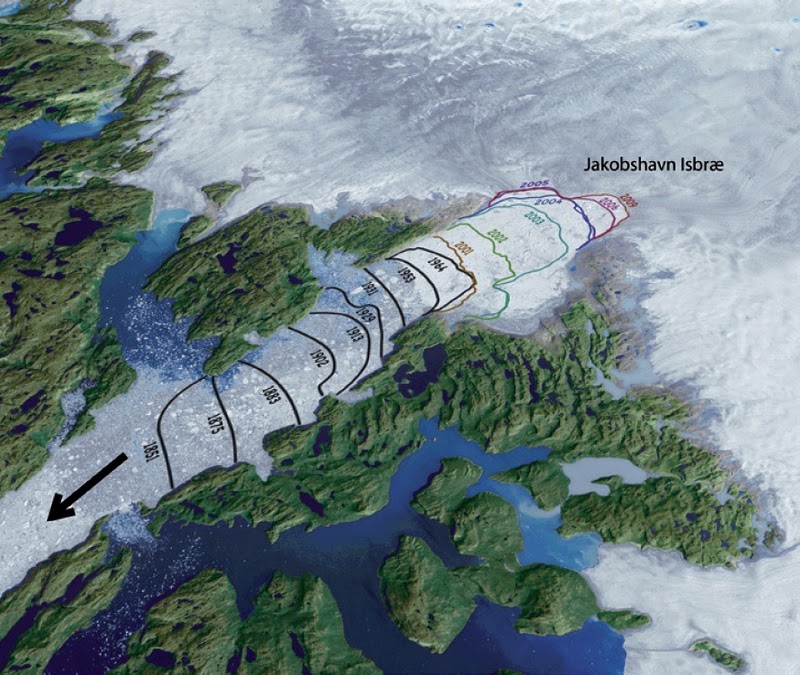
Figure 5. Jakobshavn Glacier terminus retreat, the recent retreat has been associated with thinning and faster flow.
Pelto et al (1989), a paper on the equilibrium state of the Jakobshavn Glacier, showed that the terminus had not changed significantly in 30 years; its velocity had also been consistent. Furthermore, it was observed that the velocity was consistent throughout the seasons. This indicated that the glacier velocity was not being impacted by the meltwater pulse each summer.
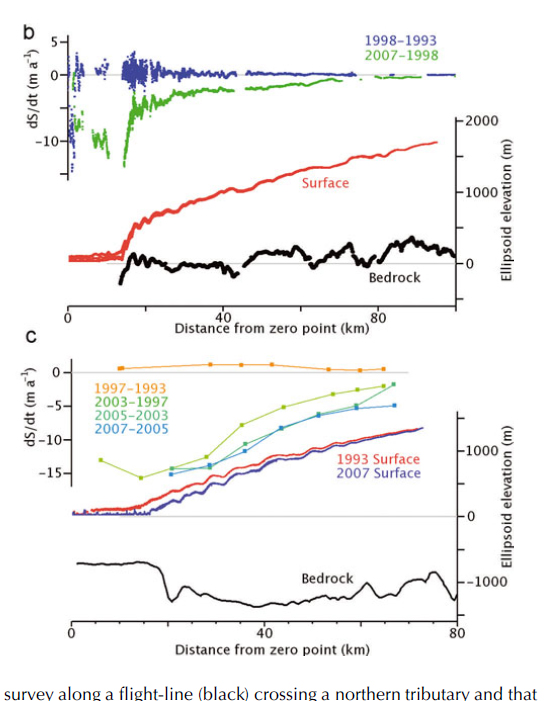
Bob Thomas (NASA, 2004) and Terry Hughes (University of Maine, 1986) developed the basic mechanism of flow for the glacier that has proven to be true. The outlet glaciers have a balance of forces at the calving front. The fjord walls, the fjord base and the water column impede flow. The slope of the glacier, its upglacier velocity and the height of the calving face strive to increase flow. If the glacier thins than there is less friction at the calving front from the fjord walls and the fjord base, leading to greater flow. The enhanced flow leads to retreat and further thinning, resulting in the thinning and the acceleration spreading inland. In 1990 it was not envisioned that acceleration would occur as soon as it has, yet that was the motivation for the research.
Fig 6. Jakobshavn profile (Thomas et al, 2009)
In 2001 acceleration of Helheim, Jakobshavn and Kangerdlussaq Glacier caught the attention of the world. By 2007, acceleration had been noted at all 34 marine terminating outlet glaciers observed.
The acceleration was not significantly seasonal; Howat et al (2010) noted a 15% seasonal component to the acceleration, it had spread inland and had led to retreat and thinning. This demonstrated that the marine terminating glaciers were largely responding to a change in the balance of forces at the glacier front.
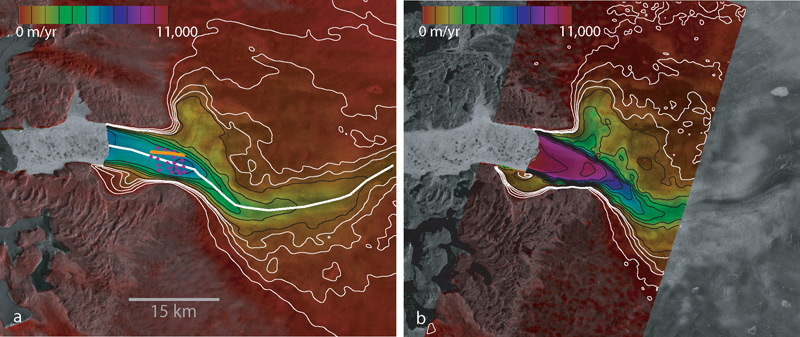
Fig 7. Ice flow velocity as color over SAR amplitude imagery of Jakobshavn Isbræ in a) February 1992 b) October 2000. In addition to color, speed is contoured with thin black lines at 1000 m/yr intervals and with thin white lines at 200, 400, 600, and 800 m/yr. Note how the ice front has calved back several kilometers from 1992 to 2000. Further retreat in subsequent years caused the glaciers speed to increase to 12,600 m/yr near the front. (Ian Joughlin, Big Ice)
The recent increases in outlet glacier discharge have always been coincident with partially floating ice tongue losses. This causes reduced back pressure at the glacier front, letting up on the brakes; the resulting glacier thinning leads to less basal friction and further acceleration. If the glacier front retreats into deeper water the process will continue and increase. This is why understanding the basal slope changes inland of the calving fronts is crucial. Moon and Joughin (2008) observed the terminus change of 203 glaciers from 1992-2007 and noted a synchronous ice sheet wide retreat of tidewater outlet glaciers. The thinning could be due to increased surface melt, basal melt or most likely a combination of the two. Certainly the supraglacial lake drainages are not the key as the widespread acceleration in the southeast and southwest Greenland, yet the southeast has less than 10% of the lakes of the southwest , as documented by Selmes et al (2013) in a paper submitted to the Cryosphere.
Moon and Joughin (2008) reported for the 2000-2006 period:In the southeast quadrant 35 glaciers retreated an average of 174 m/year. In the eastern quadrant 21 glacier retreated an average of 106 m/year. In the northwest 64 glaciers retreated an average of 118 m/year. Each quadrant’s retreat increased markedly after 2000. In east central Greenland Walsh et al (2012) noted the retreat of all 37 outlet glaciers examined. Bjork et al (2012) note the terminus change in 134 east Greenland glaciers, idenitifying the last decade as the most rapid for marine terminating glaciers but not land terminating glaciers. The largest of this group are comparable to the banks that are too big for our banking system to allow them to fail: they drain a substantial portion of the entire ice sheet and reach so far into the ice sheet that their behavior can impact that of other adjacent glaciers.
Type 4: Marine-terminating in Shallow Water
Marine terminating glaciers outlet glaciers in shallower water (Humboldt, Cornell, Steenstrup etc). These glaciers do have calving termini, but lack the large fast flowing feeder tongues extending into the glacier. This is because there is not a topographic low under the ice sheet that funnels the flow. Humboldt Glacier is the widest front of any Greenland Glacier, wider even than Petermann Glacier. However, the velocity on average is low at 100 m/year and the base of the glacier is quite high. This makes it difficult for a large calving retreat of the glacier to occur and extend inland. Humboldt Glacier is retreating but as the velocity profile indicates the glacier, despite its size, does not tap dynamically into the center of the ice sheet. These glaciers are substantial, but their failure (though significant for sea level) would not destabilize the ice sheet as a whole. Naarsap Sermia would be another example in southwest Greenland. Dodge and Storm Glacier an example in northwest Greenland.
The amazing aspect of Greenland glaciers is that (despite the specific variation in type, location specific fjord configuration, etc) their response has been as uniform and synchronous to global warming as has been observed. If this warming of the world persists long enough, the ice “banks” of Greenland will begin to fail. Those with the greatest reserves on their asset sheets and the fastest turnover, and thus having the greatest potential contributions to sea level rise over time, are: In the north, Zachariae (and to a lesser extent, Petermann). The fast flowing marine terminating outlet glaciers of western and southeast Greenland (Rinks, Umiamako, Helheim, Jakobshavn, Epiq Sermia and Kangerdlussaq).
The surface mass balance of the glacier is the difference of accumulating snow on the ice sheet (its income) and snow and ice losses from melting and calving (its expenditures). The volume of the ice sheet is its asset. On an ice sheet, the main factor driving flow is simply the mass balance input in the accumulation zone. The higher the accumulation rate the faster the movement; the accumulated snow is inexorably moved downslope towards the ocean and the margin of the ice sheet. Observation of a precipitation map (focused not on the outer margin, but on the accumulation zone of the ice sheet) indicates that highest accumulation rates, over 40 cm per year, extend along the western side of the ice sheet to the southeast quadrant of the ice sheet. The southeast quadrant also has many fewer surface lakes than the southwest quadrant.
Figure 9. Mass balance in Greenland from Van Den Broecke et al, (2009)D denotes change in ice discharge while SMB denotes the net surface mass balance (accumulation minus ablation).)
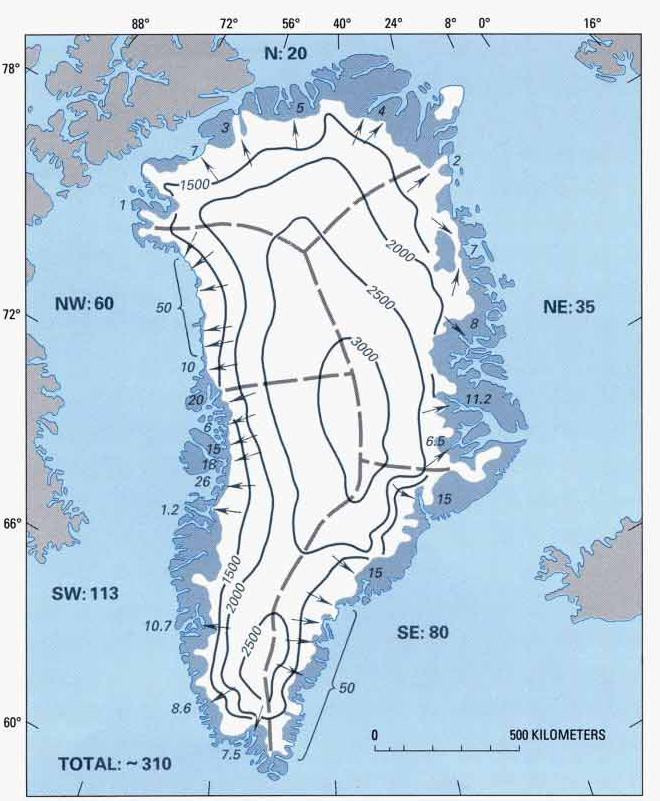
Fig 10. Distribution of precipitation in Greenland (in grams per square centimeter per year). Contours dashed where inferred. Ice-free areas are shown in dark gray. (USGS, Satellite Image Atlas of Greenland)
The overall topography of the ice sheet is controlled both by the basal and peripheral geology and the mass balance distribution of the ice sheet. The higher rates of mass accumulation inland and the greater melting nearer the margin yield a steeper profile for the ice sheet.
Figure 11 shows that the contours have the closest spacing along the west margin and in the southeast, just as the high accumulation rates in those areas would suggest. Thus the combination of the surface slope and the accumulation rate drive faster flow in these regions.
Climate change has led to an observed increase in surface melting, surface accumulation, increased discharge and overall mass balance losses. The very mechanism that establishes the basics of behavior of the GIS mass balance are changing (Zwally et al, 2011). This is leading to most Greenland glaciers retreating, most outlet glaciers accelerating, an increase in the number and elevation of Greenland lake, expanding melt extent on the ice sheet. The 2012 seasons extraordinary ice melt extent is illustrated by the video below of Marco Tedesco’s melt extent data set.
Glaciar Steffen is the south flowing glacier from the 4000 square kilometer Northern Patagonia Icefield (NPI). Several key research papers have reported on the spectacular retreat of this glacier in recent years. Here we report those result and examine Landsat and Google Earth imagery to fully illustrate the changes. A JAXA EORC, 2011 report compared parts of the Glaciar Steffen terminus change from 1987 to 2010. They noted a retreat of approximately 2.1 km of the main stem and 870 m of a western terminus. They noted a remarkable collapse of the terminus tongue. Davies and Glasser (2012) in examining changes in Patagonian glaciers that the rate of area loss of the NPI increased dramatically after 2001, and has been 9.4 square kilometers/year. The loss of 94 square kilometers is 2.25% of the entire NPI. Rivera et al (2007) reported that Glaciar Steffen lost 12 square kilometers and had an average thinning of 1.5 m in the ablation zone from 1979-2001.
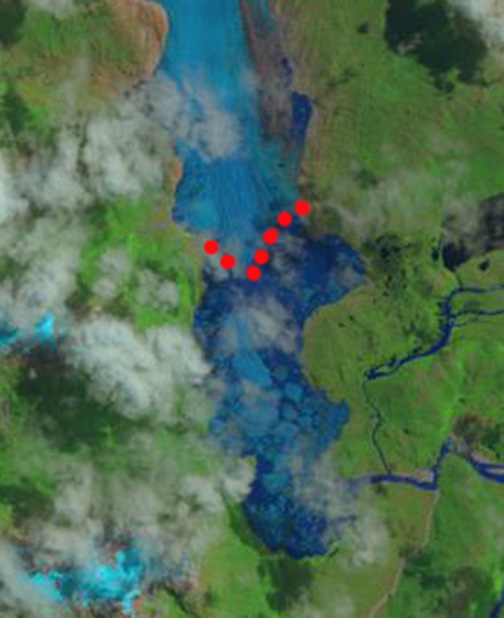
In this examination we use an EROC provided image from 1987, Landsat from 1999, Google Earth 2003, Landsat 2004, Landsat 2011, Landsat 2012 and Landsat 2014. The light orange arrow is in the same location a reference point for the main terminus in each image. The terminus is indicate by burgundy dots. There are three lakes on the west margin of the glacier that have been fed by separate glacier tongues. From south to north they are indicated by a purple, yellow and pink arrow. A new lake has emerged on the east side of the glacier at the orange-red arrow which is at the same location in each image. In 1987 the lake at the terminus of the glacier is 1.3 km from north to south. The NW most terminus is 4 km from the main trunk of Steffen. The middle west terminus, yellow arrow extends 1.7 km west from the main trunk. There is no lake evident at the red arrow. In 1999 the northwest terminus has retreated little but is showing signs of breakup. The middle west terminus, yellow arrow, has retreated to within a half kilometer of the main trunk by 1999. The main terminus has retreated little sinc 1987 on the west side but has retreated 700 meters on the east side. In 2003 the northwest terminus has begun a retreat exposing a new section of lake. The middle terminus cannot be discerned. The main terminus is now an isolated tongue in the midst of the terminus lake, with open water along the east and west margins. In 2004 the northwest terminus has changed little from 2003. The middle terminus is evident from a shadow that can only come from the calving front cliff, it appears advanced somewhat from 1999. By 2011 the main terminus tongue from 2003 and 2004 is gone, the terminus has retreated north of the orange arrow. A new lake is evident on the east side at the red arrow. The middle west terminus has retreated back to the main glacier. In 2012 the main terminus has retreated 3.4 km from 1987, there are small lakes on either side of the glacier above the terminus indicating that the lower 2 km of the glacier is still likely to be lost soon, back to the red and pink arrows. Modest retreat has occurred by 2014 but is difficult to quantify in the cloudy image. The northwest and middle west terminus are both nearly back to the main glacier having retreated 3.8 km and 1.3 km respectively since 1987. This retreat includes that of , Gualas GlacierReichert Glacier, Nef Glacier, and Colonia Glacier.
1987 EROC image
The Whitechuck Glacier supplies flow to the headwaters of the Whitechuck River. Its white expanse has graced these headwaters for thousands of years. The Whitechuck Glacier retreated slowly from its advanced Little Ice Age position until 1930, while rapidly thinning. Thus, prepared it began a rapid retreat in 1930. This rapid retreat culminated in the total disappearance of the north branch of the glacier in 2001. No more does this glacier dominate the headwaters, and its demise has and will continue to alter the hydrology of the Whitechuck River headwaters. How did this glacier die and what are the impacts when a glacier disappears? This is the glacier that also led to the first glacier survival forecast model.
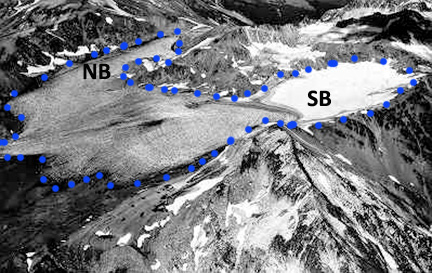
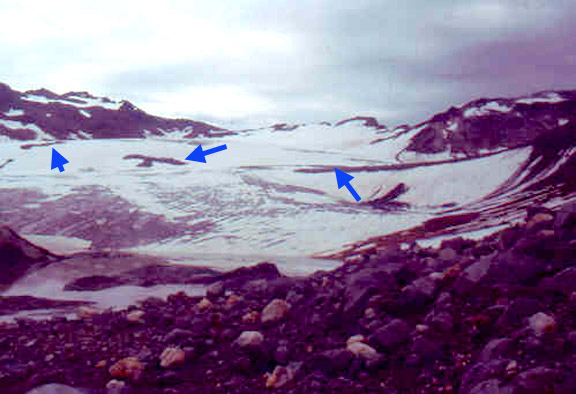
A progressive temperature rise from the 1880’s to the 1940’s led to ubiquitous retreat of North Cascade glaciers. The Whitechuck Glacier was no exception: by 1950 the glacier’s northern terminus had retreated 1050 m and the southern terminus 750 m. More importantly the glacier had thinned dramatically. The glacier had flowed down relatively gentle slopes into a large flat basin. The 1967 aerial photograph of the area from Austin Post, USGS indicates the two merged branches of the glacier North Branch (NB) and south Branch (SB), note the lack of snowcover on the North Branch (Figure 1).
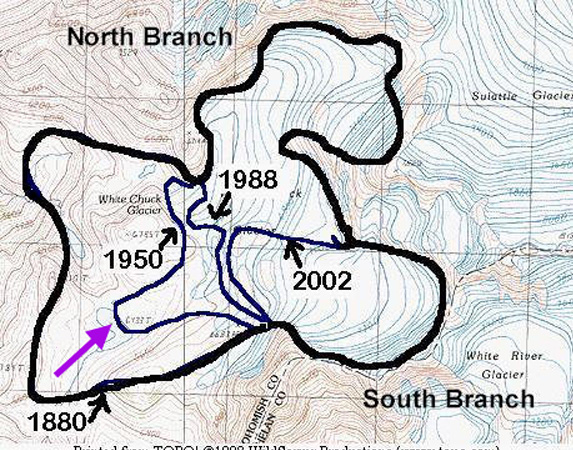
The USGS topographic maps of Glacier Peak from 1958 show the still large Whitechuck Glacier with an area of 3.1 km2 (Post et al., 1971). The USGS remapped the area based on aerial photographs from 1983.and this map still has two branches with two termini, the northern branch feeding the northern terminus, and the southern branch feeding both the northern and southern terminus. Both branches exceeded a mile in length in the 1950’s (Figure 2).
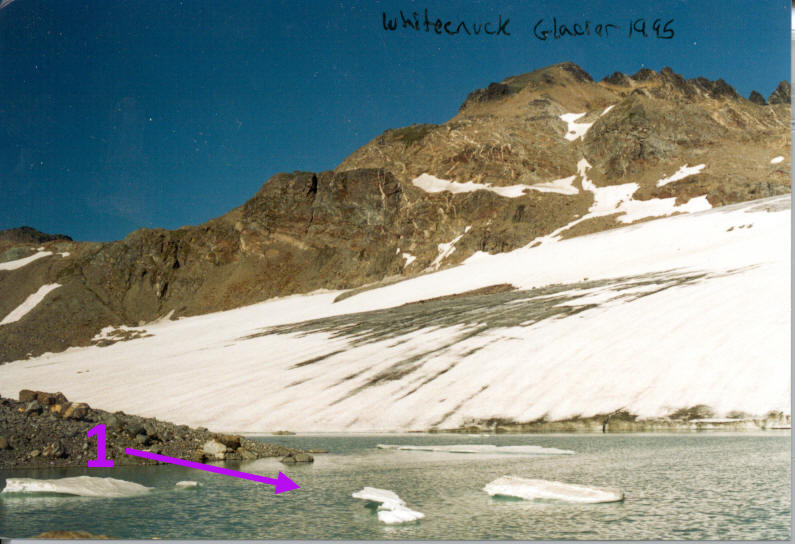
The 1984 the USGS maps of the East Glacier Peak and West Glacier Peak quadrangles indicate the southern terminus had retreated 450 m, from the 1958 map terminus position. The northern terminus had retreated 180 m and was still near the lip of a basin at 1975 m. In 1988 during our field visit the southern terminus of the glacier ended in a new lake #1 at 2020 m (Figure 3). The lake is not in evidence on the 1984 updated USGS topographic maps or in 1979 aerial photographs of the area. The terminus had retreated 510 m since 1955, and 140 m since 1967. The lake that had been the terminus location in the 1958 map still exists, but is now 375 m from the edge of the new terminal lake, and has recessional moraines evident (Figure 4). The south branch of the glacier is thin and stagnant in the lower 200 m. Above this point crevasses are in evidence and the convex profile indicates that the south branch was still an active glacier in 1988. This remains the case in 2005, while in the former location of the north Branch several small lakes are evident where the glacier used to be.
The northern terminus of the Whitechuck Glacier ends in a lake basin at 1980 m in 1988. This basin was filled with glacier ice in 1967. In 1988, the new lake was 210 m long and still expanding. Total retreat of the terminus from 1955-1988 was 410 m. The northern half of Whitechuck Glacier extending up to Glacier Gap was a rapidly melting, concave, stagnant ice mass in 1988. The north branch had no crevassing and even the ice at the glacier surface lacks the normal blue ice color of glacier ice. Instead it was a dull dark grey color. The distance from the terminus to the top of this section of glacier is 1550 m. Total glacier area has decreased from 3.1 km2 in 1958 to 1.8 km2 in 1988 (Figure 5).
1995 the southern terminus had retreated an additional 50 m expanding the lake #1 at the terminus (Figure 6). The south branch of the glacier no longer actively feeds the northern terminus, as the ice had become to thin for motion. The glacier ended in the lake on a gentle slope. The northern lobe was stagnant ice with no retained snowcover, and was only a narrow 500 m long section of ice, we quickly ascended this section on crampons in 1995. The upper most section had separated from the main body of the glacier at 2134 m. The area of the glacier had declined to 1.6 km2 in 1995.(Figure 7)
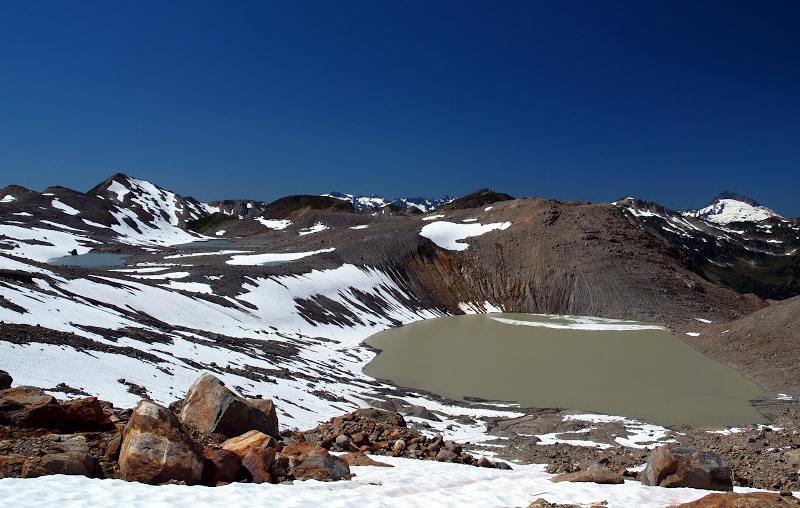
In 2002, the northern branch of the glacier was entirely gone. Instead of an ice filled valley extending 1.6 km from the lake to Glacier Gap at the former head of the glacier, there was a boulder-filled basin. There is a new lake #3 that has developed at 2000 m, 400 m northeast of the terminus lake #2. The walk to Glacier Gap took much longer picking our way through the loose bouldery terrain.
Upon our return in 2002 the entire northern branch was gone. The southern branch was thin and viewed from the 1950 terminus position lake illustrates the retreat. The southern lobe of the glacier is still thinning slowly, and retreating. A comparison of glacier surface elevation in 1983 and 2002 identifies the average thinning in the twenty year period from the USGS aerial photography in 1983 to 2002, for the northern branch is 15 m. For the southern branch the average thinning is 6 m. The total area of glacier ice left including the stagnant section by the northern terminus is 0.9 km2 less than 30% of the area of just 30 years ago. At the current rate of thinning and given the current ice thickness of 35 m this glacier will endure for the first half of this century. The south branch is not close to equilibrium and though its retreat is hastened by the recent warm weather. A comparison of the glacier viewed from Glacier Gap illustrates the change, in 1973. A view of the basin in 2005 indicates the four lakes that have formed the lack of a north branch and the limited snowcover on the south branch. (Neil Hinckley photo) and 2006 (Leor Pantilat photo) (Figure 8 and Figure 9)
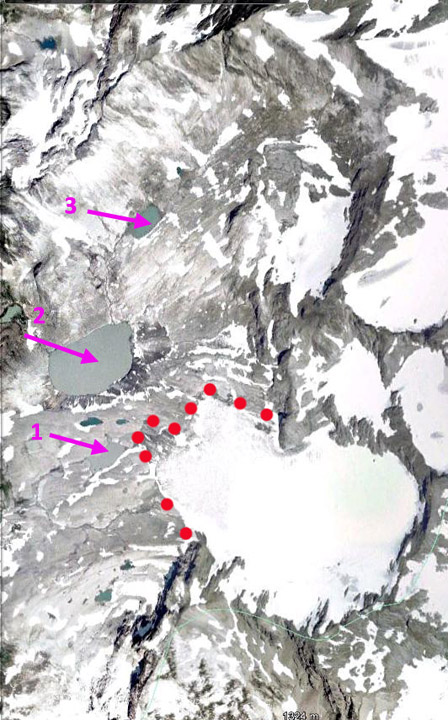
The largest and deepest is Lake #2 this is where the two glaciers used to intersect. A 2006 Google Earth view illustrates the glacier extent down to 0.7 km2 in 2006 from 3.1 km2 in 1958 (Figure 10and 11) .
The retreat of this one glacier has led to the development of six new lakes, three in the last thirty years. By 2010 the relict ice around lake #2 was gone (Figure 12).
The 3.4 km2 of new bare bouldery surface can be slowly colonized by vegetation. Compared to many areas of glacial retreat where natural revegetation takes place fairly rapidly, there it is an achingly slow process, where even the portions of the basin exposed for fifty years have gained little colonizing vegetation. This may be because of the extremely limited growing season (the basin still has snowcover into July), and its relative isolation from seed sources. The loss of area has impacted glacier biota, such as ice worms, springtails, algae, bacteria, and other invertebrates and microbial organisms living on and in under these glaciers. This represents a substantial loss in biological processing and material that would otherwise be transferred downstream.
The amount of runoff entering the Whitechuck River has declined substantially in the summer. For thousands of years each square meter of glacier has contributed 800 gallons of runoff from July I-October 1. With the loss of glacier ice, this contribution should drop by 65-80% based on observations at two other sites where glaciers have disappeared (Pelto, 1993 & 2008). The change since 1950 in glacier area has reduced summer glacier runoff by 1.5 billion gallons annually. This represents a loss of between 20 and 25 cfs for the Whitechuck River during the July-September period. The water will also be less sediment laden and warmer. The impact will be less water for the fall salmon runs, and less food in amount and processing for stream invertebrates on which salmon feed downstream in the Sauk and Skagit Rivers. This mirrors the change in the Skykomish River Basin (Pelto, 2010). Two of the field visits to this area were with the late Cliff Hedlund, Corvallis, OR who did in fact sew his own gear.
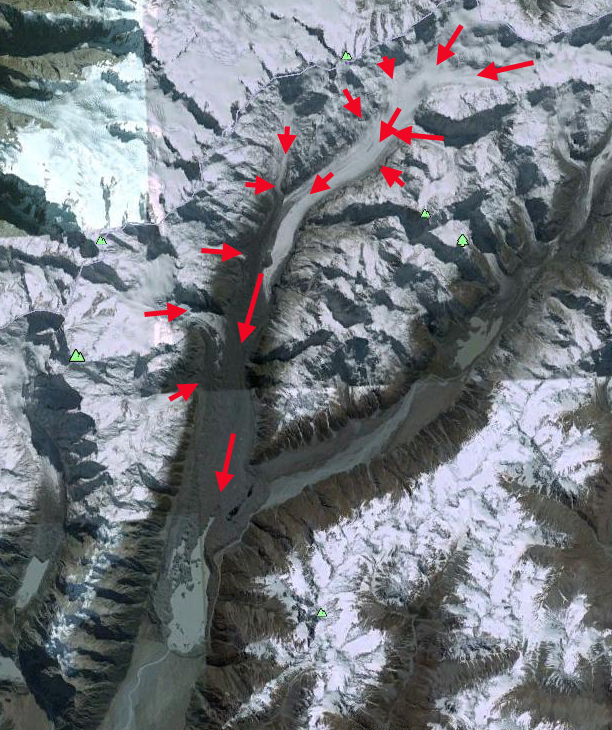
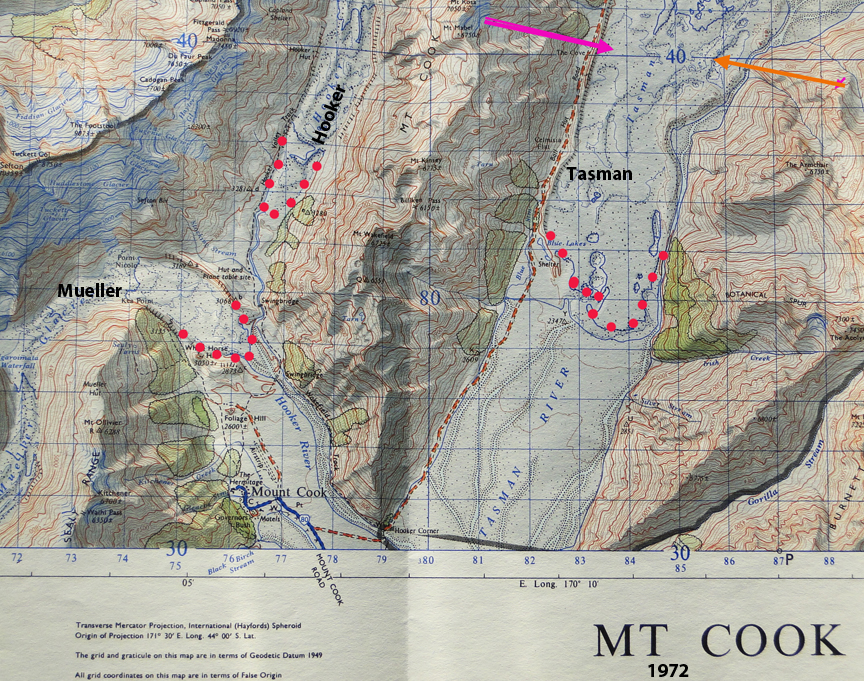
The New Zealand National Institute of Water and Atmospheric Research has been examining the changes in volume and snowline on New Zealand Glaciers since 1977. This survey has concluded for 2011 and 2012 that the snowline has been too high for glacier equilibrium, the glaciers are shrinking. The Tasman Glacier is evidence of this draining from the highest mountains in New Zealand. For Tasman Glacier the retreat has been ongoing, the NIWA has noted a retreat of 180 m per year on average since the 1990’s. Dykes et al (2011) note a maximum depth of 240 m, and an expansion of 0.34 square kilometers per year in area. The proglacial lake at the terminus continues to expand as the glacier retreats upvalley. The lake is deep with most of the lake exceeding 100 metes in depth, and the valley has little gradient, thus the retreat will continue. It has been noted by researchers at Massey University that the lake can expand in this low elevation valley another 9 km, and that at the current rate this will occur over two decades. This post is an update to the Tasman Glacier Retreat post of 2009 updated in 2011. Imagery of Tasman Glacier indicates the future it faces. There was no lake in 1973 and now it is more than 5.5 km long across a width of about 2 km, and 7 km long at its longest point. Here we examine four images, the 1972 topgographic map, 2000, 2012 and 2013 Landsat images and 2006 Google Earth imagery. In each image an orange and a pink arrow indicate the 2013 terminus on the east and west respectively. In the 1972 map there is no lake at the terminus of the Tasman Glacier. In 2000 the Tasman Glacier lake was 2 km long on the west side and 4.5 km along on the east side. By 2006 the lake has expanded 2.5 km on the west side and 5.5 km long in a narrow tongue on the east side. By 2013 the Lake is 5.5 km long from bank to bank. The glacier has experienced two larger calving events in recent years the first triggered by the Christchurch earthquake in February 2011 and the second on January 30, 2012. Such events can occur because the terminus has thinned to the point that the glacier terminus is more buoyant and crevasses and rifts extend through the thinner ice.
2000 Landsat Image
2006 Google Earth Image
2013 Landsat Image
The last image below is a 2012 Landsat image, the blue arrow indicates the extent to which the lake is expected to extend, the snowline in this image is at 2200 m, red arrow. The glaciers retreat is the same pattern as that of Murchison, Mueller and Hooker Glacier. 2012 Landsat Image
Brahmbhatt et al (2012) examine the glacier loss in Warwan and Bhut Basin’s which are sub-basins of the Chenab in India. They note a loss in glacier area from 1962 to 2001 of 19% in Warwan Basin and 9% in Bhut Basin. In this post we examine changes of several glaciers in Warwan basin, where there are 250 glaciers, from 1998 to 2011 using Landsat Imagery and Google Earth imagery. Interestingly Brahmbhatt et al (2012) note that the number of glaciers has increased since 1962, as glaciers have separated into multiple glaciers during the retreat. The glaciers are in the Marwah River Basin. Runoff from the glaciers in the basin feed the 450 MW Baglihar Hydropower Plant on the Chenab River, Jammu & Kashmir State Power Development Corp. The images from 1998, 2000, 2009 and 2011 in that order have a series of arrows indicating specific features. The pink arrow indicates the 1998 and 2000 terminus position of a glacier that reached the valley bottom and redirected the river in that valley. By 2011 this glacier retreated out of the valley bottom, a distance of 350 m, purple arrow indicates the 2011 terminus. A closeup of this terminus will be seen later. The green arrow indicates a smallrock rib amidst the glacier in 1998 and 2000. By 2009 and 2011 this rib had expanded laterally and now extended all the way to the terminus separating the glacier. The yellow arrow indicates the southern terminus tongue of a glacier that in 1998 and 2000 was nearly as prominent as the northern tongue. By 2009 the southern tongue had largely melted away, a retreat of 250 meters, in 2011 clouds obscured the location. The orange arrow indicates the terminus of a glacier that almost reached the valley bottom, turning parallel to the valley just before its terminus in 1998 and 2000. By 2009 and 2011, the terminus no longer made this turn, the width had declined and it was no longer as close to the main valley glacier. The red arrow indicates a glacier on the north side of the valley that has also retreated a few hundred meters in the last decade. The retreat of the glacier that formerly blocked the river valley reduces the potential for seasonal impoundment of the river and sudden release and downstream flooding. Thew Warwan Basin glaciers though smaller are experiencing the same changes as larger glaciers such as Malana Glacier and Samudra Tupa.
The Google Earth image is from 2002. The glacier at this time still impeded the flow of the river downvalley, blue dots. The lower 400 meters of the glacier lacks crevasses and most of this area had melted away by 2011.
Above is a paired Landsat image from 1984 left and 2013 right indicating the 1100 m retreat during this period.
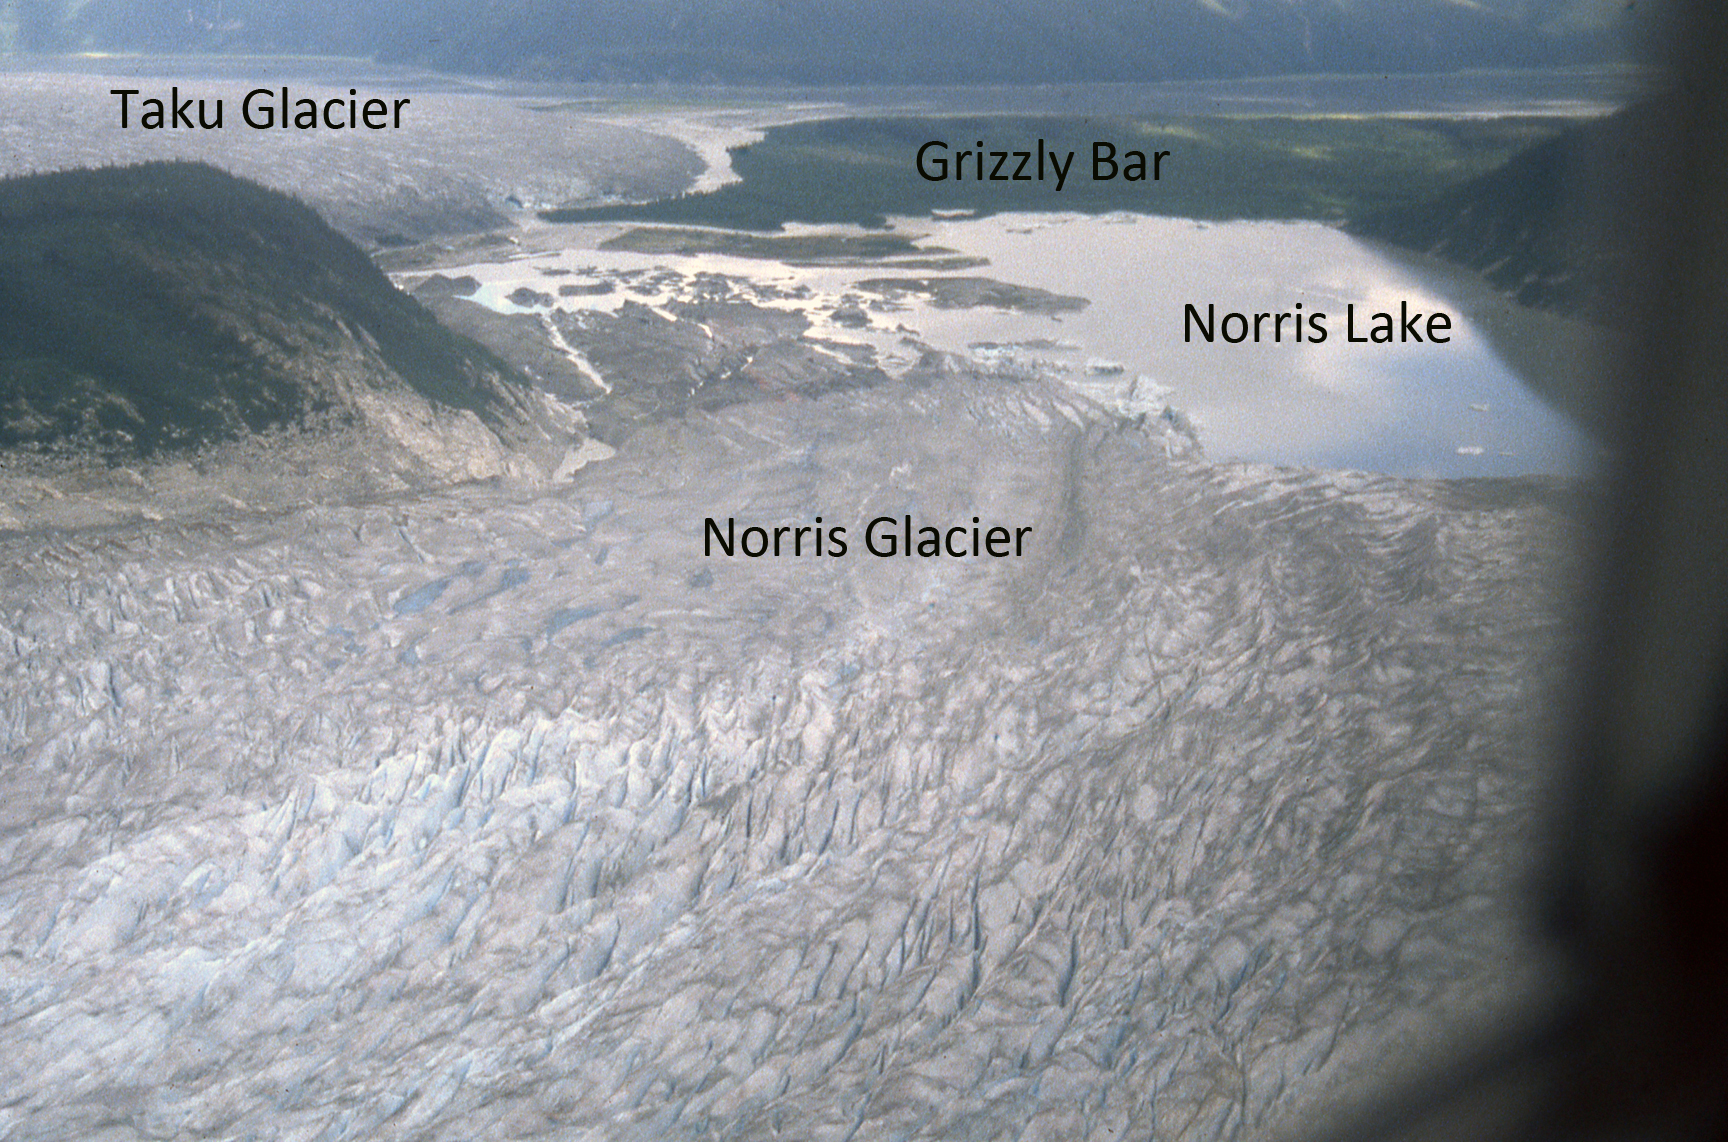
Norris Glacier began retreating before 1890 and has continuously retreated 2050 m from its 19th-20th maximum achieved around 1915. The glacier ended in a lake referred to here as Norris Lake from 1948 until 2007. By 2010 the glacier had retreated from this lake. Here we examine images from fieldwork conducted by the Juneau Icefield Research Program and overflights as part of the program from 1975 to 2010 and Google Earth imagery. I have had the chance to cross this glacier on ski a half dozen times as part of JIRP, and is was seldom an easy traverse, hence the names death valley and dead branch for portions of the glacier. Norris Glacier does not receive much attention as the program is focused on the Lemon Creek Glacier and the more famous and largerTaku Glacier, and does not garner much of our attention.
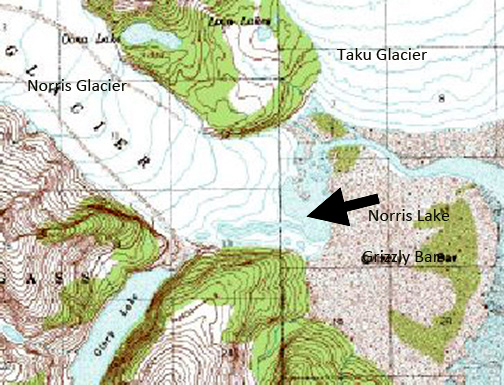
In 1948 the USGS map (top image) indicates Norris Lake was a narrow 200-500 meters wide lake and the glacier terminus was only 200 to 700 meters from Grizzly Bar, increasing with distance south along margin, an outwash plain built by the glacier beyond its advanced terminus position. By 1975 (second image; taken by Maynard Miller JIRP director for fifty years) the glacier had retreated an additional 250 meters, Norris Lake had expanded, but still had considerable ice along its western margin. The terminus was still extending a kilometer downvalley of the outlet of Glory Lake. The view of the entire glacier in Google Earth illustrates the direction of flow and accumulation sources blue arrows, typical snowline red dots and glacier boundary black line.
<In 1998 I had the opportunity to fly over the glacier at the end of the field season. A series of images indicates the trimline that had developed with the recent glacier thinning of the last 50 years. Norris Lake had expanded to a length of 1.2 km on the north shore and 1.9 km on the south shore from Grizzly Bar.
In 2010, images below, the glacier barely reached the edge of Norris Lake and the terminus was well up valley from the Glory Lake outlet, Grizzly Bar was 2.1 km from the terminus. By 2011 the glacier no longer reached the shore of Norris Lake. An examination of the icefall feeding the glacier terminus area indicates considerable melt out of crevasse features, indicating that flow is not that vigorous through the icefall above the terminus at 300 m, suggesting retreat will continue. The trimline hear has increased from 20 m to 50 m above the ice surface since 1975.
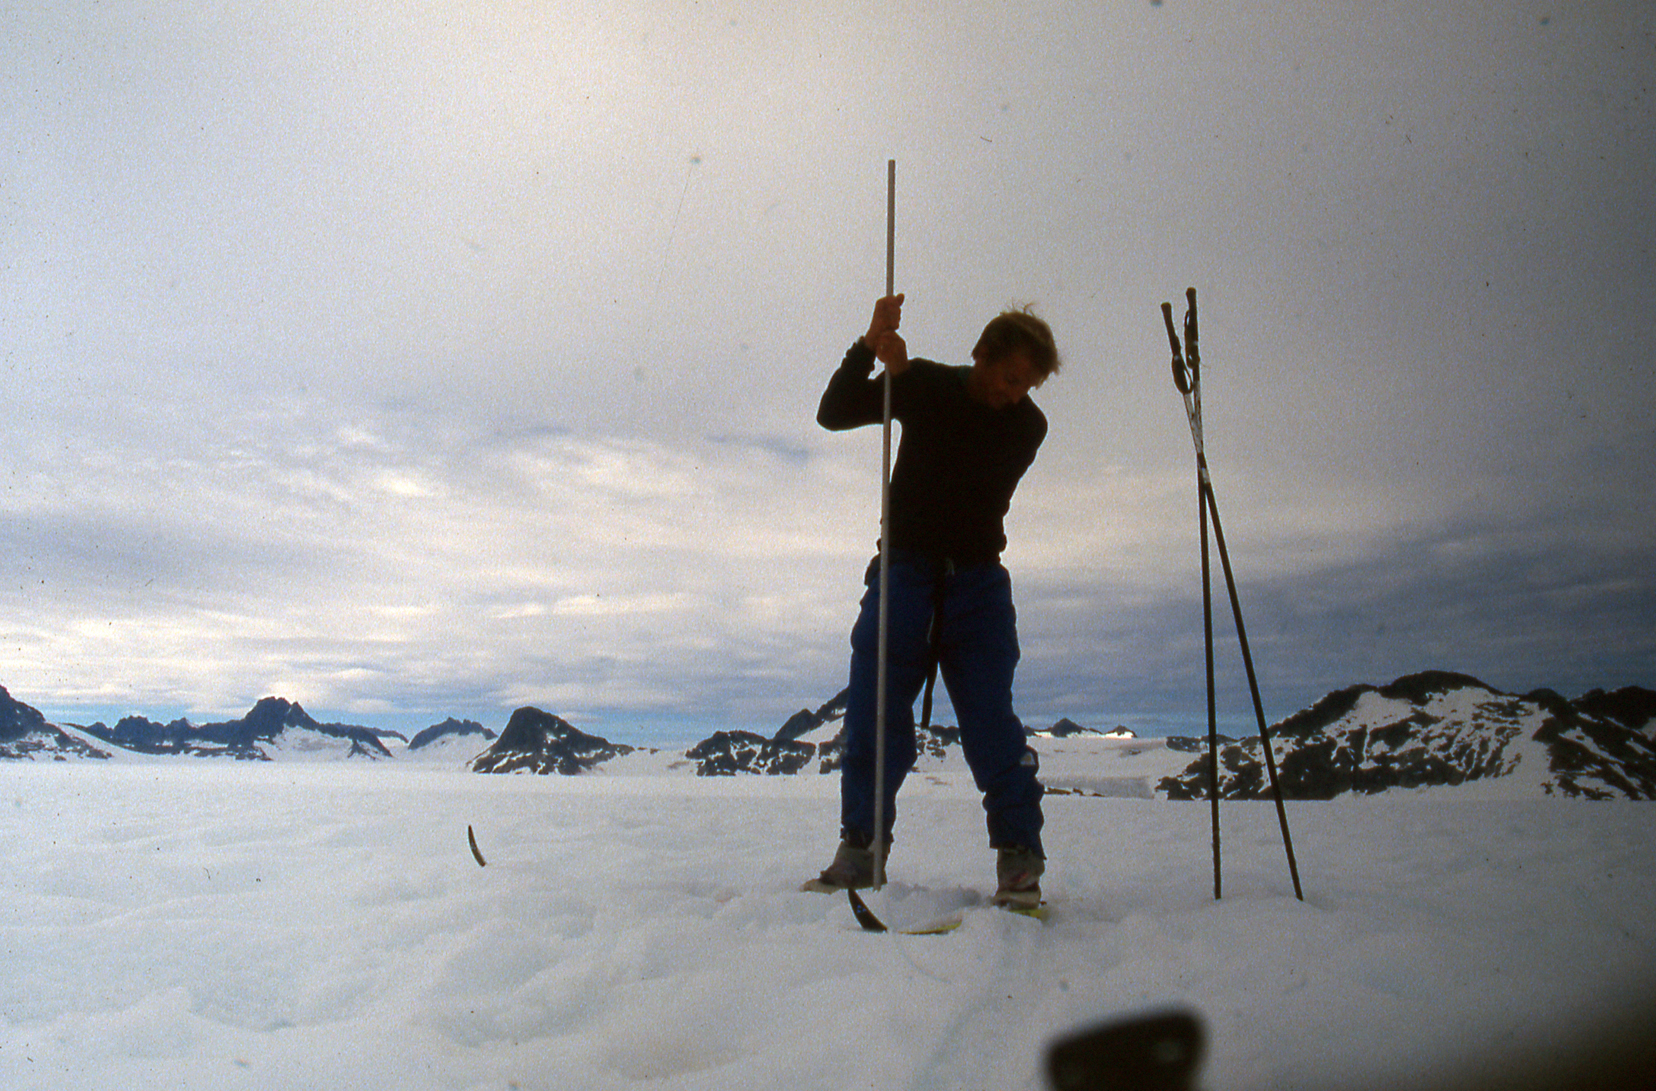
In the summer of 1998 we conducted extensive probing in the accumulation zone of the glacier, last two images in sequence below. This combined with annual identification of the snowline since 1994 indicates insufficient snowpack and continued thinning. This glacier has the majority of its area between 800 and 1200 m, with the average snowline since 1994 being 1000 m. Maximum accumulation is 1.5 m, whereas maximum ablation at the terminus exceeds 12 meters, hence you need a much larger accumulation zone to offset the higher terminus ablation. This glaciers retreat and lake expansion of the terminus follows the same pattern as all other glaciers of the Juneau Icefield except the Taku Glacier: Gilkey Glacier, Field Glacier, Eagle Glacier and Antler Glacier.
The Lower Curtis Glacier is an avalanche fed cirque glacier on Mount Shuksan in the North Cascades of Washington. It is a south facing and low elevation glacier for the range. This is an unusual combination that is supported by the heavy accumulation via avalanching from the upper slopes of Mount Shuksan. The glacier displays a magnificent set of annual layers in its terminus tongue. The terminus tongue is a spectacular wall of seracs that quickly rises 55 m above the bedrock. There are typically 50 layers visible indicating that this most of the ice in the glacier is 50 years of less in age. The glacier advanced from 1950-1985 and has retreated 155 meters from 1987-2009 in the glacier center and 135 meters on average across the front. A longitudinal profile up the middle of the glacier indicates that it thinned 30 meters from 1908-1984 and 15 m from 1984-2012. Because of its heavy accumulation via avalanching the glacier moves rapidly and is quite crevassed at the terminus. Each year we survey the terminus location, measure the mass balance and survey the glacier surface elevation on a cross profile. The video is from footage taken in 2011 and 2012. The annual terminus photographs are from near Lake Ann, the 2003-2012 sequence represents the digital camera era. This coming summer will be our 30 consecutive summer on the glacier and we will see if it is the seventh consecutive summer of wet weather when we are there.