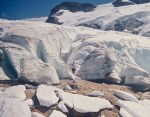
The Tons River is in Uttarakhand India. The watershed is fed by more than 50 glaciers. The largest are Jaundhar Barak and Bandarpunch, the glaciers of Tons valley are notable for a thick mantle of debris cover, due to the terrain characteristics, and the avalanche fed nature of the glaciers (Pankaj et al, 2012). The Tons River Basin has one significant operational hydropower unit, the Mori Hanol Hydro Power Project (70 MW) with a diversion dam downstream of Mori village. There are other proposed projects in the basin. Mehta et al (2013) observed the spatial changes of Jaundhar Barak, Jhajju and Tilku glaciers in the Tons River basin between 1962 and 2010 using Landsat Satellite data, topographic maps and field surveys. They estimated the overall loss in area to be 3.6 km2 (5.4%) and frontal retreat of 1,700 m, ∼ 800 m and ∼ 700 m for the Jaundhar Barak, Tilku and Jhajju Glaciers. The debris cover (DC) makes it quite difficult to easily identify terminus (T) position using Landsat imagery, Google Earth Imagery is not good either.

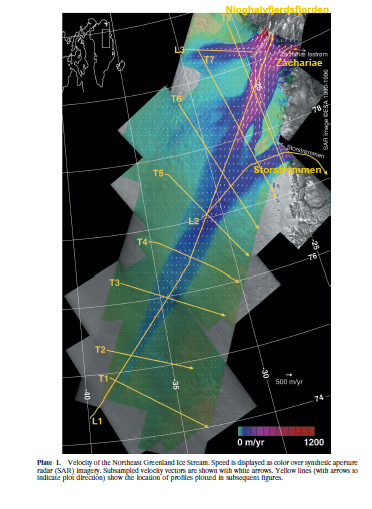
Map of Tons River basin glacier from (Pankaj et al, 2012)

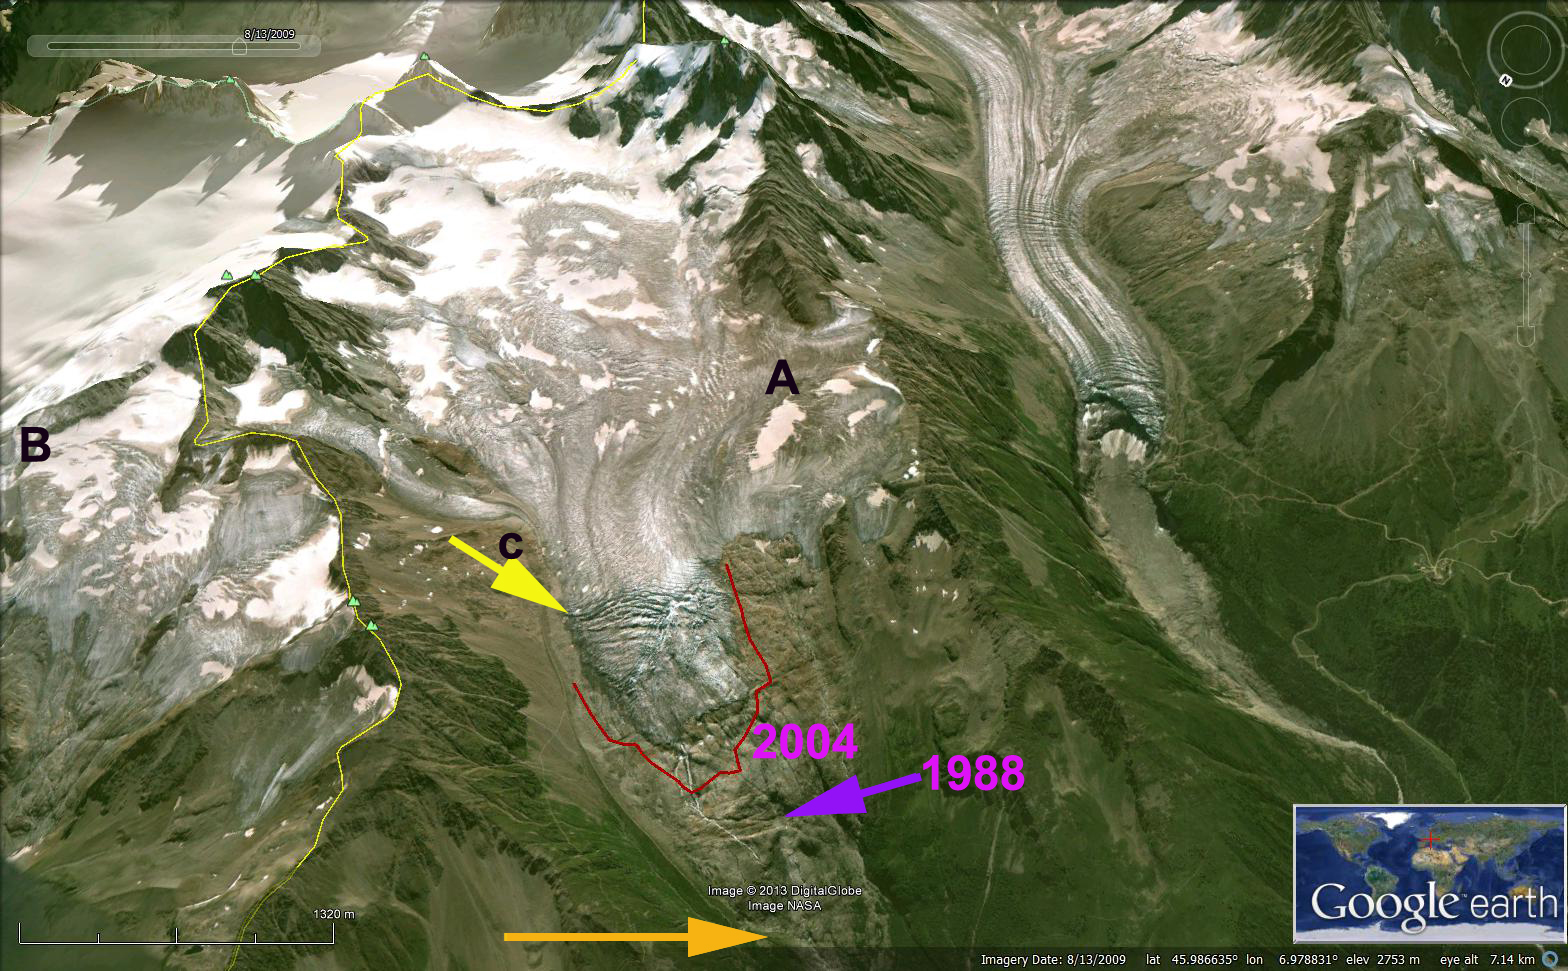
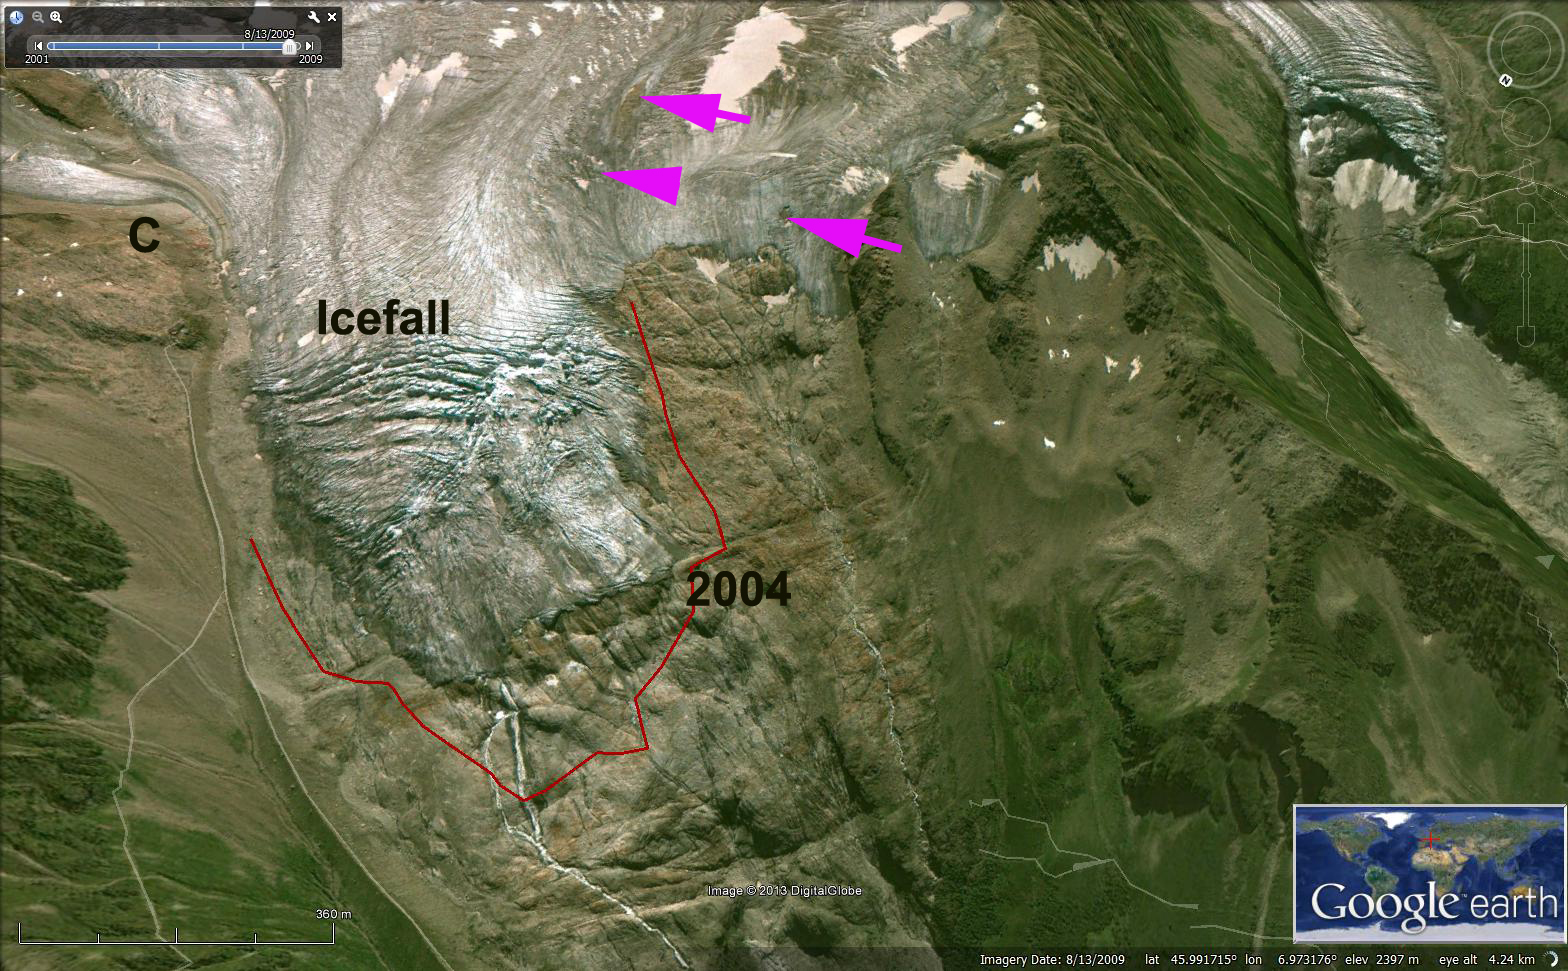
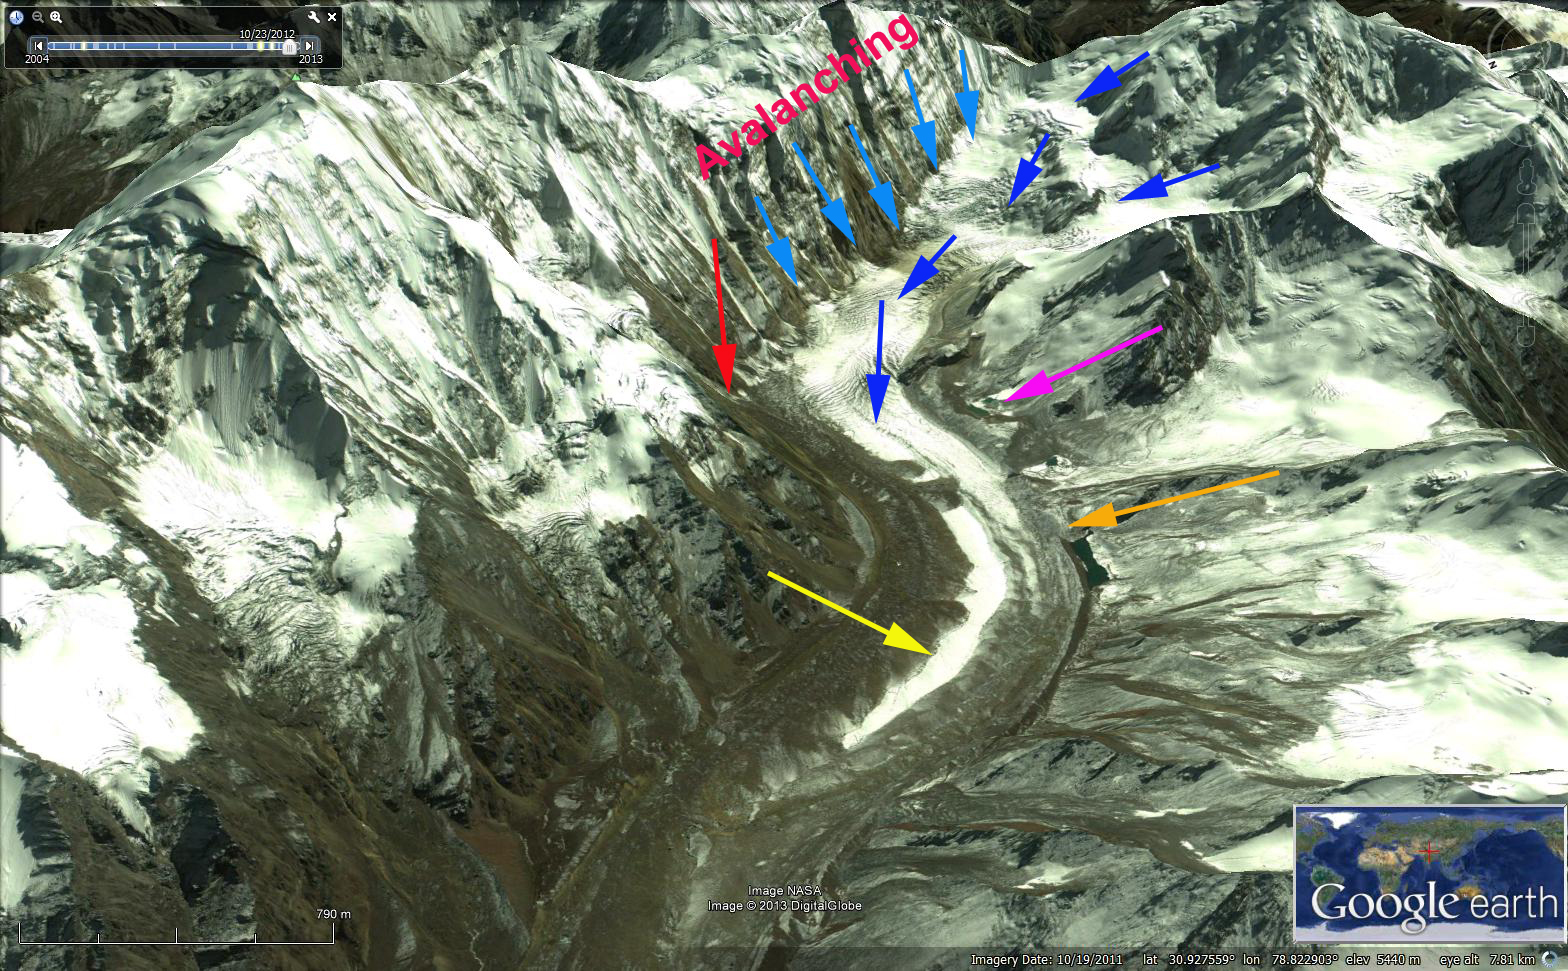
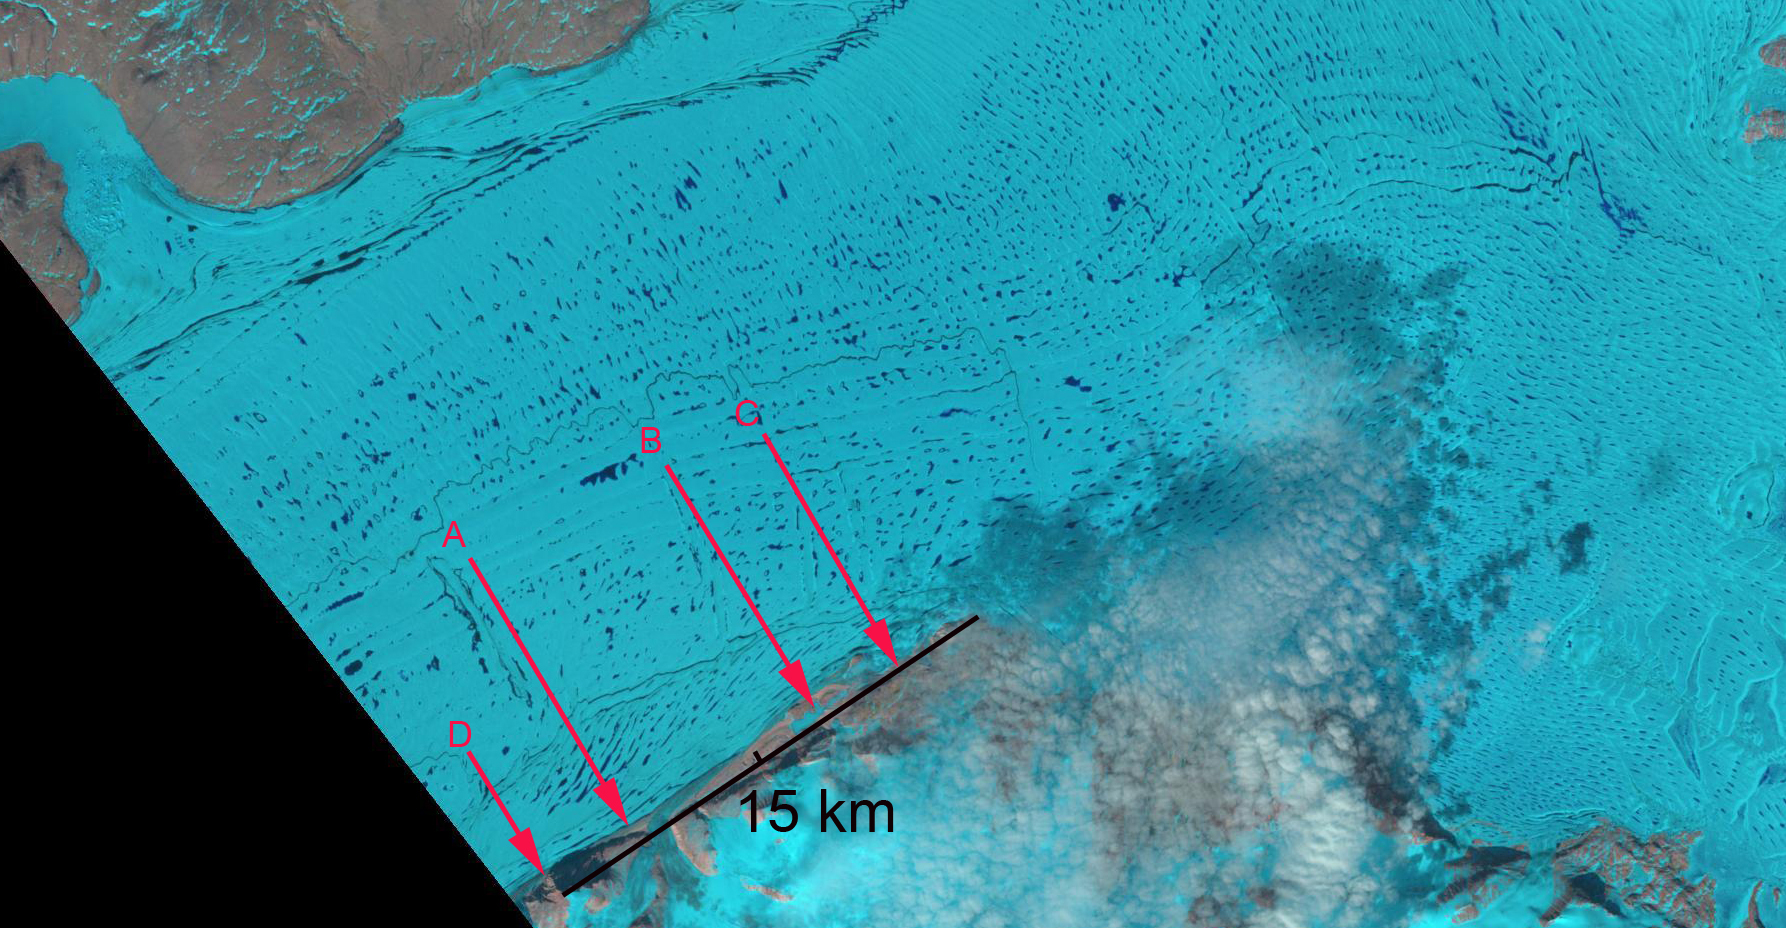
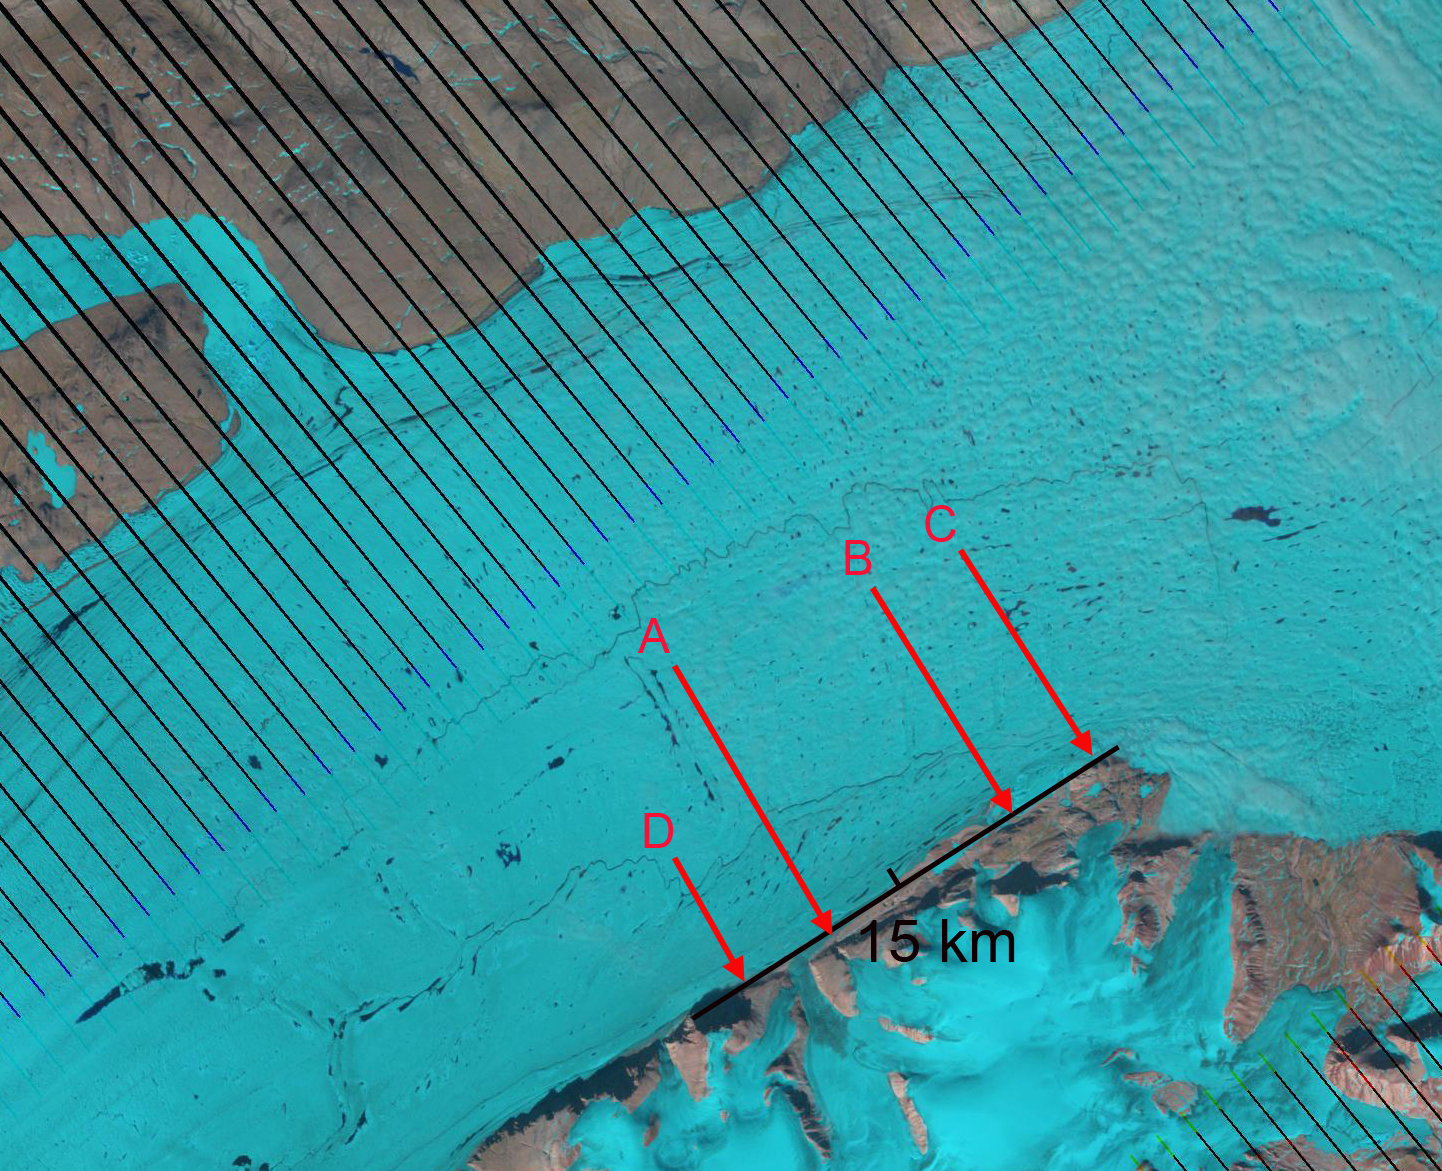
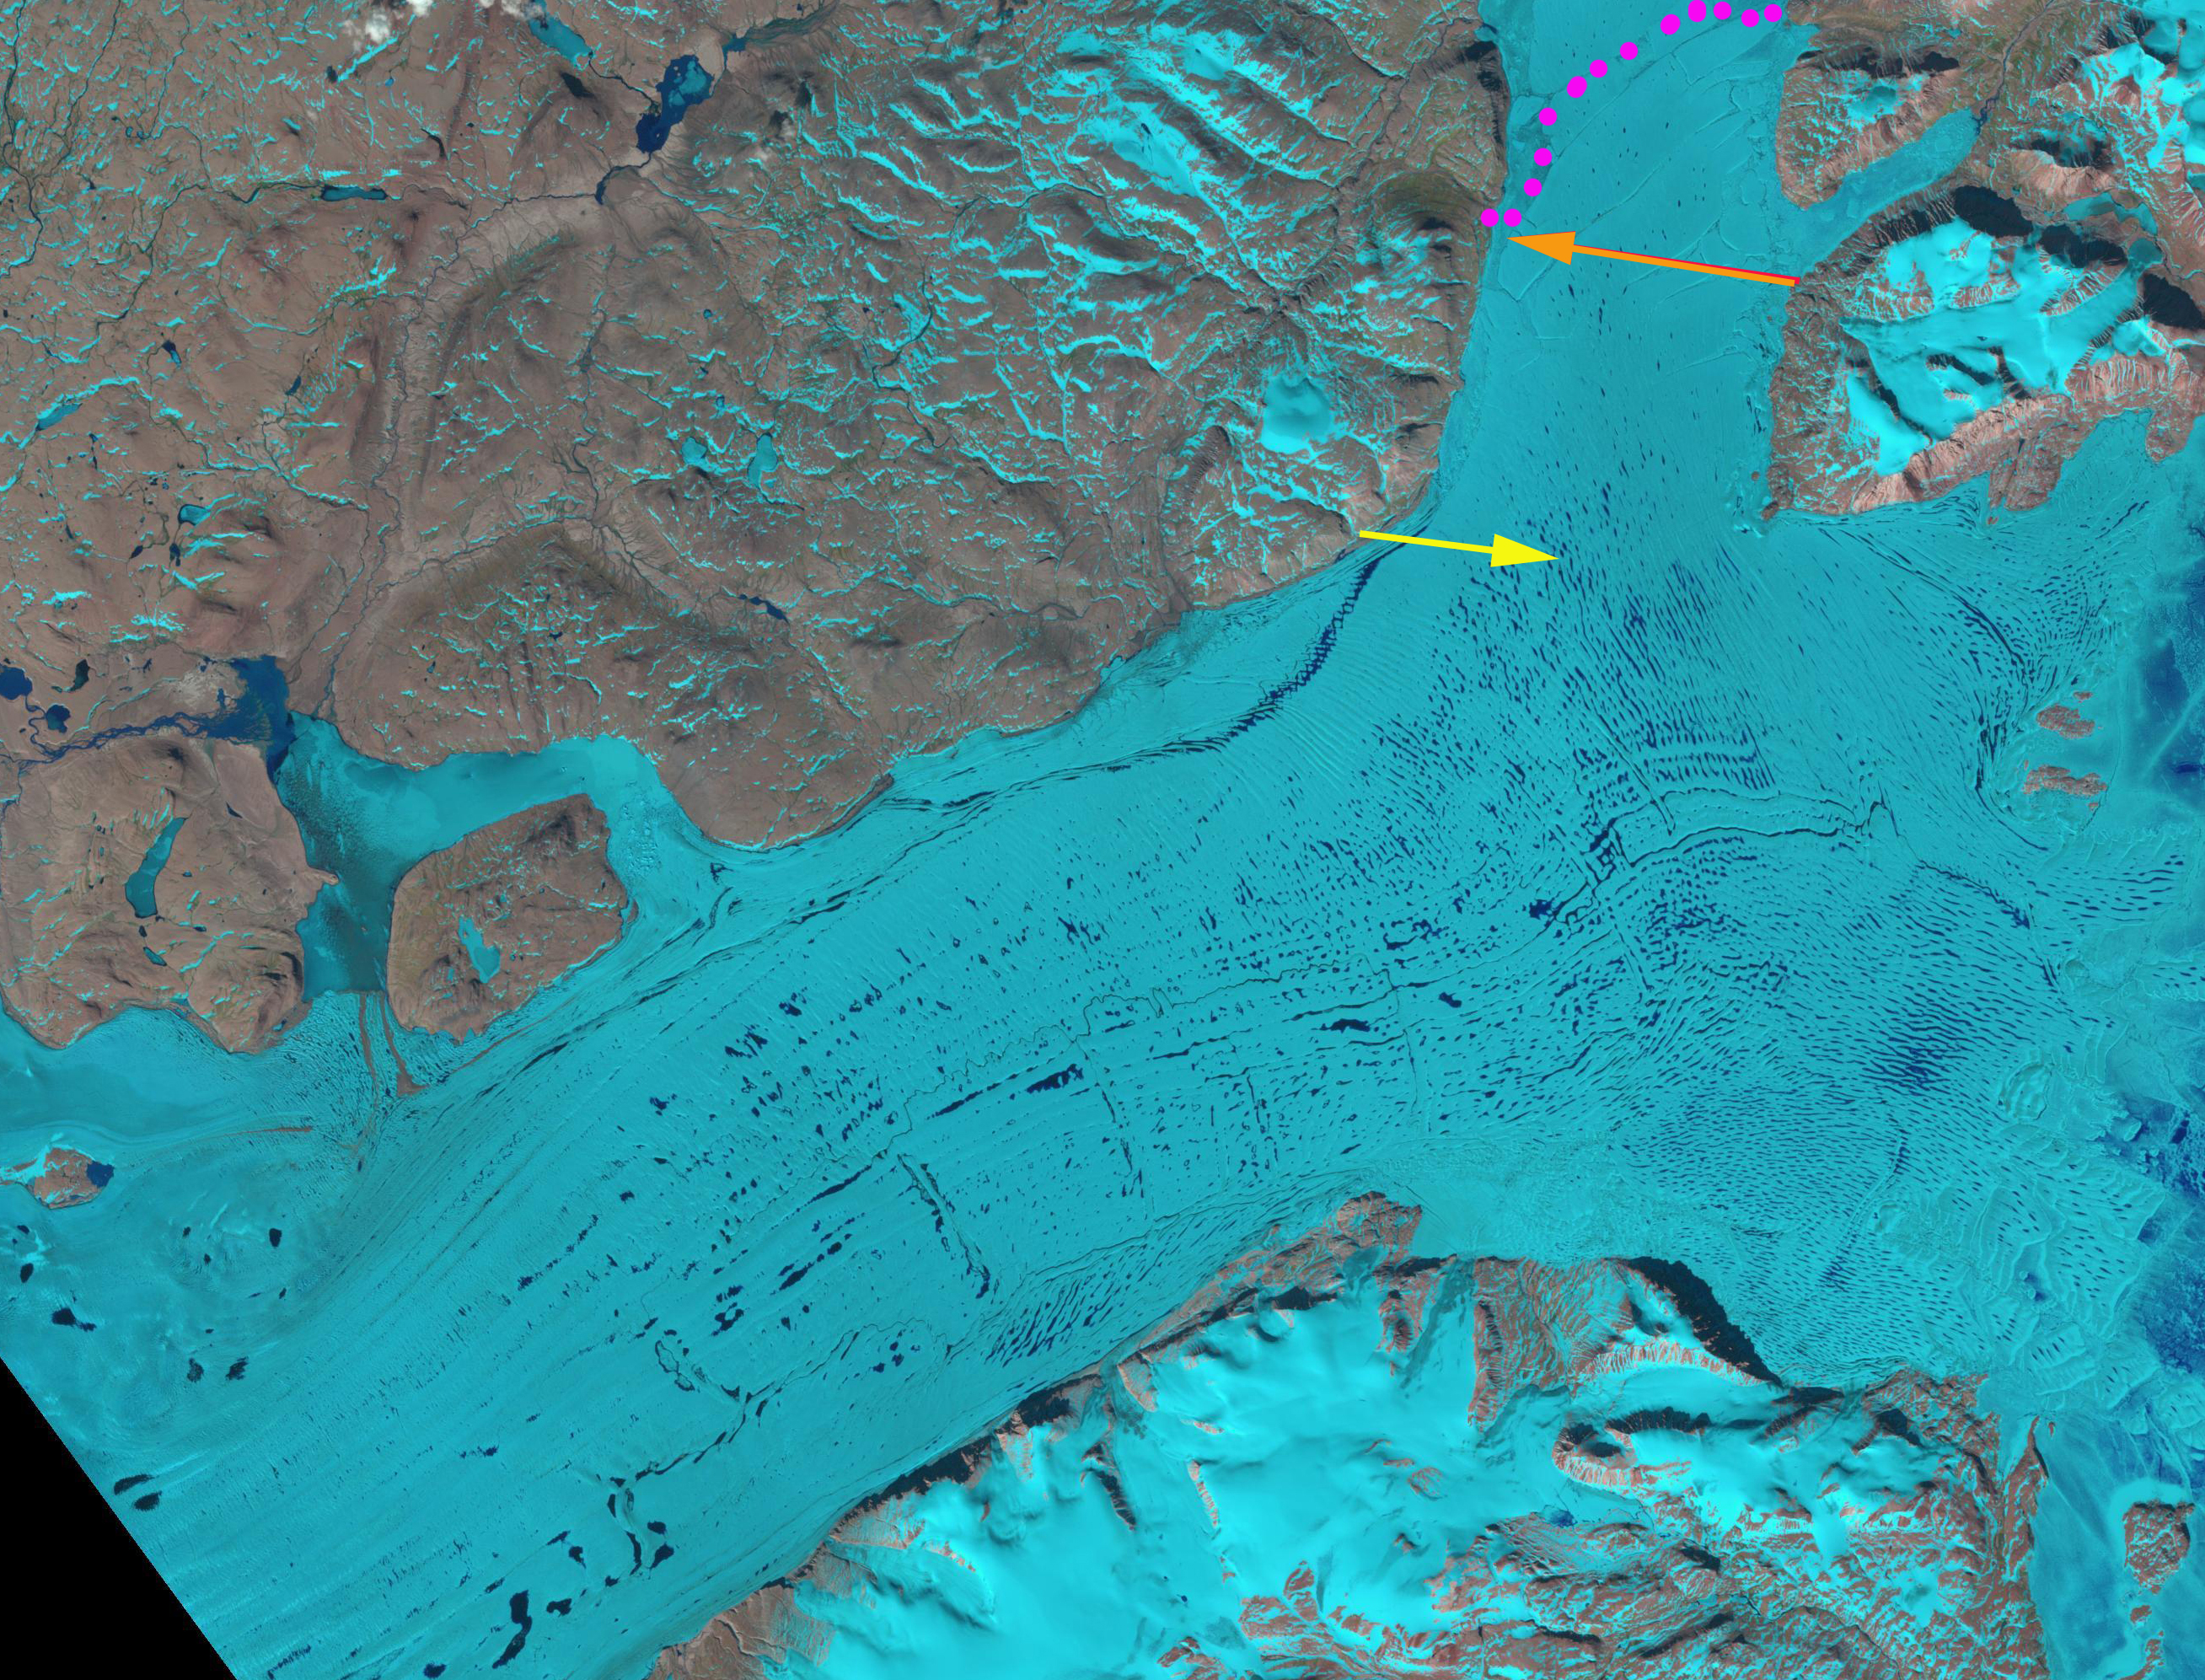
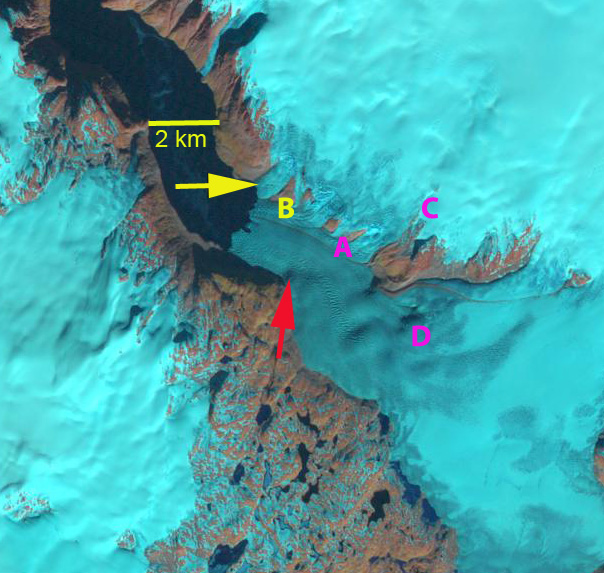
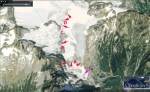
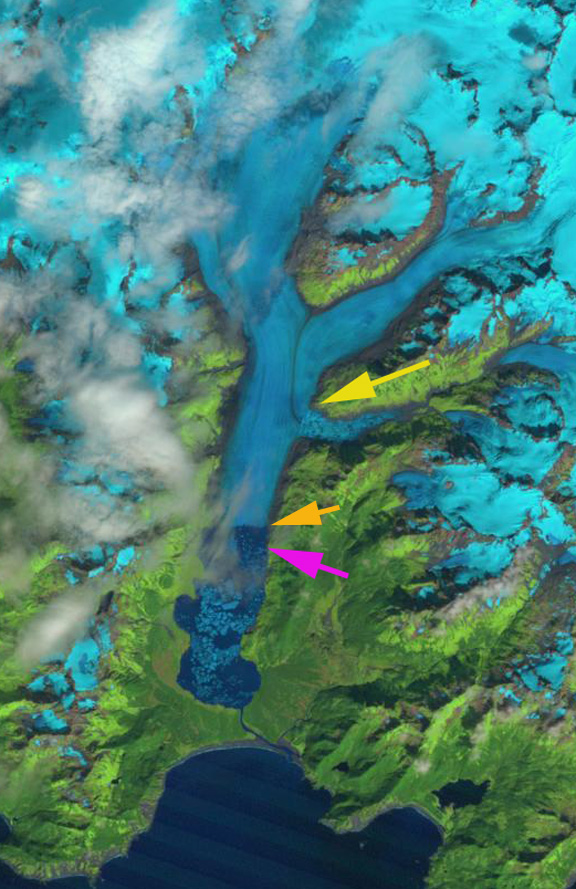
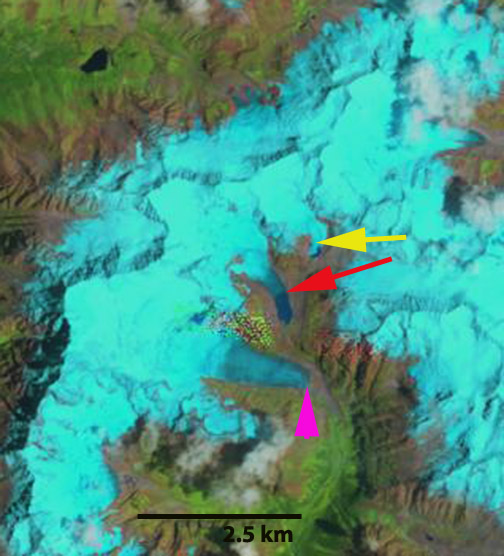
Jaundhar Barak Glacier in 2012 arrows indicate flow Debris cover=DC and Terminus=T, tributary glaciers of note discussed below A-E.
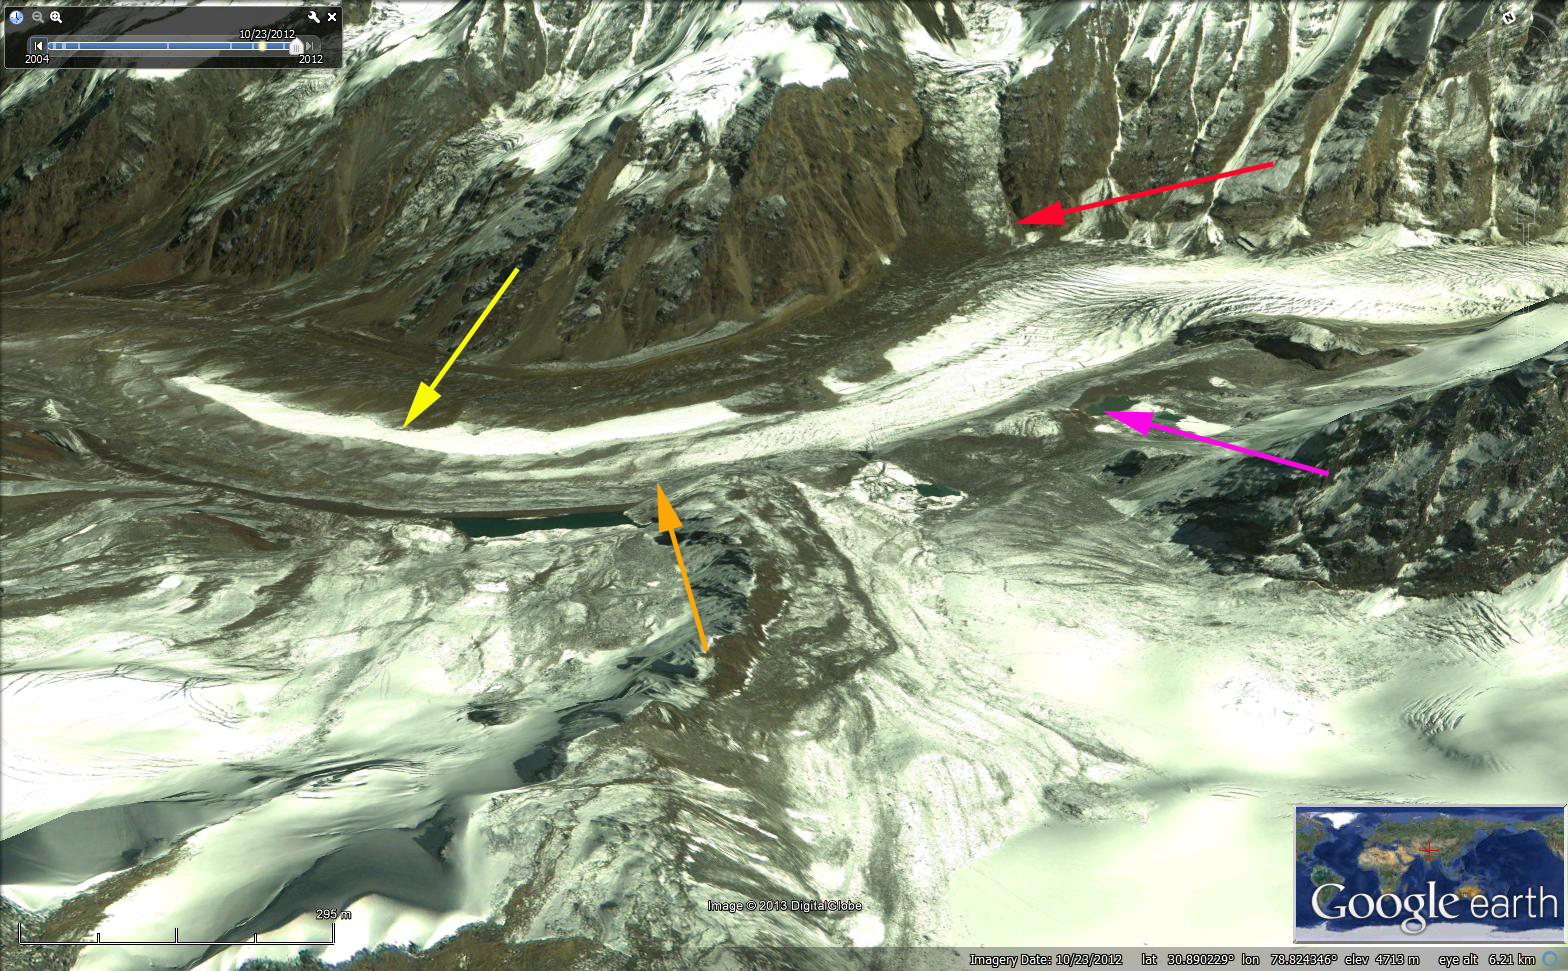
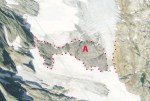
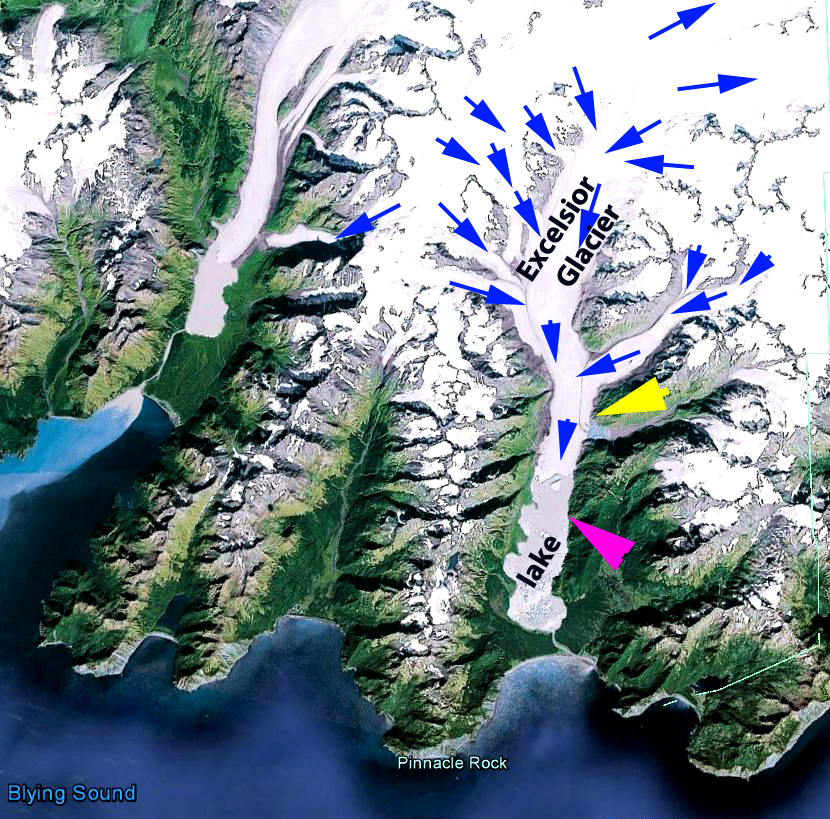
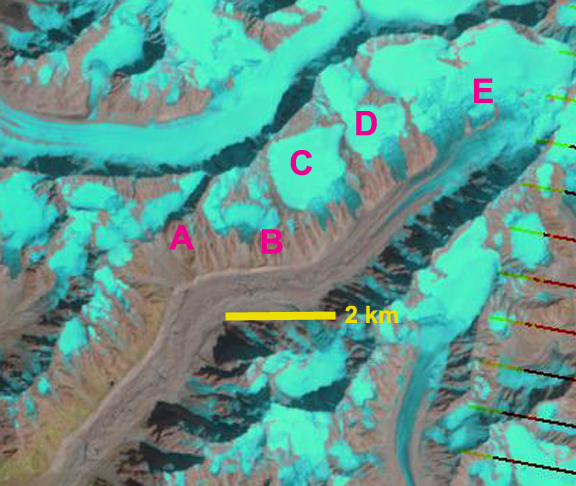
Here we use Landsat imagery to identify the retreat of five tributary glaciers that have fed or are feeding into the Jaundhar Barak from the ridge to its north from 2000 to 2012. Jaunhar Barak is a 19 km long glacier with a north and south arm, here we focus on the north arm. The glacier begins near 6000 m and quickly drains into the main valley, at 4900 m the debris cover begins and the lower 13 km of the glacier are debris covered to the glacier end at 3900 m . The tributary glaciers are each a potential income stream for the main glacier, which when lost lead to less snow and ice “income” for the main glacier and then thinning and retreat will follow. The Jaundhar Barak Glacier is The five tributaries are labelled A-E. A comparison of the 2000, 2011 and 2012 images below indicate that: At Point A in 2000 two arms of the tributary glacier joined and it flowed out of the high alpine basin it was in, by 2011 and 2012 the two glacier arms have separated and the glacier is confined to the upper basin. At Point B there is a well established glacier tongue that extends halfway from the tributary to Jaundhar Barak, and by 2012 this tributary terminus has pulled back 200 m, which is nearly 200 m of elevation change also. At Point C in 2000 this tributary joins the main valley glacier and a small tongue of blue ice, its contribution can be seen heading downglacier. By 2012 the Point C tributary no longer reaches the main glacier. At Point D in 2000 the tributary joins the main glacier and like the previous tributary contributes a small tongue of blue ice that heads down the Jaunhar Barak Glacier. By 2011 the Point D tributary is no longer reaching the main glacier. At Point E in 2000 this accumulation area for the glacier is nearly all covered with glacier ice, with only a couple of small bedrock areas seen below the Point. By 2012 the bedrock exposed has coalesced into a one kilometer region separating a portion of the upper glacier from the main valley glacier. The ice from this tongue still may reach the lower glacier via avalanching. The last decade of loss on tributary glaciers more than 10 kilometers above the terminus of Jaundhar Barak indicates that downwasting and retreat of this glacier will continue. This glacier follows the pattern of other glaciers in the Garhwal of the Himalaya in its retreat and downwasting, Jaonli Glaicer, Gangotri Glacier, Satopanth Glacier . It also will feeds hydropower projects as do the other glaciers.

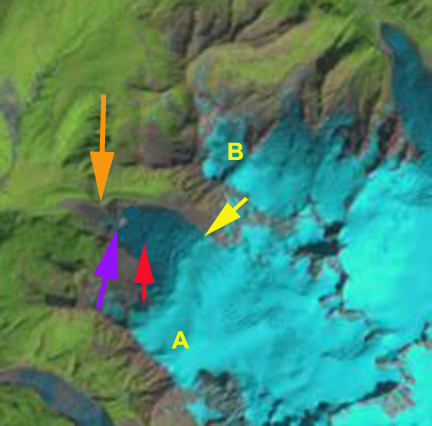
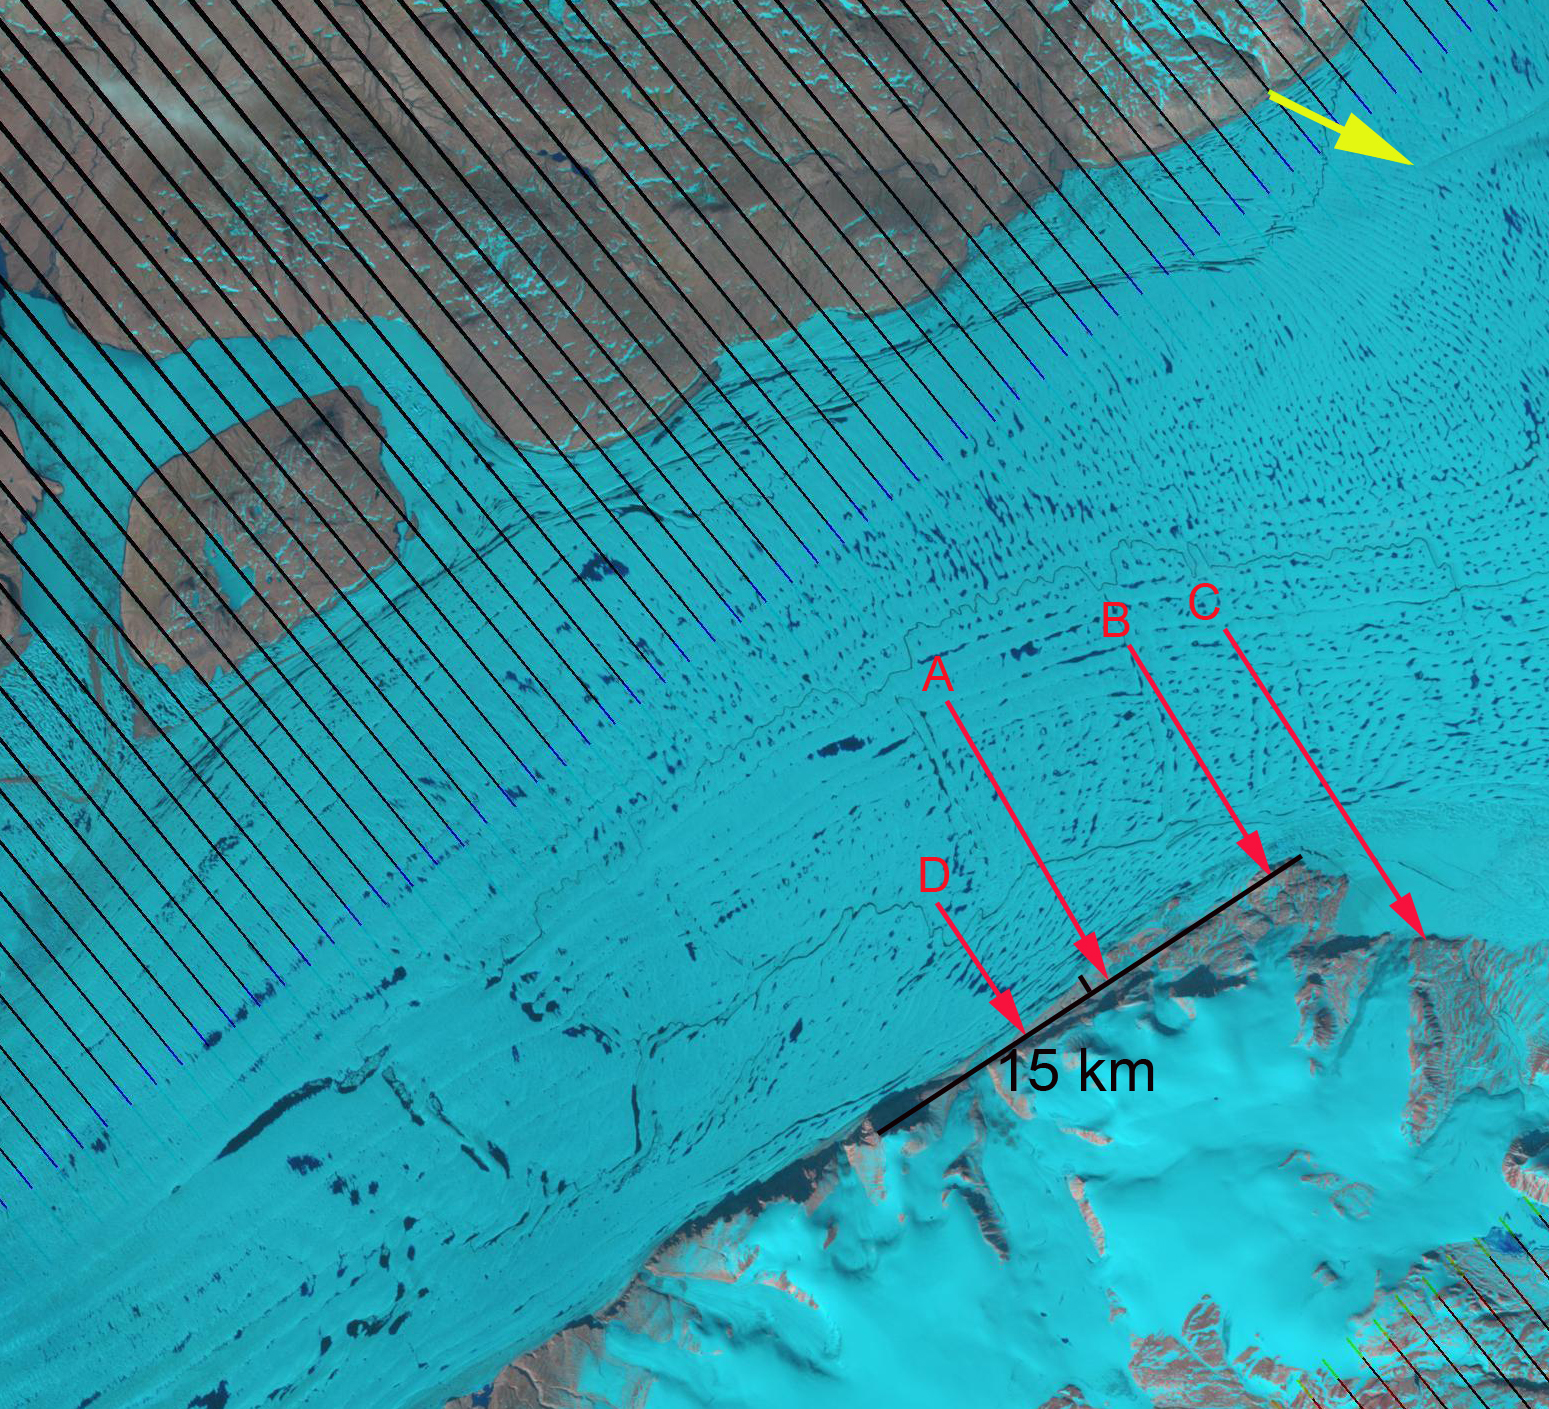
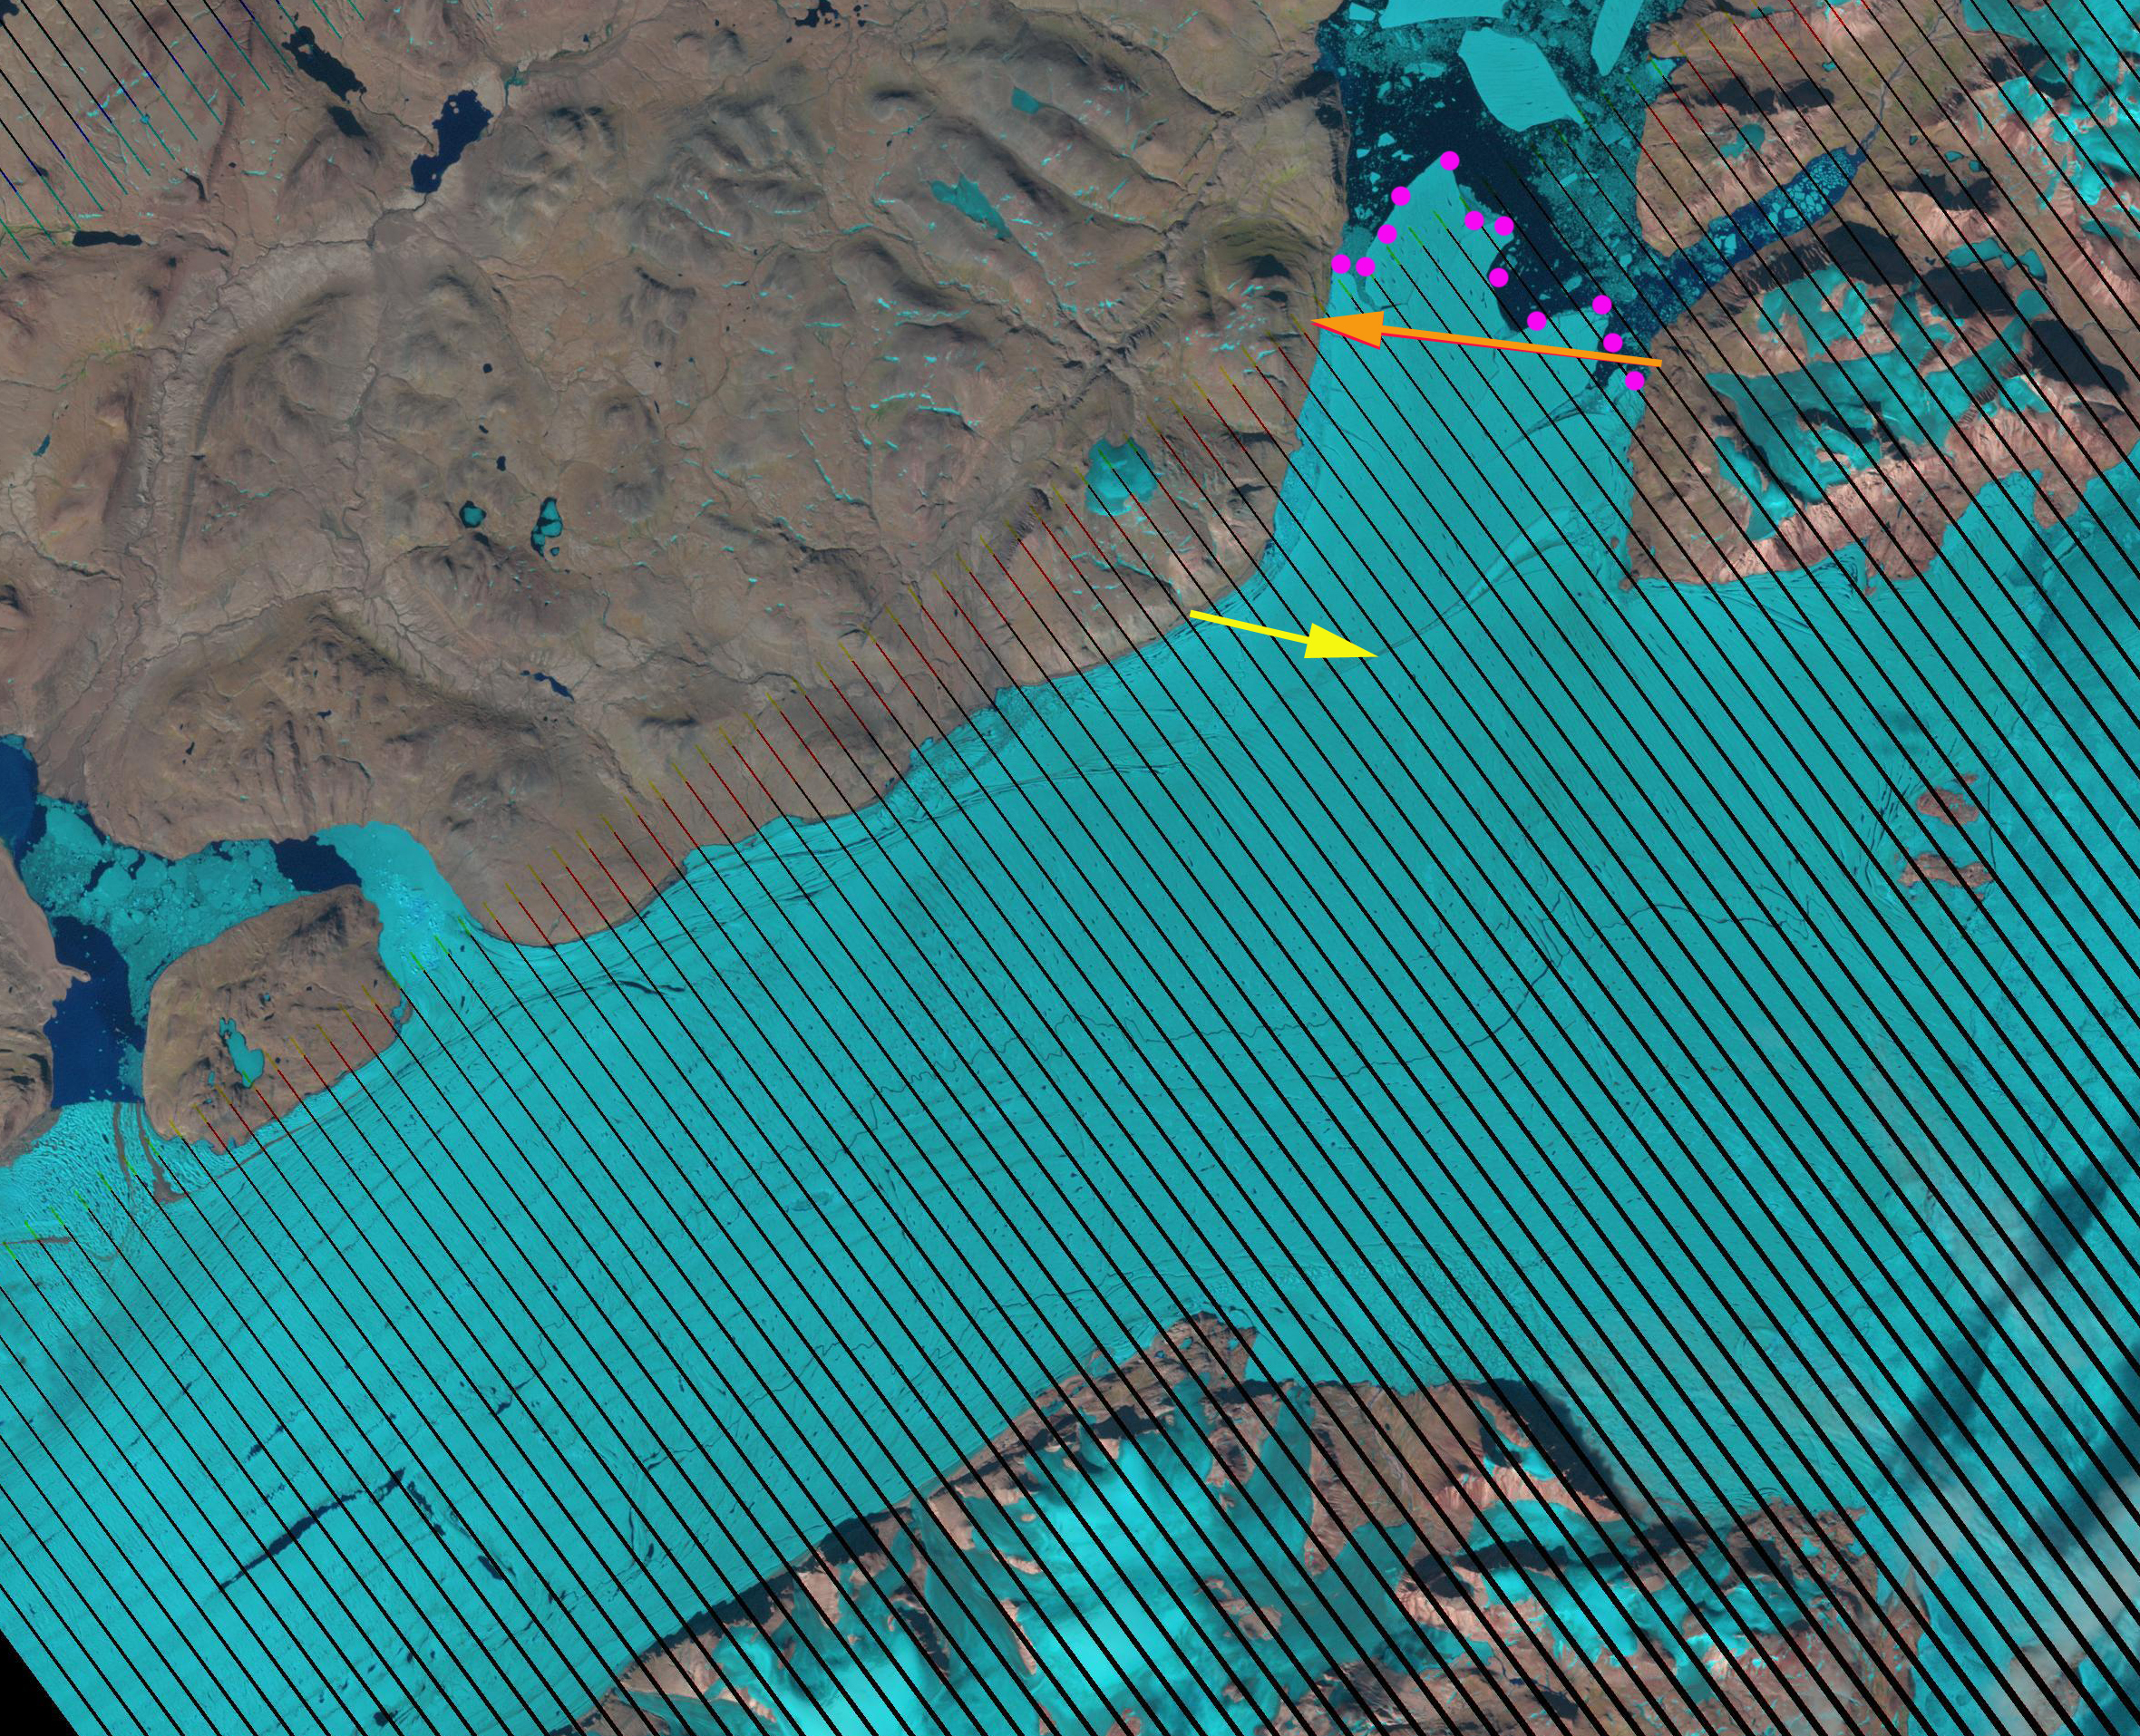
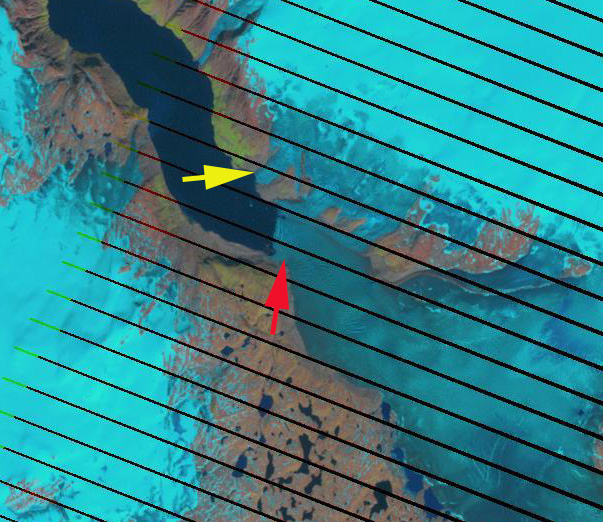
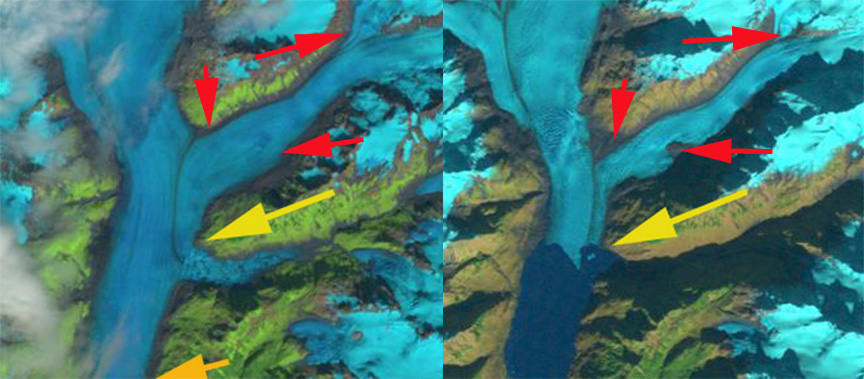
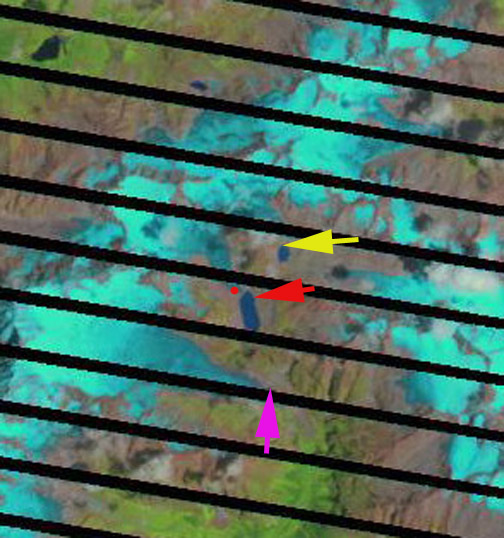
2000 Landsat Image of tributaries on north side of Jaundhar Barak Glacier.
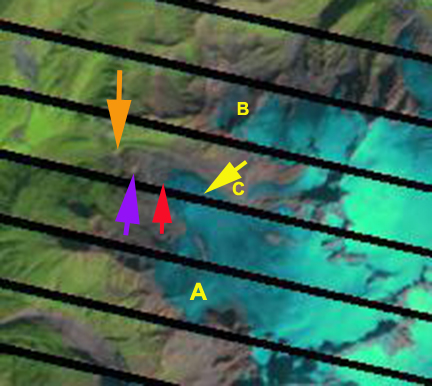
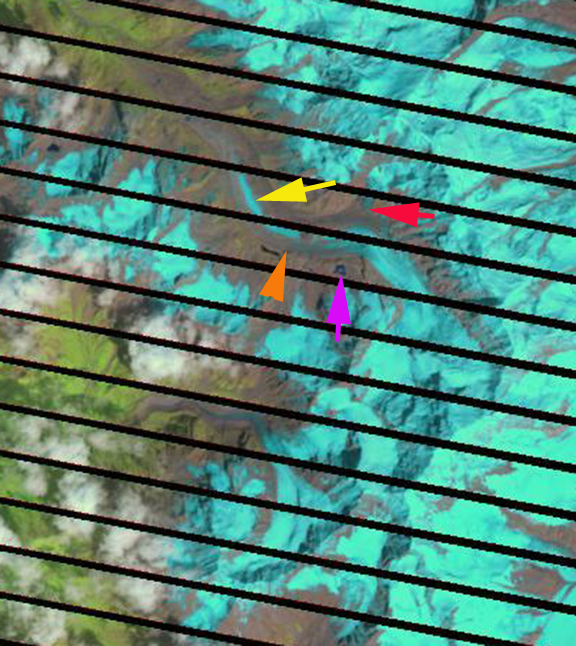
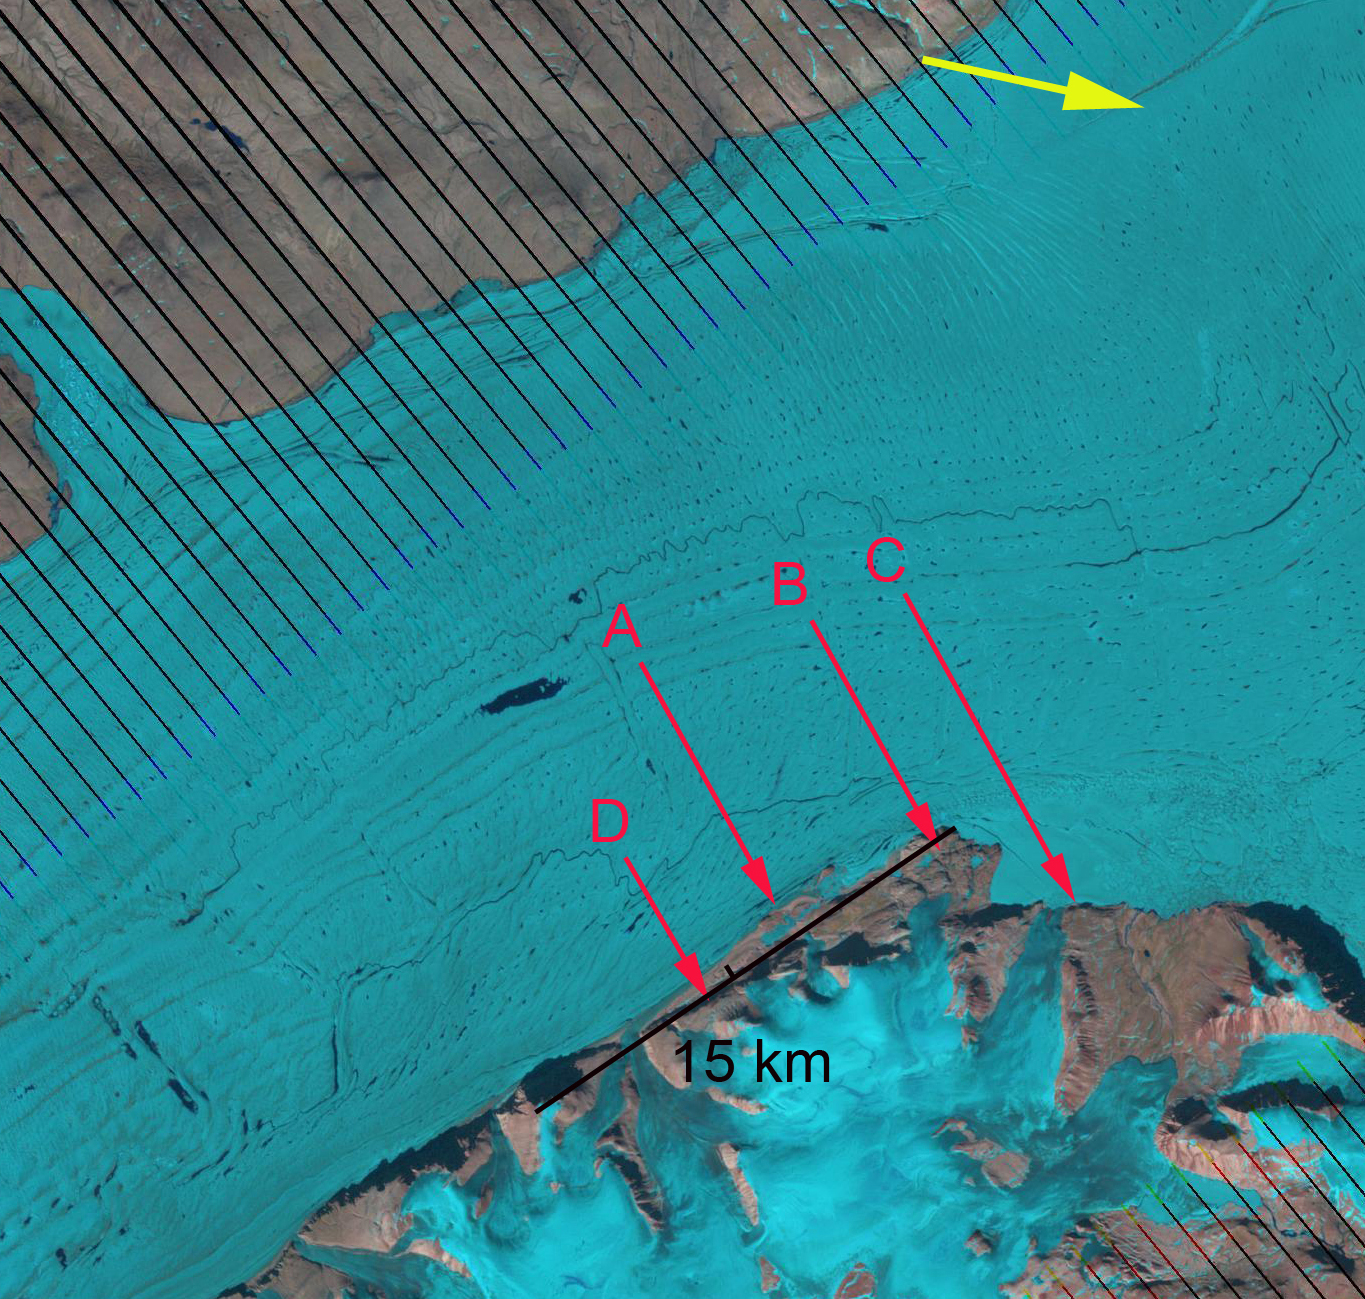
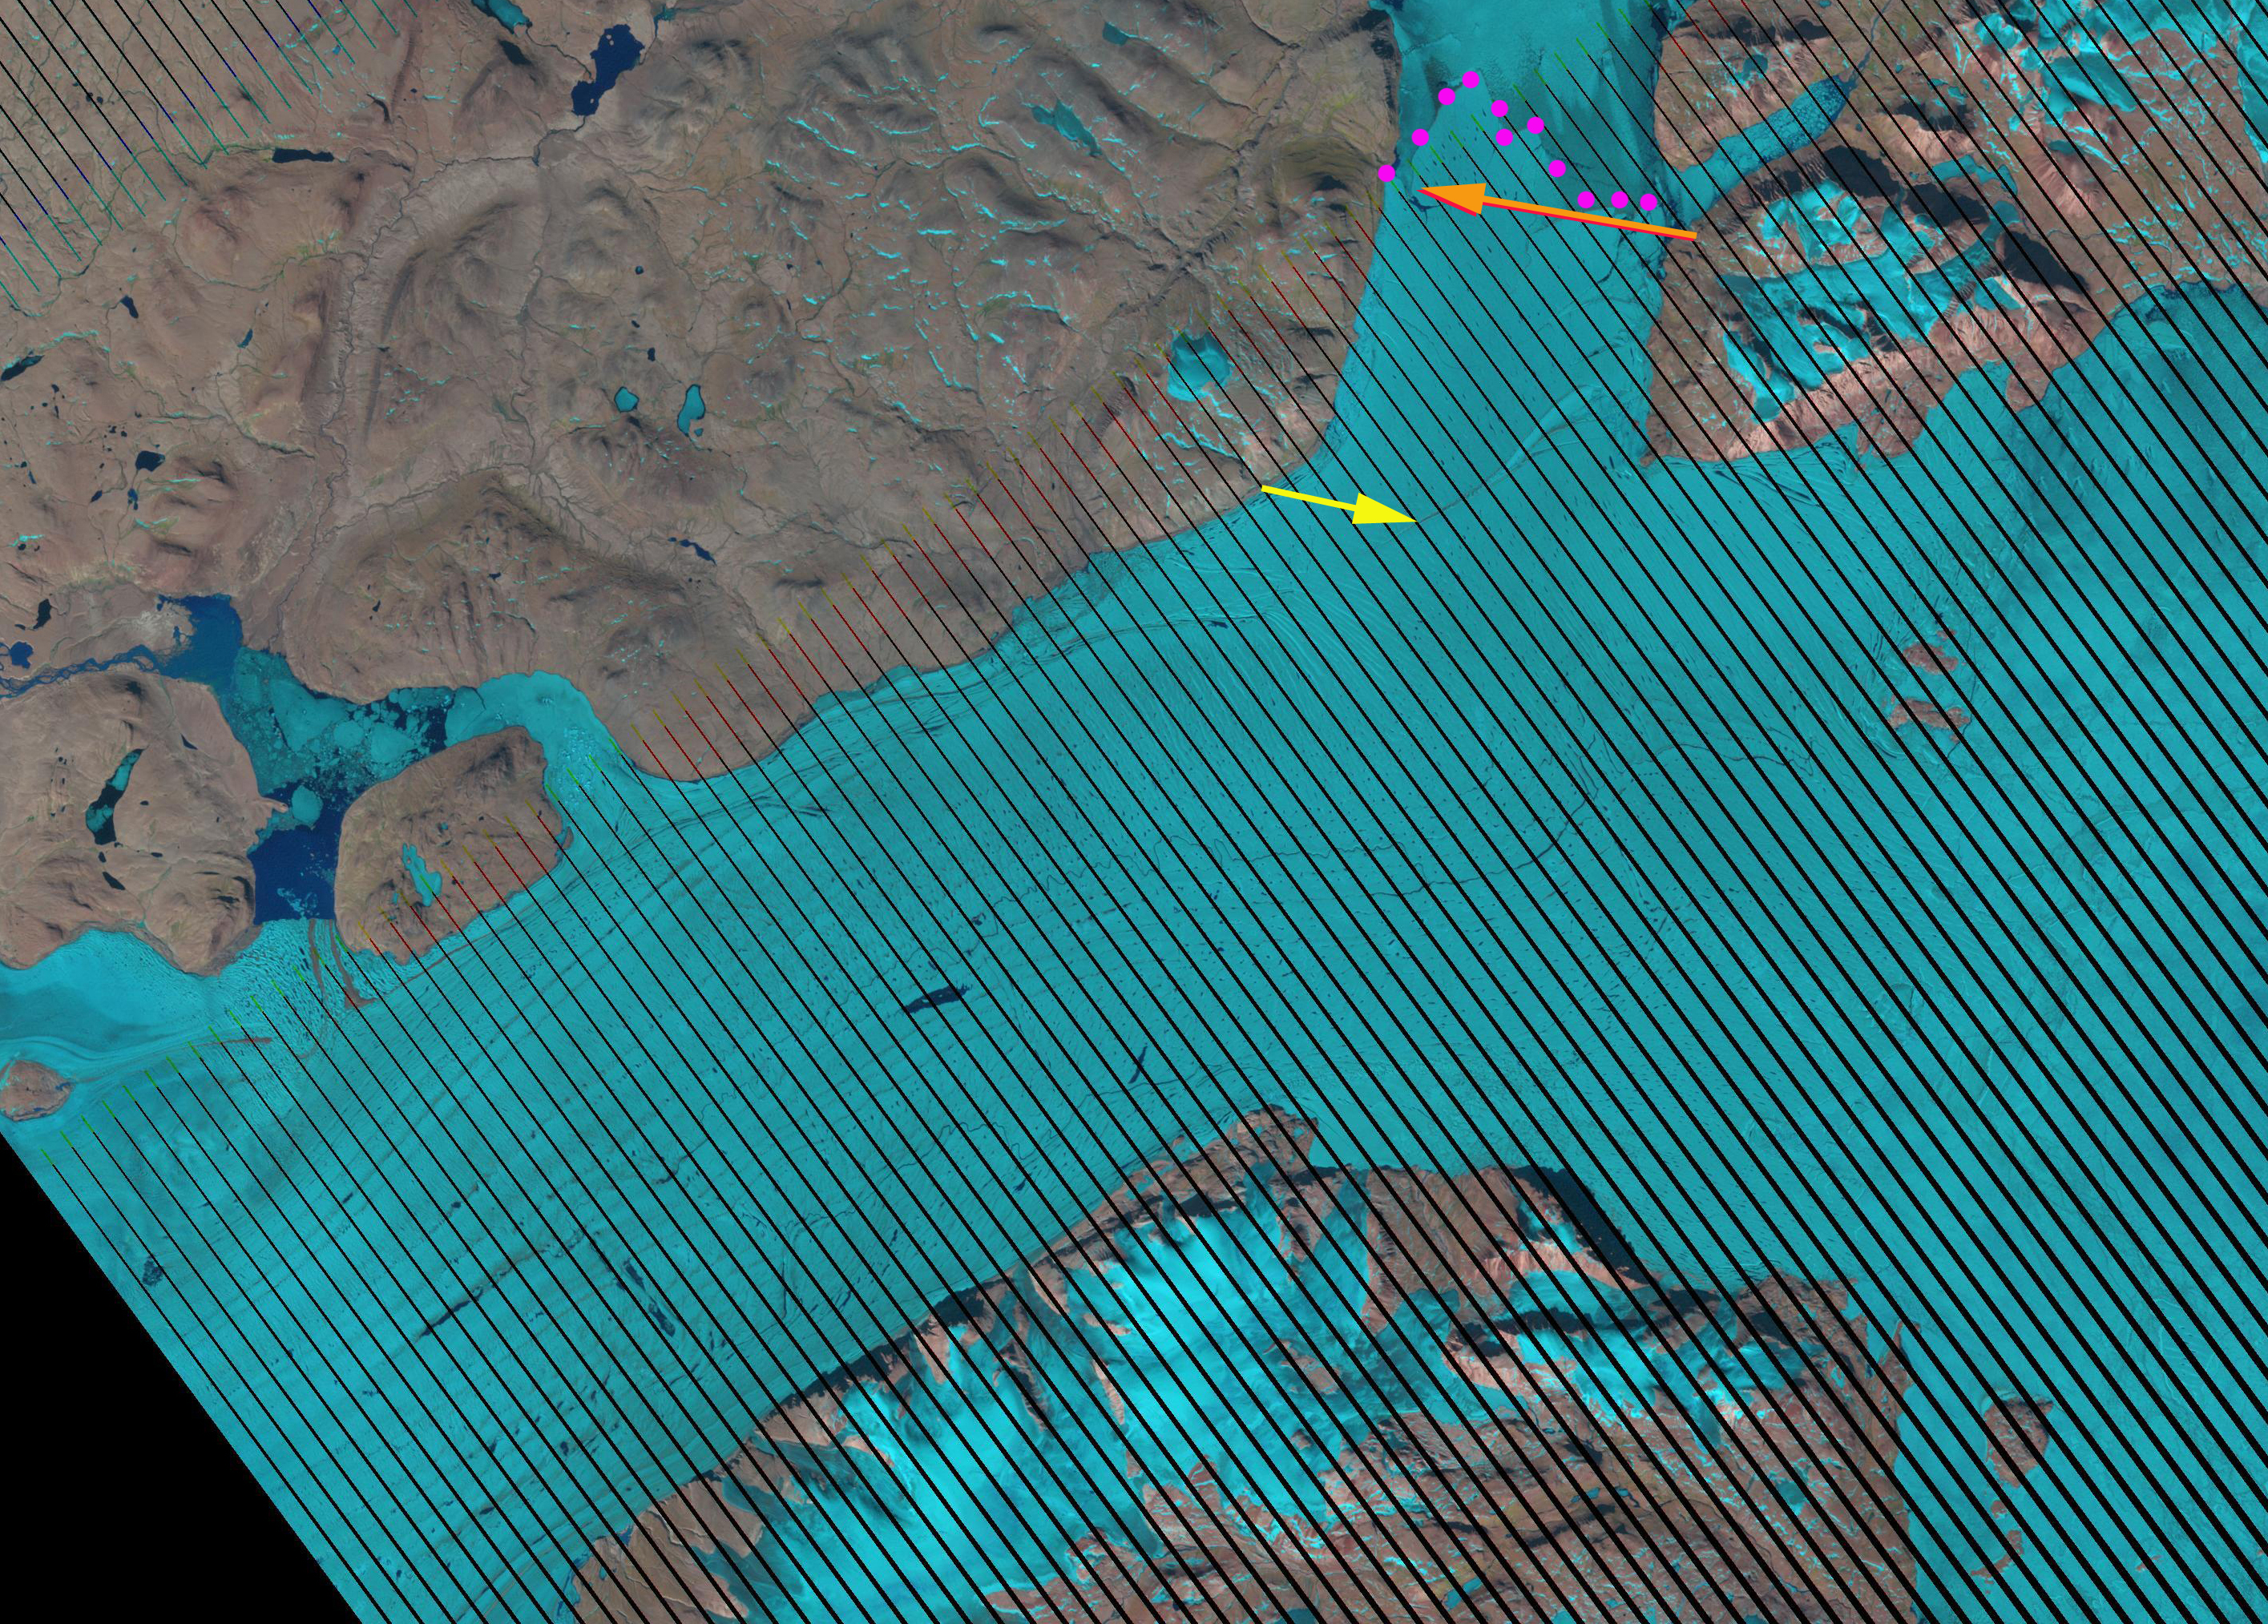
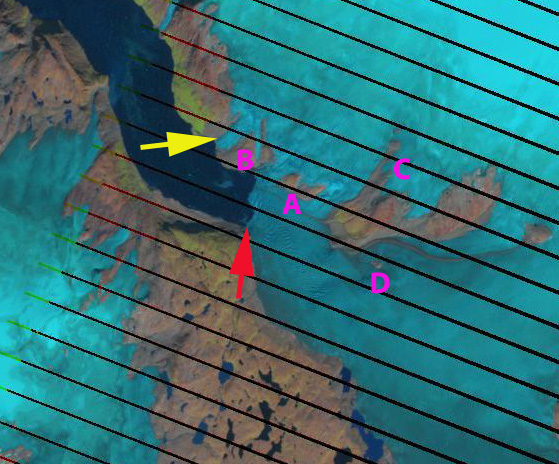
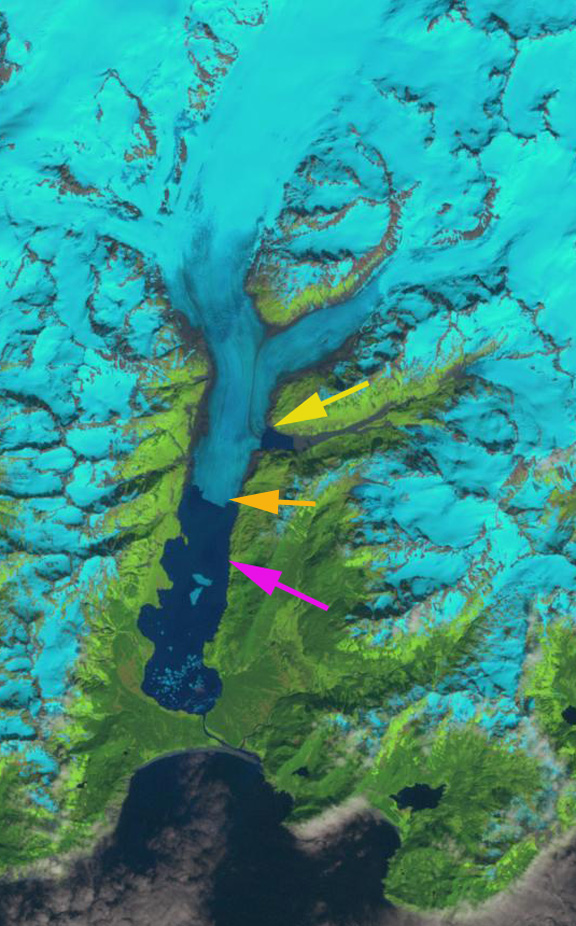
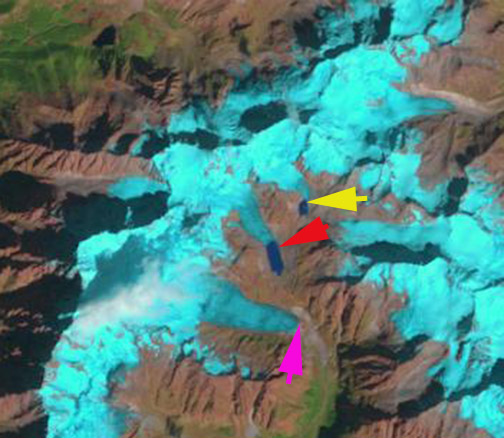
2011 Landsat image

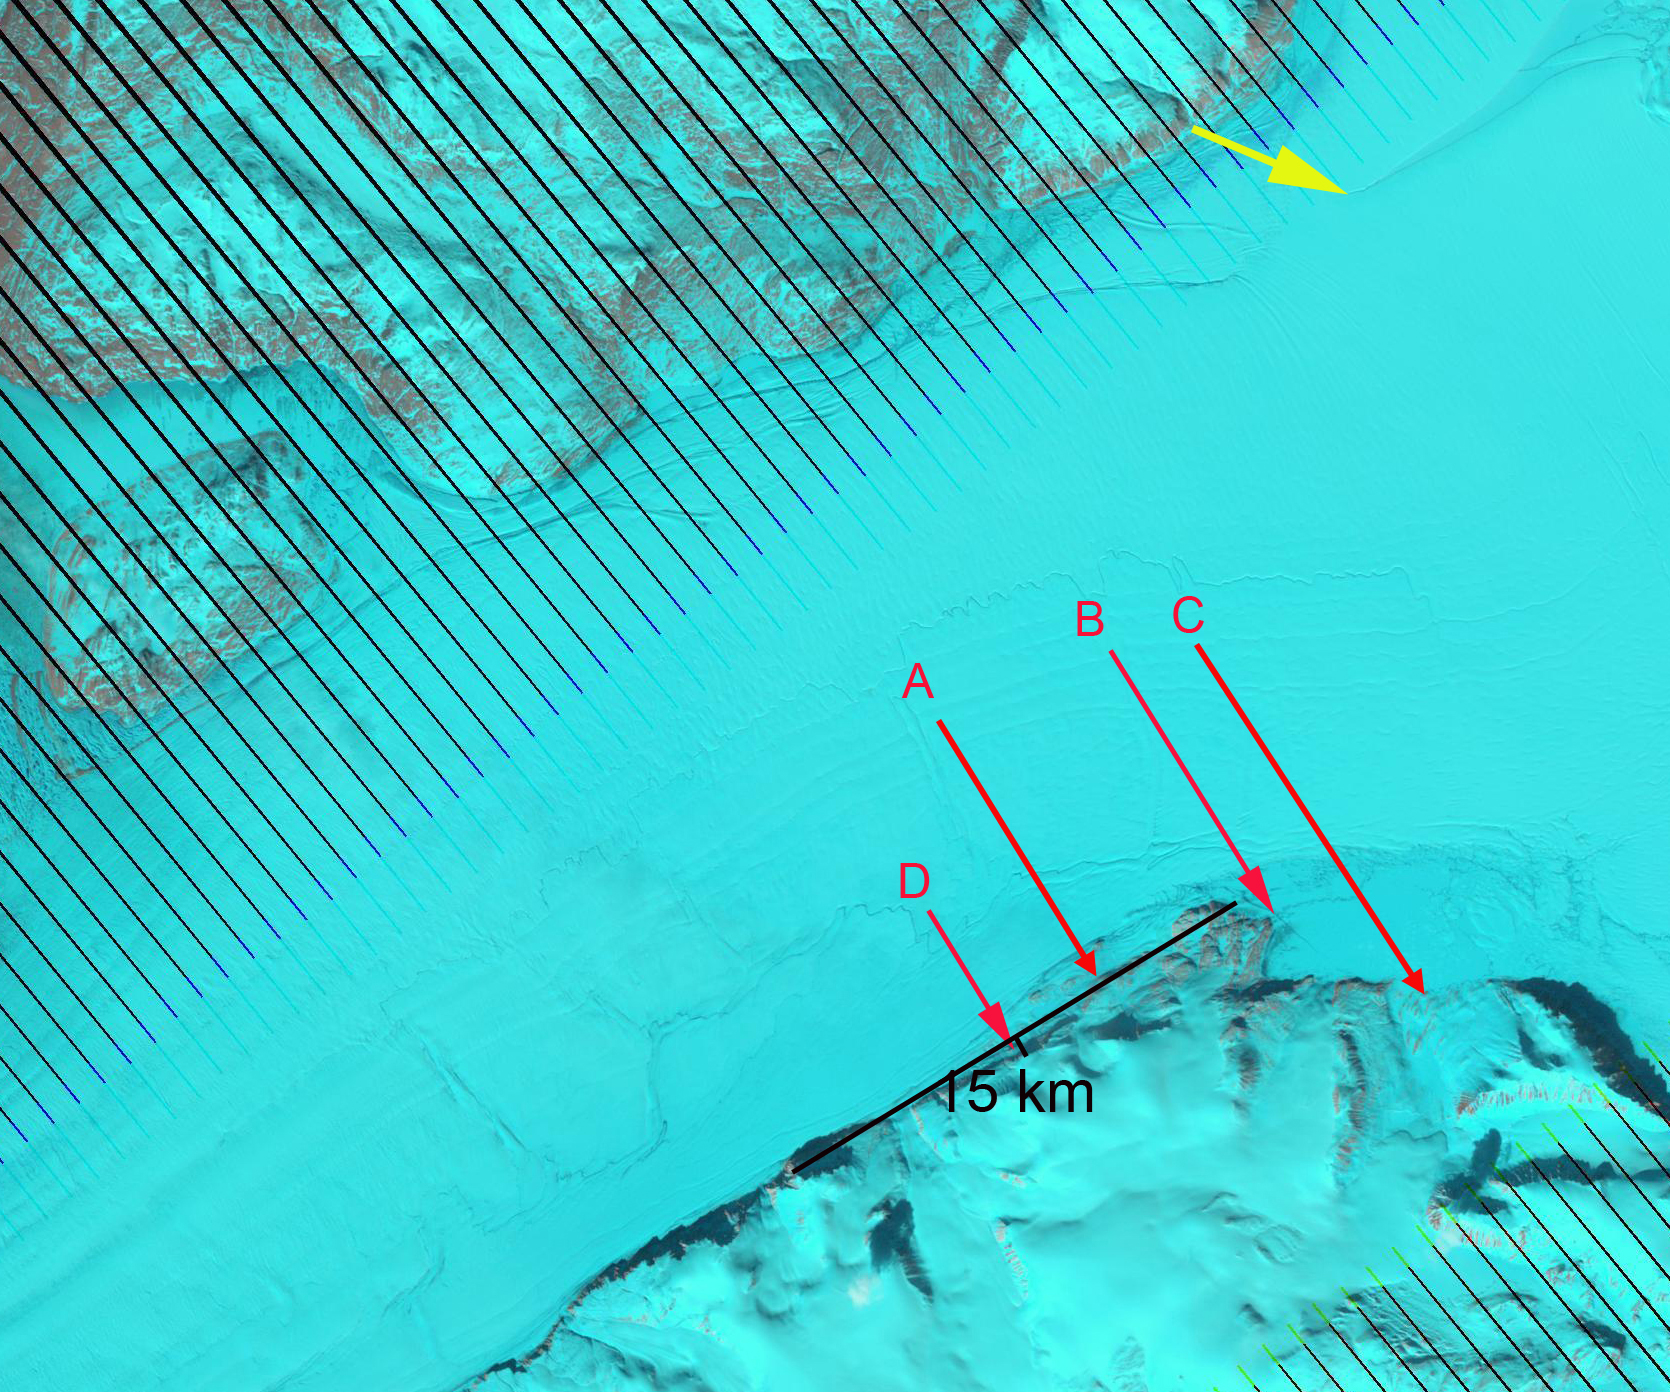
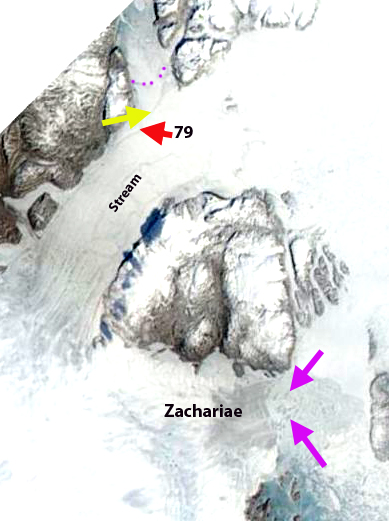
2012 Landsat image