Hochalm Glacier is Austrian Alps. The glacier drains into the Malta River, which hosts a 40 MW run of river hydropower plant. Fischer et al (2014) note that the Ankogel-Hochalmspitzegruppe glacier area has declined from a Little Ice Age extent of 39.7 square kilometers, 19.2 square kilometers in 1969 to 16.0 square kilometers in 1998 and 12.1 square kilometers in 2012. They note the disintegration and separation of many glaciers in the region. The World Glacier Monitoring Service reported the terminus retreat of 80 m for Hochalm Glacier from 2001-2010.
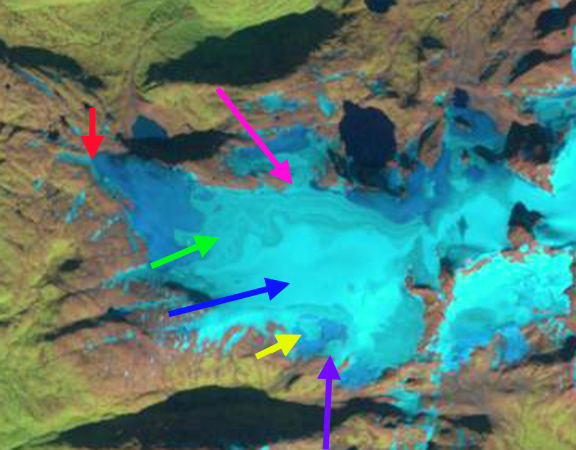
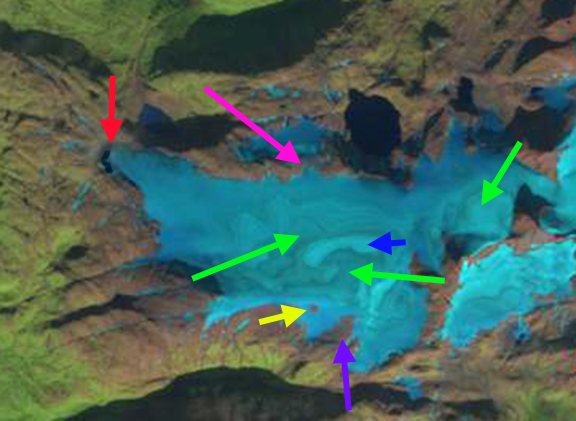
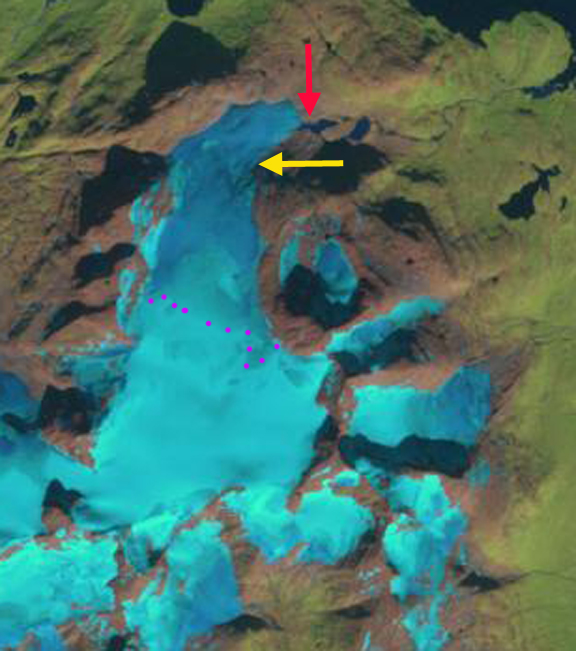
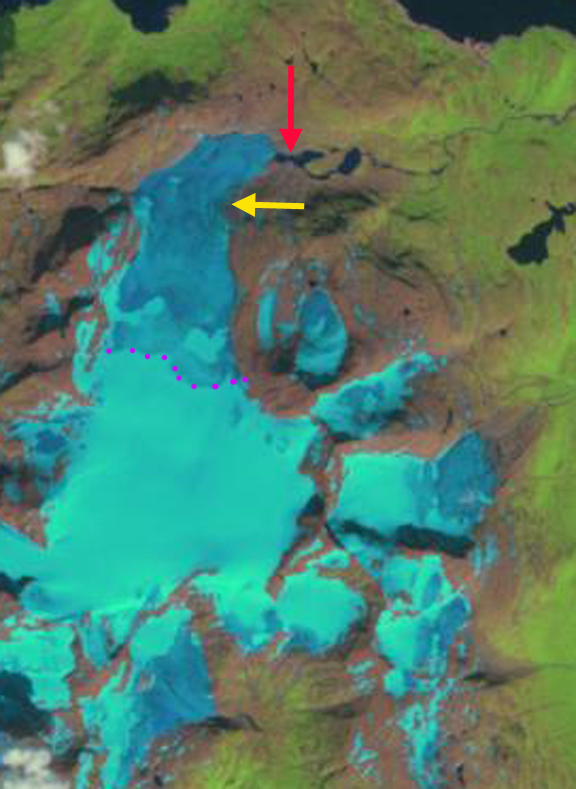
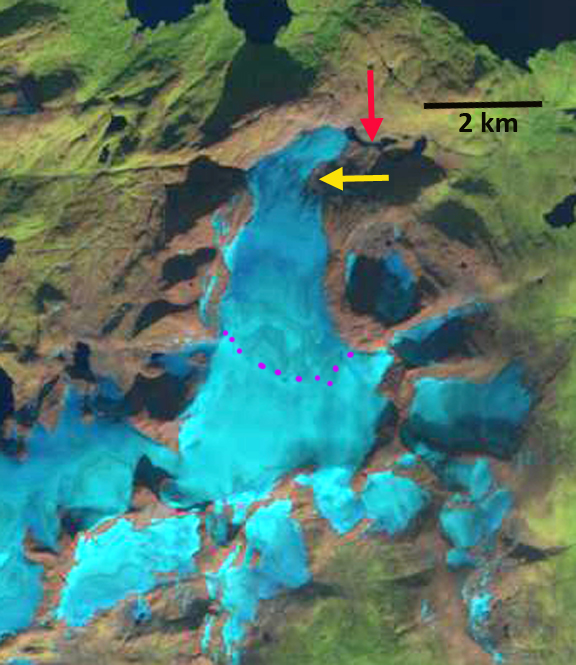
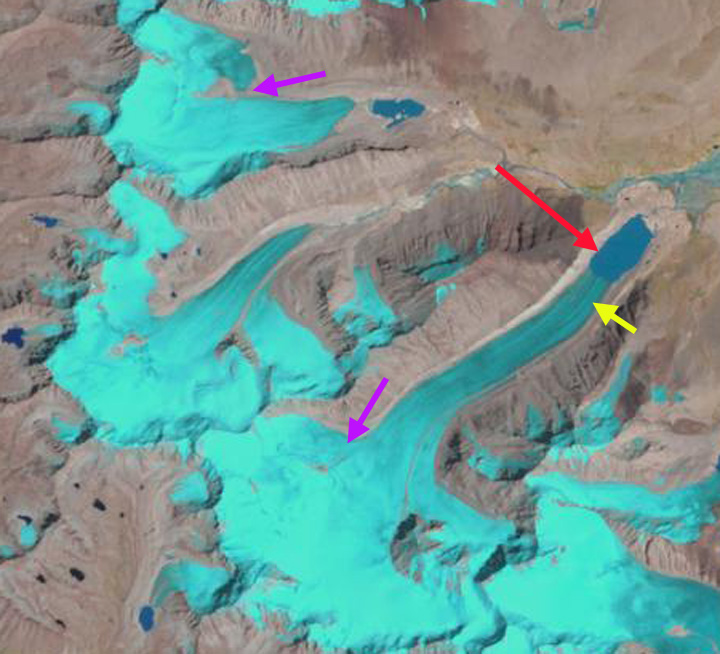
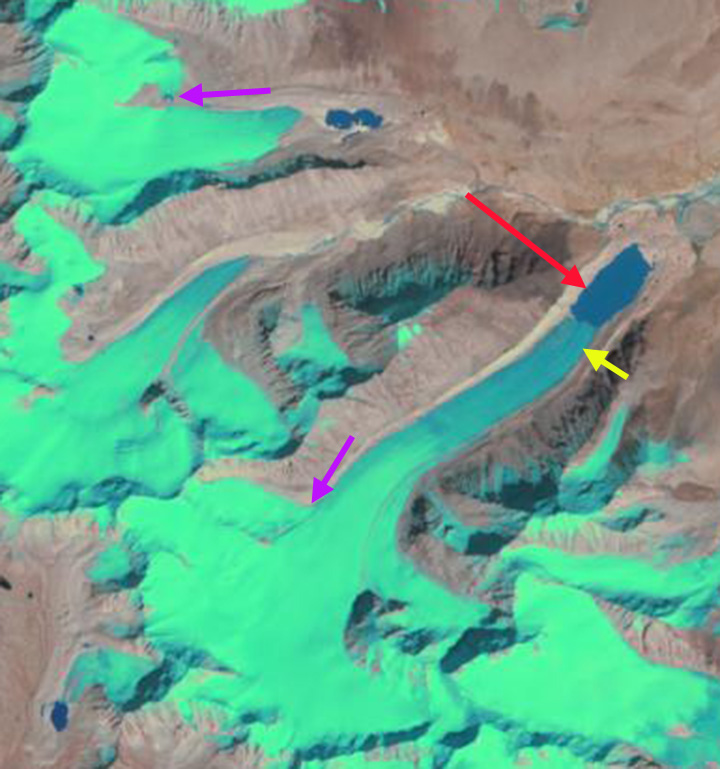
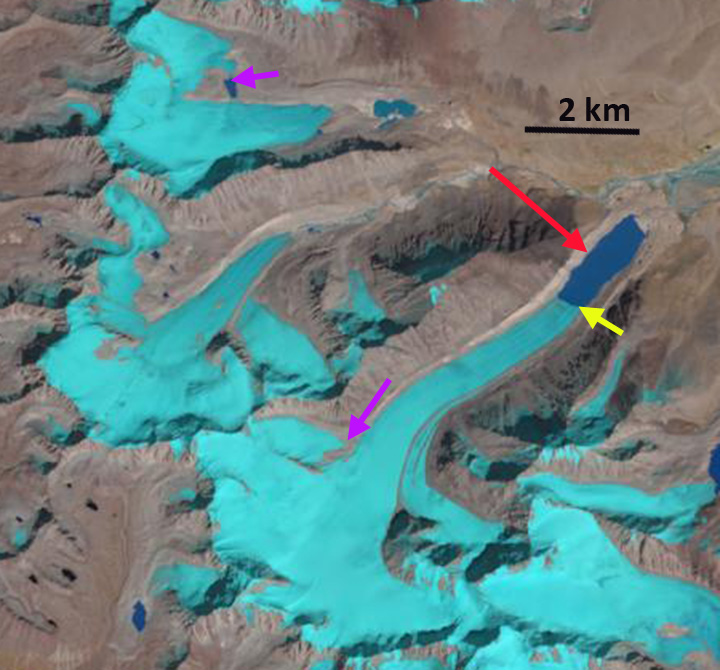
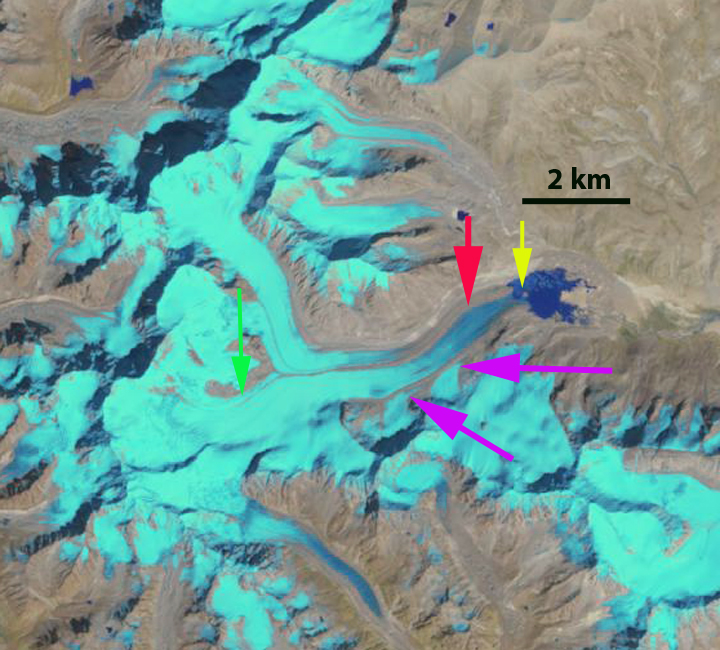
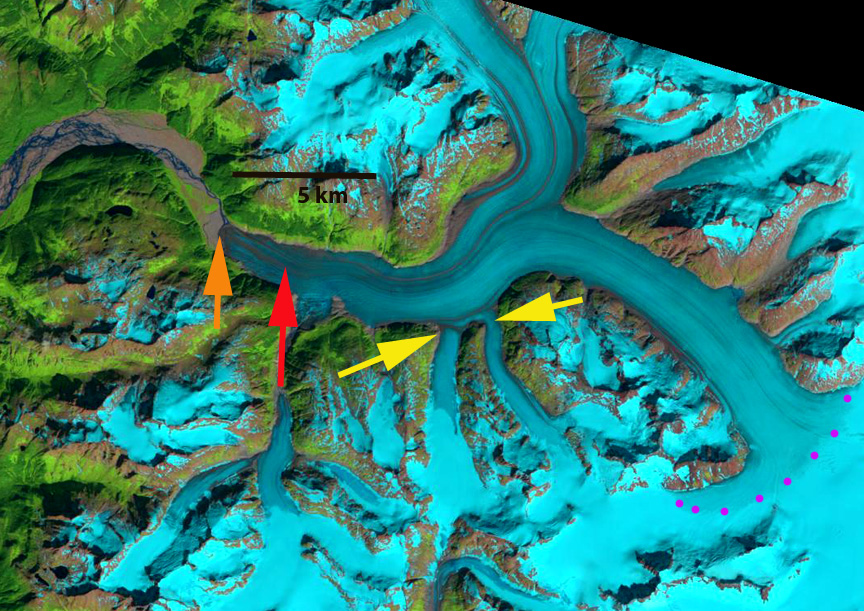
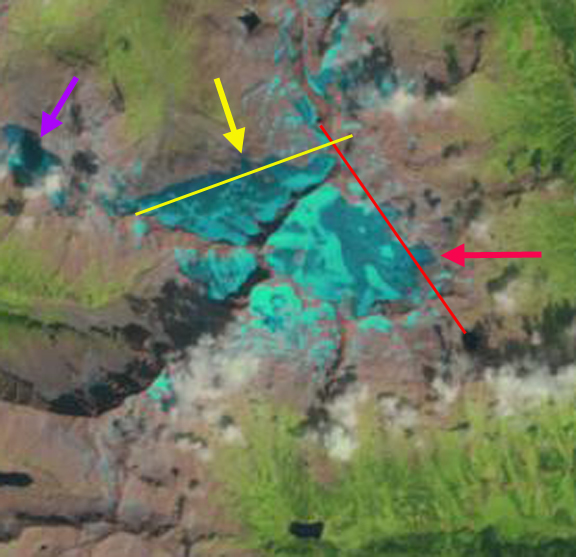
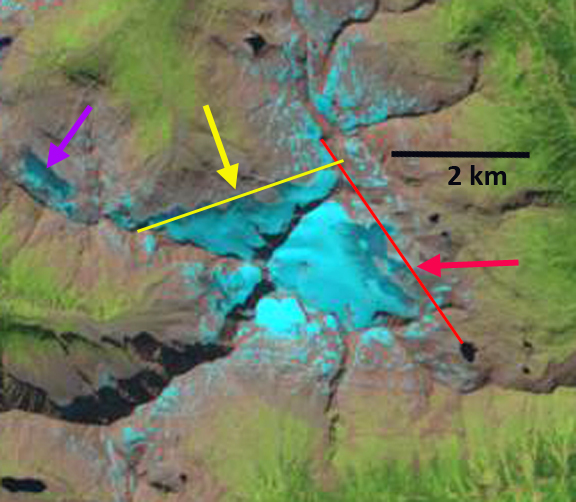
Here we examine the Hochalm Glacier and two neighboring glaciers and their response to climate change from 1990 to 2013 using Landsat imagery. The red line in each Landsat image is in the same location cutting across the Hochalm Glacier. The yellow line is in the same location transecting the Grosselend Glacier. In 1990 Hochalm Glacier has two termini tongues and has a width of 1.1 km extending past the red line. On Grosselend Glacier the terminus area extends beyond the yellow across the entire width of the glacier. The purple arrow indicates a small pocket glacier that has an area of approximately 0.45 square kilometers. In 2000 the Hochalm Glacier has just two narrow termi extending past the red line. The Grosselend Glacier still extends beyond the yellow line. In 2013 the southern terminus of Hochalm Glacier has disintegrated and only the northern terminus reaches the red line. On Grosselend Glacier approximately 40% of the glacier width reaches the yellow line, the main terminus tongue at the yellow arrow has retreated to the yellow line. The area of the glacier at the purple arrow is now 0.23 square kilometers, half of its 1990 extent.
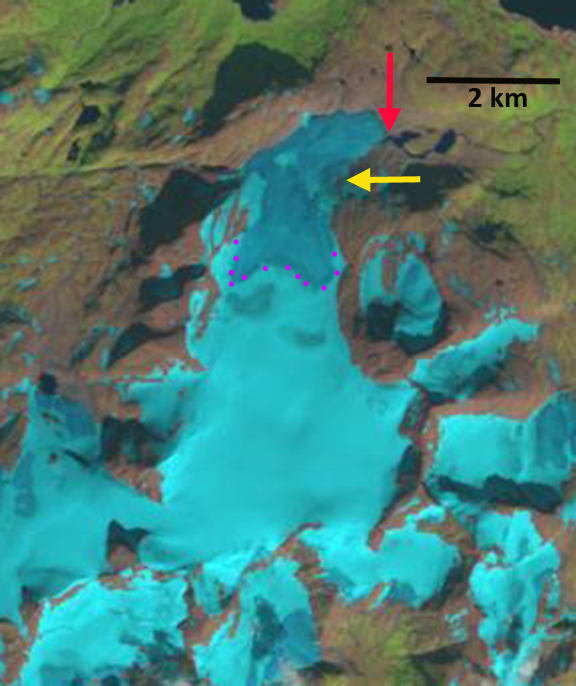
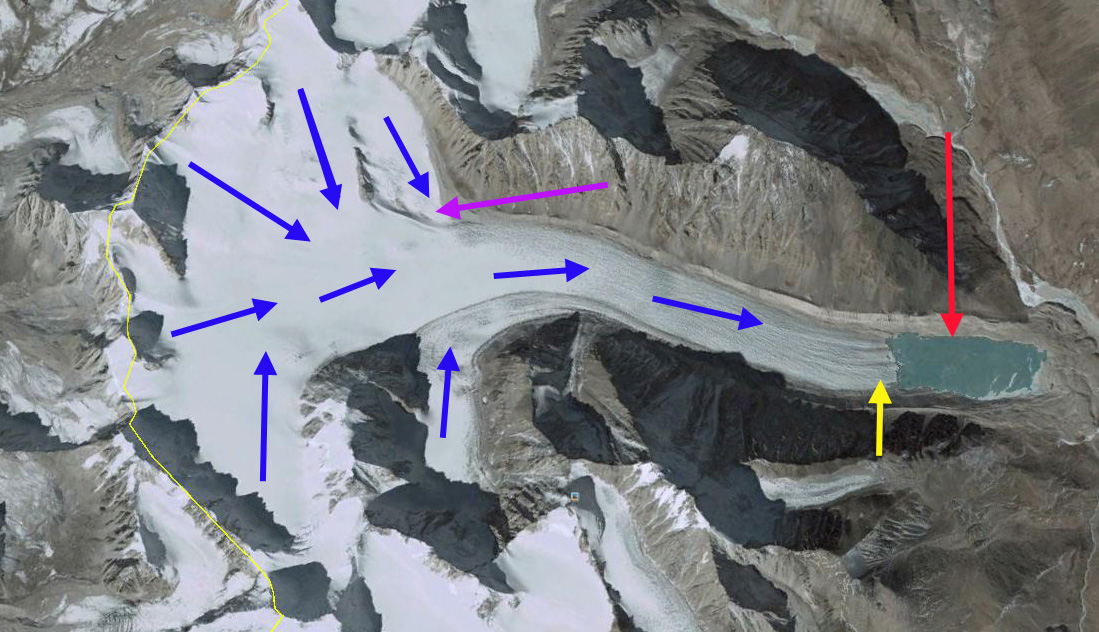
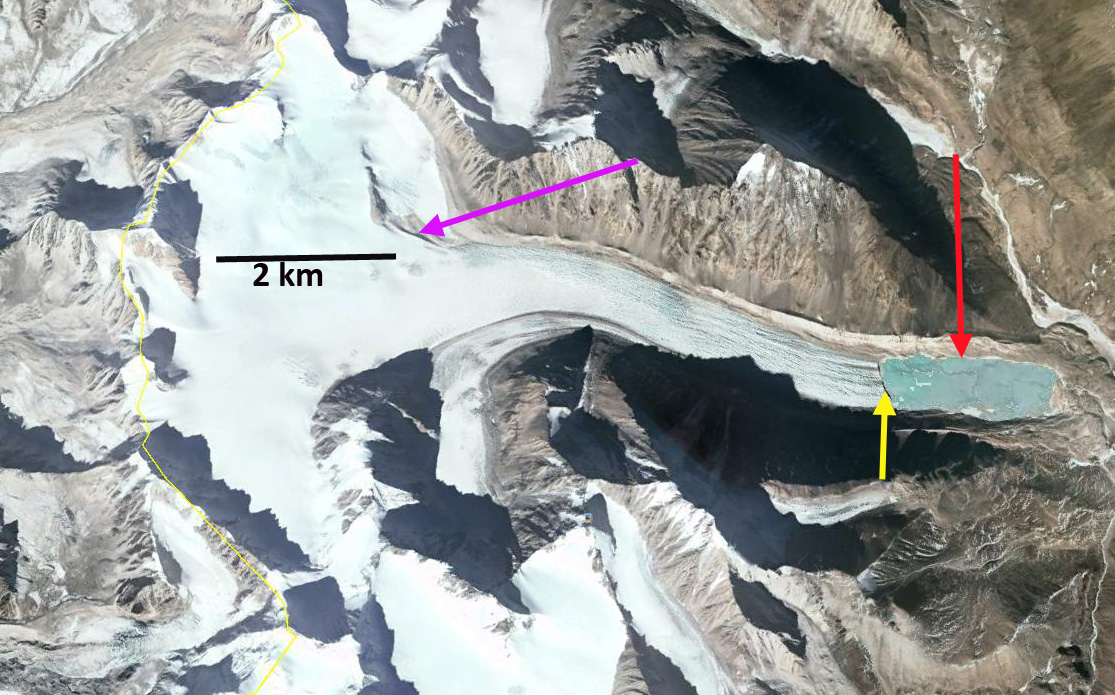
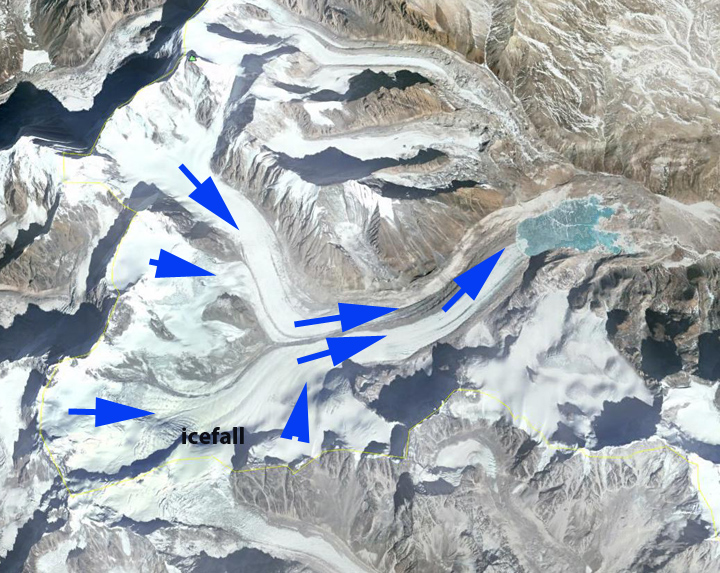
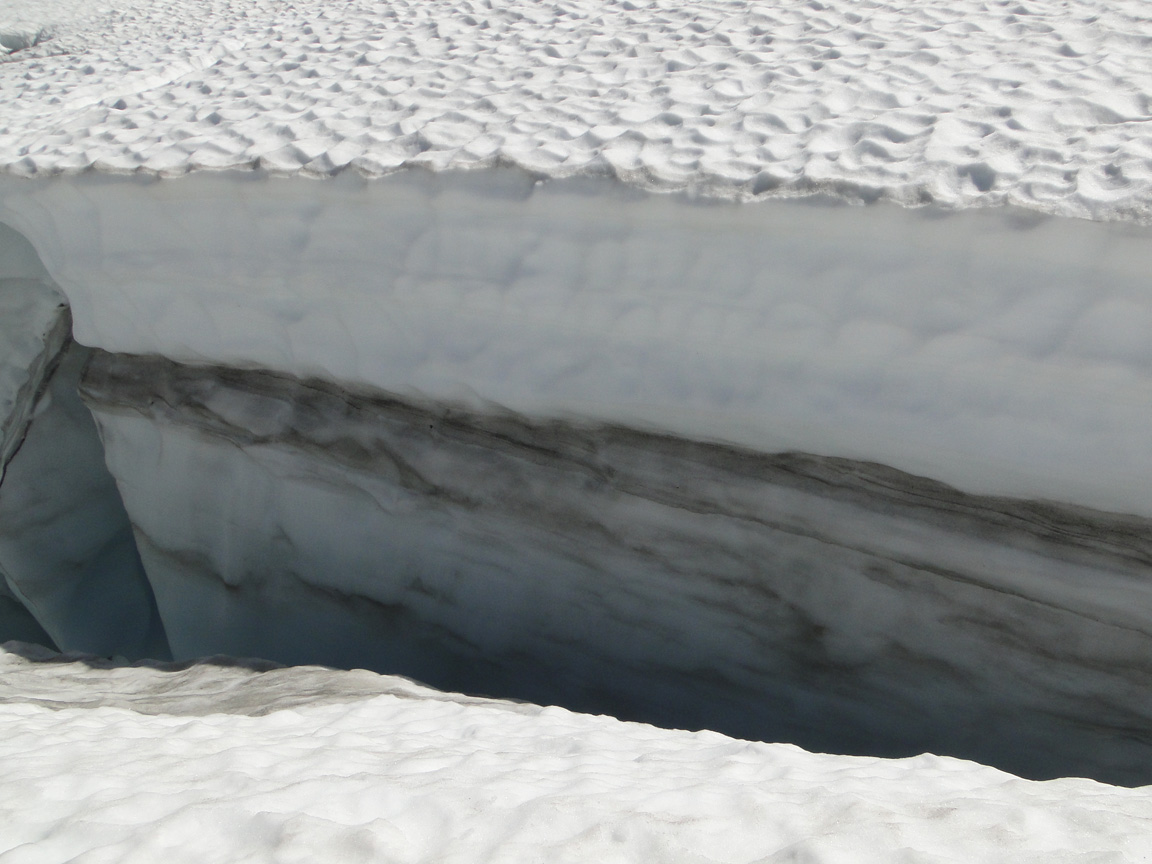
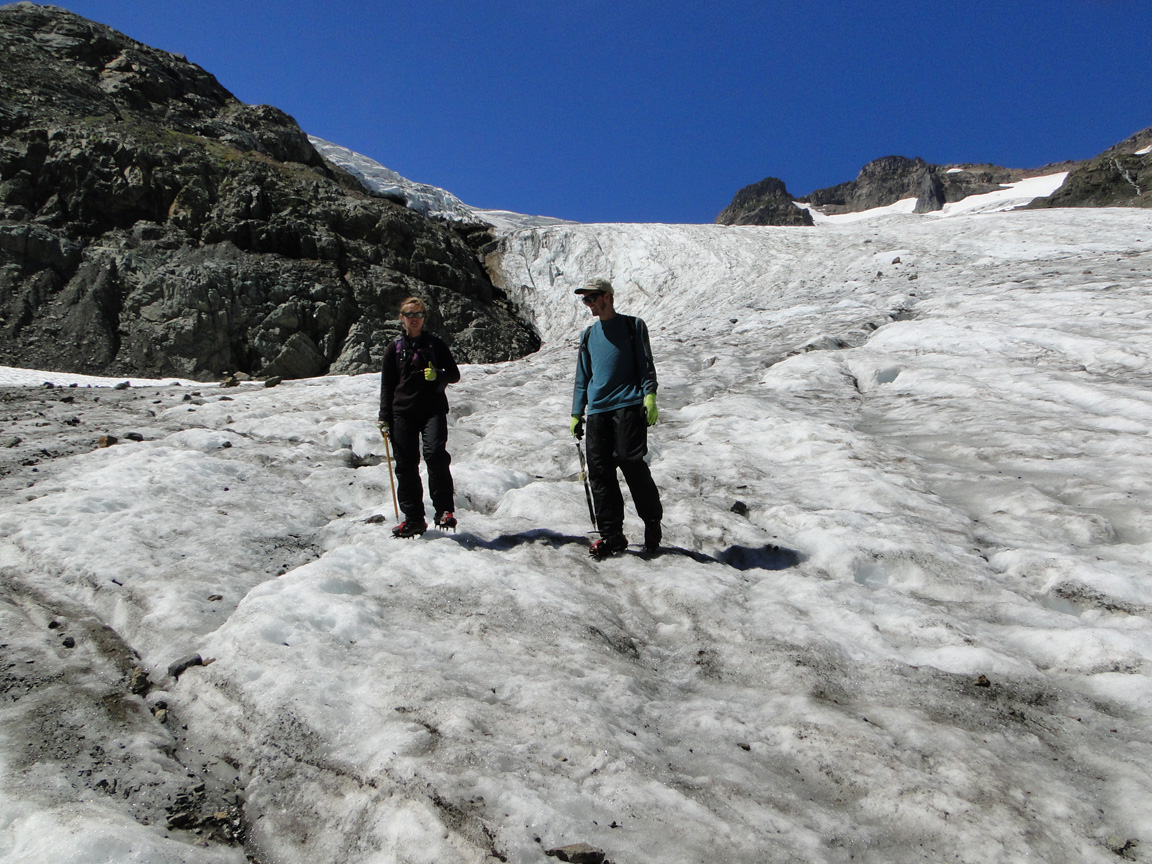
A 2006 Google Earth image of the Hochalm Glacier’s southern terminus indicates how thin it is with no crevassing, red arrow, and several large bedrock areas amidst the glacier, purple arrow. There are numerous annual horizons exposed just below the snowline as well, blue line. The retreat of Hochalm Glacier from 1990-2013 is 200 m for the northern terminus and 450 m for the southern terminus. For Grosselend Glacier the retreat of the main terminus is 450-500 m since 1990. The retreat follows that of Austrian glaciers as a whole as noted by Fisher et al (2014), and Abermann et al (2009). The glacier is thinning even in its upper regions, which indicates it cannot survive (Pelto, 2010). The retreat of Ochsentaler, Sulztalferner and Obersublzbach Glacier indicate a similar story.
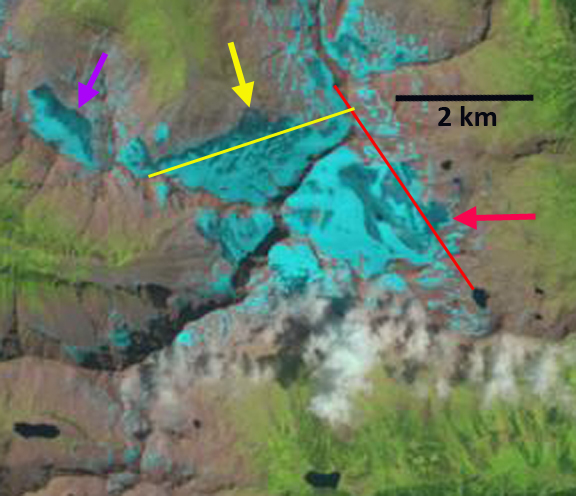
1990 Landsat image
2000 Landsat image
2013 Landsat image
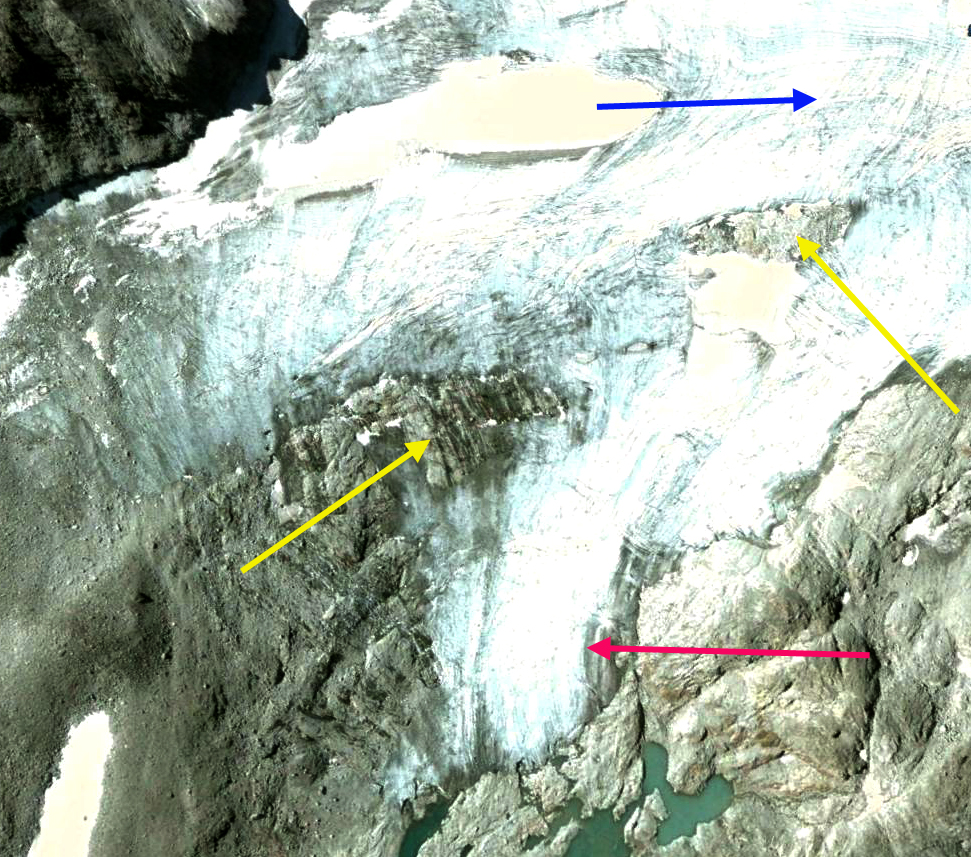
2006 Google Earth image