Professor of Environmental Science at Nichols College in Massachusetts since 1989. Glaciologist directing the North Cascade Glacier Climate Project since 1984. This project monitors the mass balance and behavior of more glaciers than any other in North America
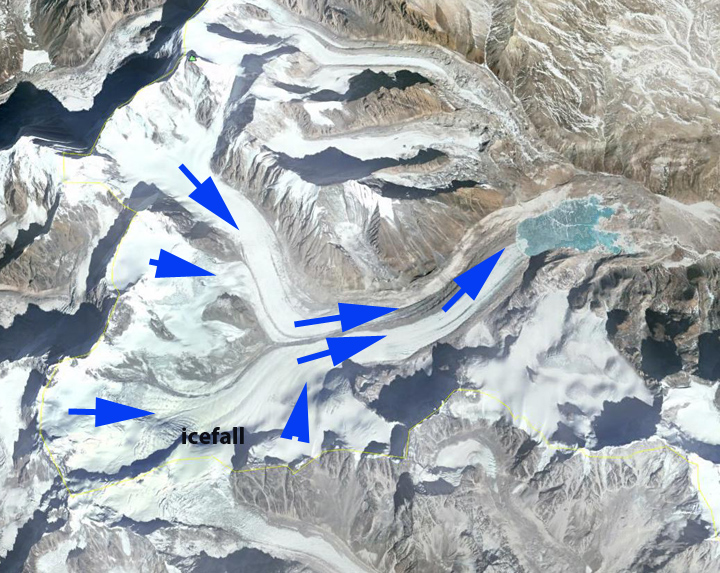
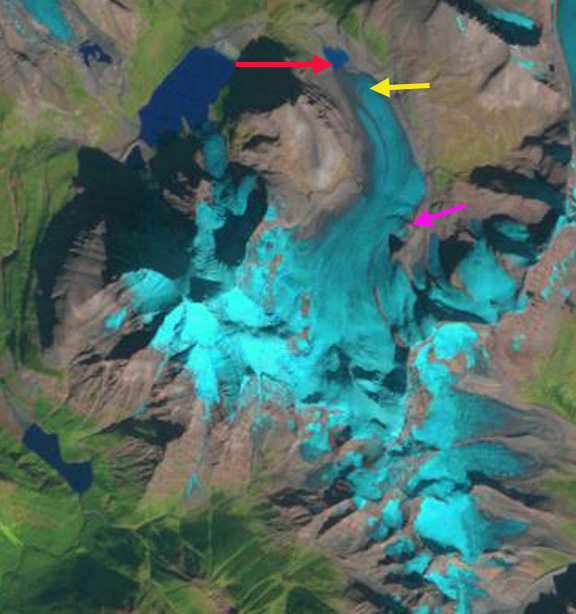
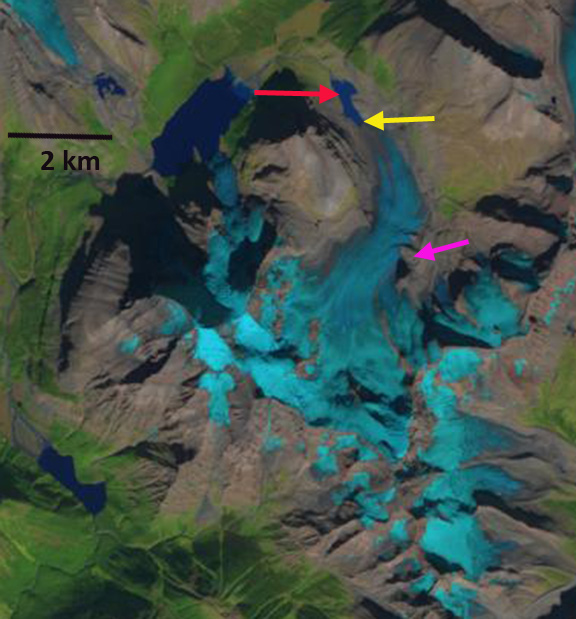
The Yemayundrung Glacier flows northeast from the Nepal-China border to end in lake at the headwaters of the Khugpi Chu River. This river is one of the source rivers of the Yarlung Tsangpo (Zangbo) in China which becomes the Brahmaputra in India. This is a region where Li et al (2011) noted that increasing temperature, especially at altitude, the fronts of 32 glaciers have retreated, mass losses of 10 glaciers have been considerable, glacial lakes in six regions have expanded and melt water discharge of four basins has also increased. This is further documented by an inventory of 308 glaciers in the Nam Co Basin, Tibet, where an increased loss of area for the 2001-2009 period, 6% area loss (Bolch et al., 2010) was observed. Here we examine Landsat imagery of changes in this glacier from 1998 to 2014.
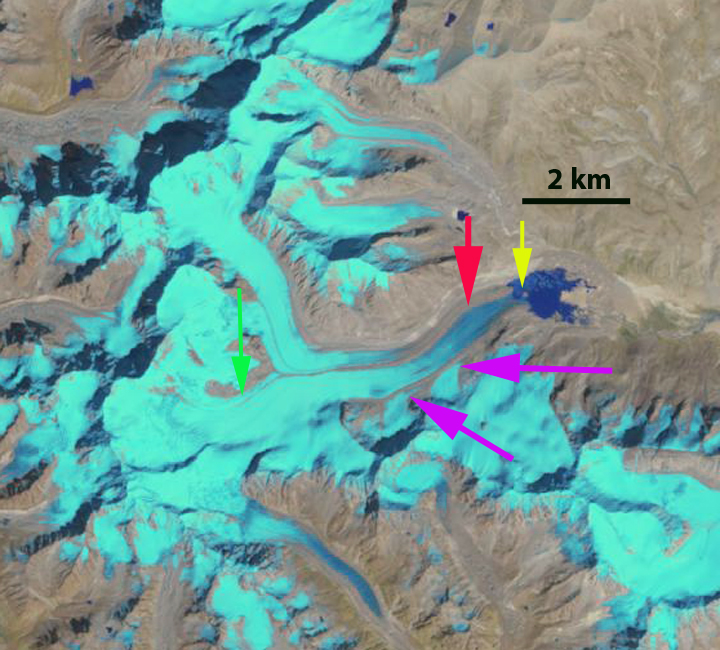
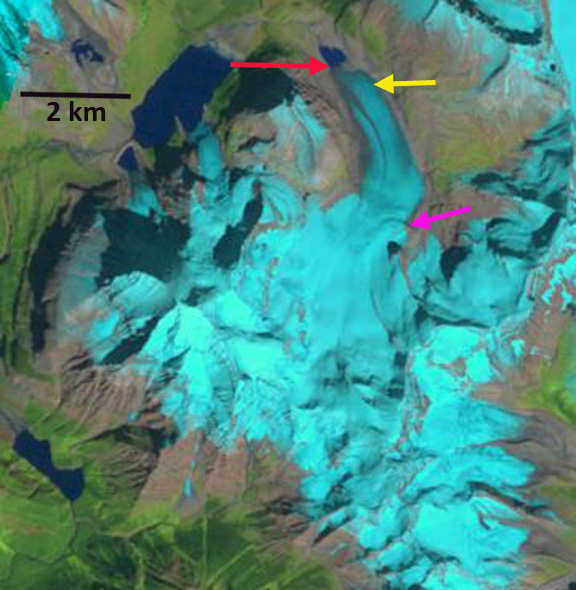
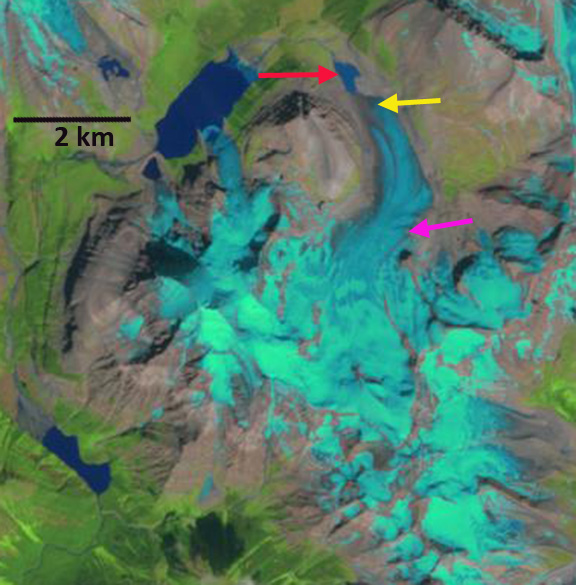
In each image the yellow arrow indicates the 1998 terminus and the red arrow the 2014 terminus. The purple arrows indicate a pair of tributary glaciers from the south and the green arrow a tributary after it has joined the main glacier separated by a lateral moraine. In 1998 the glacier terminates at the yellow arrow and the maximum length of the proglacial lake at the terminus is 1 km. The two tributaries from the south join the main glacier. The tributary at the green arrow has a blue ice tongue that extends down glacier to the main glacier junction. In 2000 the terminus has retreated a short distance, but there is little change in the tributaries. By 2013 the lake has lengthened to 1.8 km with glacier retreat. In 2014 the two southern tributaries at the purples arrows no longer connect to the main glacier. The tributary at the green arrow no longer has blue glacier ice extending past the arrow to the main glacier junction. The glacier has retreated 750 m from 1998-2014. The thinning of several tributaries is indicative of less volume flux toward the terminus, which will lead to continued retreat of this glacier and lake expansion. The retreat is similar to that of Durung Drung Glacier, India, Reqiang Glacier, China and Matsang Tsanpo Glacier, China and Ribuktse Glacier, China, which are in a similar climate setting. This area did get an unusual heavy October snowfall from Cyclone Hudhud this week.
Ferebee Glacier is in the Coast Range of Alaska 15 km northeast of Skagway. The Ferebee River that drains the glacier flows into the Chilkoot Inlet. The glacier begins at 1800 m in the Klukwah Mountains and flowed south and terminated on an outwash plain at 200 m in the USGS map of the region from 1955. Little change in the terminus occurred prior to 1981. I observed the glacier from the air in 1981 and there was no lake at the terminus and only a minor several hundred meter wide devegatated zone from recent retreat. Here we examine Landsat imagery from 1986-2014 to identify recent change. A landslide occurred onto Ferebee Glacier in 2014, that will add debris cover to the surface that is limited today.
Google Earth image
USGS map of area
In each image the red arrow marks the 1986 terminus, the yellow arrow the 2014 terminus and the purple dots the snowline. In 1986 the glacier still terminated on the outwash plain at the south end of what is a newly forming lake small pockets of open water are evident on the lateral margins. The snowline is at the base of the lower icefall at 900 m. By 1999 a lake has formed at the terminus, that is 1.2 km long, a retreat of nearly 100 meters per year. The snowline is at 1000 m in 1999. A 2004 Google Earth image of the terminus area indicates two regions of concentric crevassing upglacier of the terminus, one adjacent to the yellow arrow, this indicates ice that has been lifted and then dropped by water, which only happens if the ice is thin enough for flotation. By 2013 the lake has more than doubled in length and the snowline is near the top of a pair of icefalls at 1300 m. In 2014 the lake is 2.7 km long on the eastern shore and 2.5 km long on the western shore. The glacier has retreated 2.6 km in 28 years, still nearly 100 m/year. The lake is not becoming narrower and there is no elevation step on the glacier, to suggest the end of the developing lake is near. The snowline in 2014 even in early August is at 1400 m. This glacier will continue to retreat as long as the snowline is above the top of the icefalls at 1250 m. The retreat of this glacier is like the Meade Glacier across Chilkoot Inlet, LeBlondeau Glacier just to the west and Gilkey Glacier to the south.
1986 Landsat image
Meade Glacier drains the northwest portion of the Juneau Icefield, with meltwater entering the Katzehin River and then Chilkoot Inlet. The glacier begins in British Columbia and ends in Alaska. Here we use Landsat imagery to examine changes in the glacier from 1984 to 2014. The glacier experienced a slow continuous retreat from 1948 to 1986 of 400 m, the glacier ended on an outwash plain. From 1991-2006 JAXA’s EROC program noted a retreat of 570 m, retreating into a lake basin. In 2007 the lower 2.5 km of the glacier was stagnant and heavily crevasses, poised for collapse in a developing proglacial lake. The 1948 map of the glacier indicates no proglacial lake with the glacier terminating on an outwash plain.
USGS Topographic map from 1948 aerial photographs
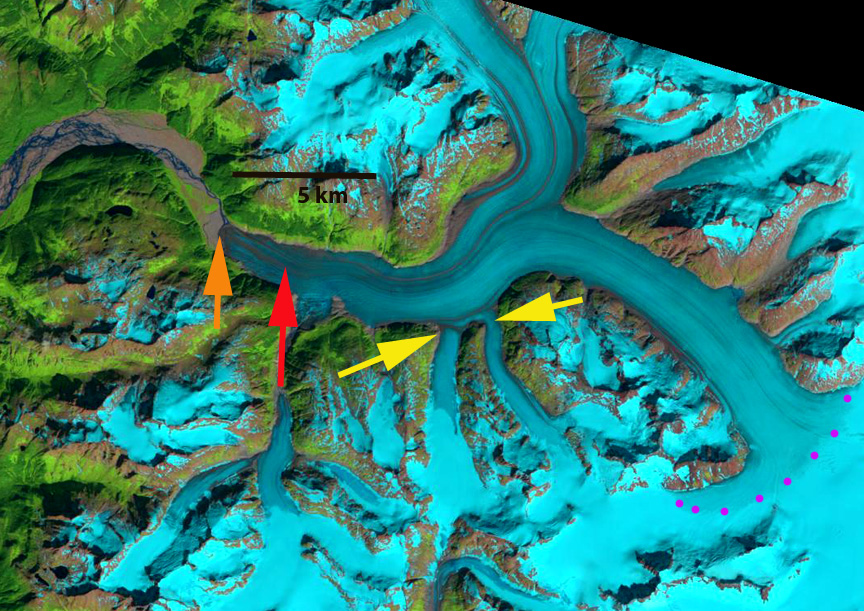
In 1986 the terminus is indicated by an orange arrow, the 2014 terminus by a red arrow, two tributaries that connect to the Meade Glacier are indicated by yellow arrows and the snowline at is indicated by purple dots. The snowline is at 1250 m in 1986, there is no evident lake at the terminus of glacier just an expanding outwash plain. Both tributaries are 750 m+ wide where they join Meade Glacier. By 2004 a 400 m long proglacial lake has formed at the terminus. The two tributaries from the south at the yellow arrows no longer are connected to the glacier. The snowline is at 1450-1500 m, which is much higher than in 2004 on Taku Glacier or Brady Glacier. In 2009 the snowline is at 1400 m, the proglacial lake has expanded to 600 m in length. In 2014 the proglacial lake is 3.5 km long, the entire lower 2.5 km of the glacier has collapsed since 2007. There is still considerable relict ice floating in the lake. There is a substantial lake along the southern margin of the glacier where a tributary streams enters the main valley. This indicates the glacier will quickly retreat to this point by further collapse into the lake. The snowline in 2013 and 2014 was quite high and the summer’s quite warm which aided in the lake expansion. The snowline in 2014 is at 1400 m on Aug. 2, the date of the imagery, the high snowlines ensure continued mass loss and glacier retreat. There was still six week of summer melting remaining on the date of the imagery. The Meade Glacier is poised to continue a rapid retreat in the near future its retreat parallels that of most Juneau Icefield glaciers including the next glaciers to the south Field Glacier and Gilkey Glacier.
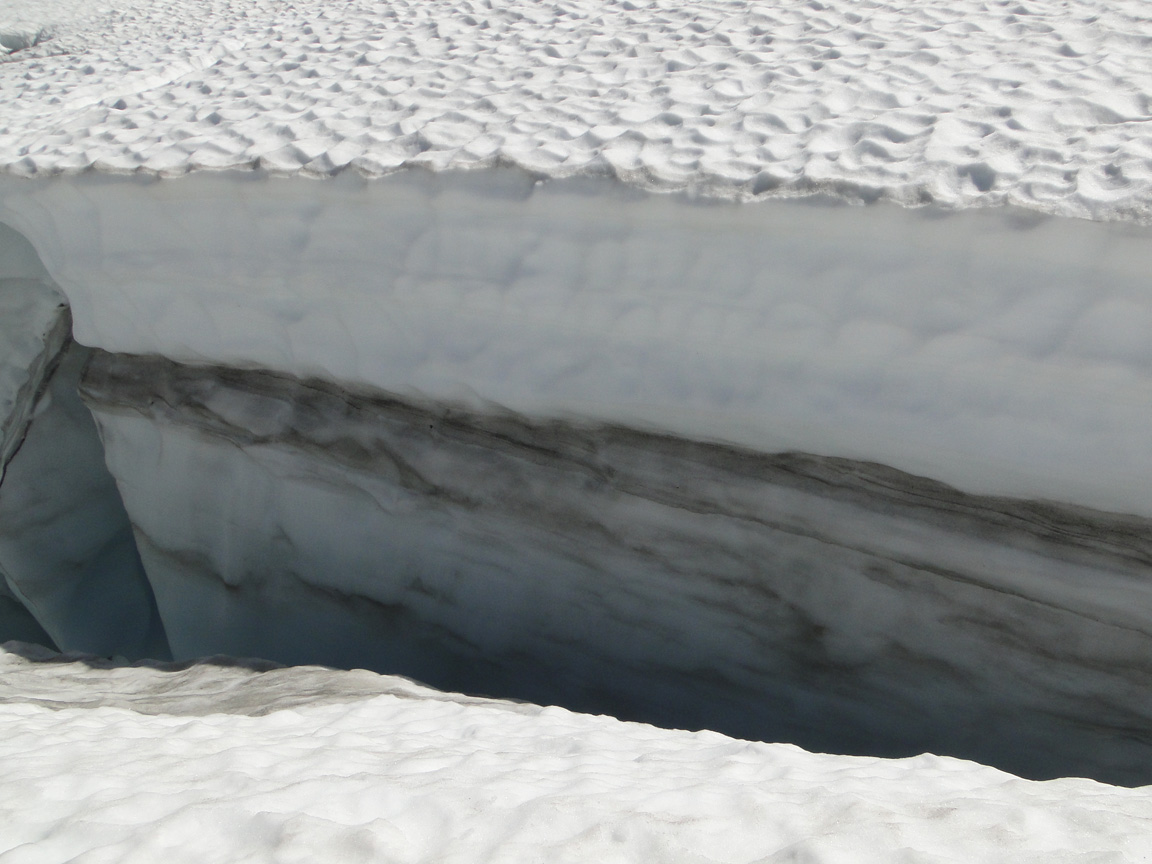
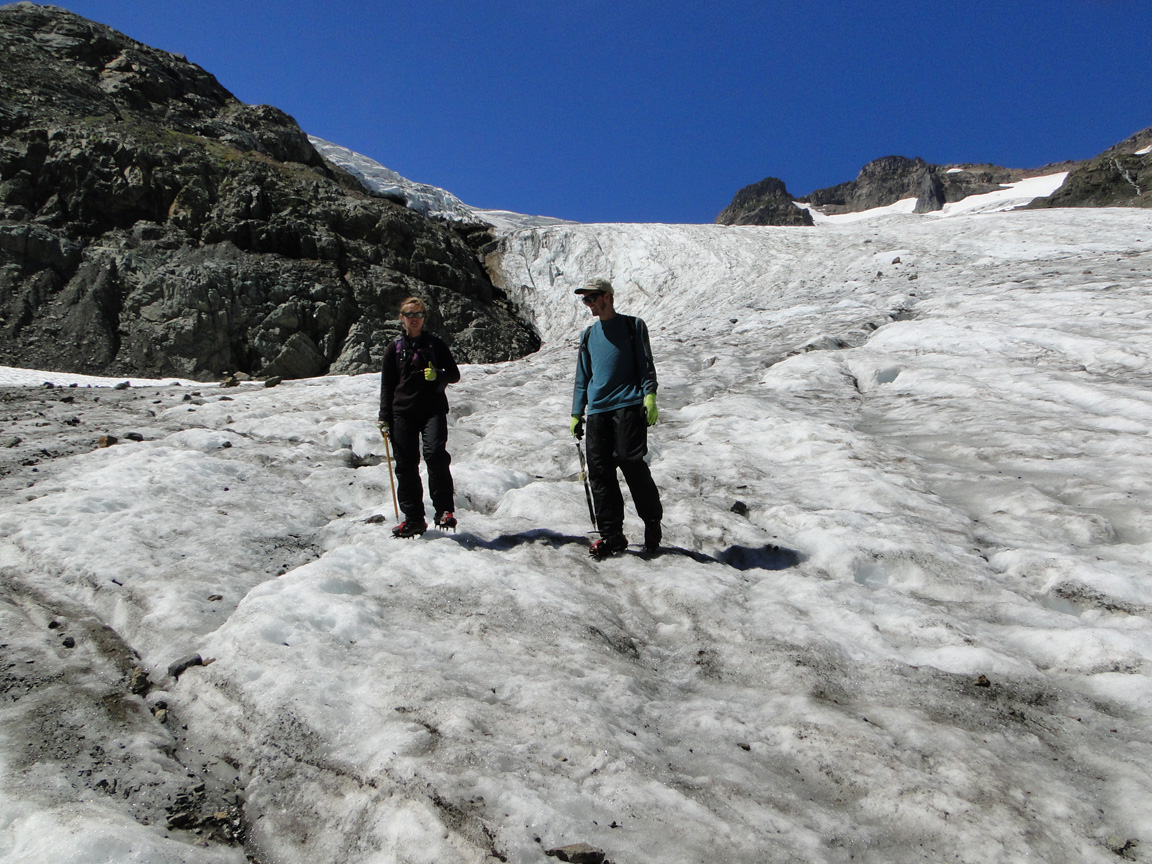
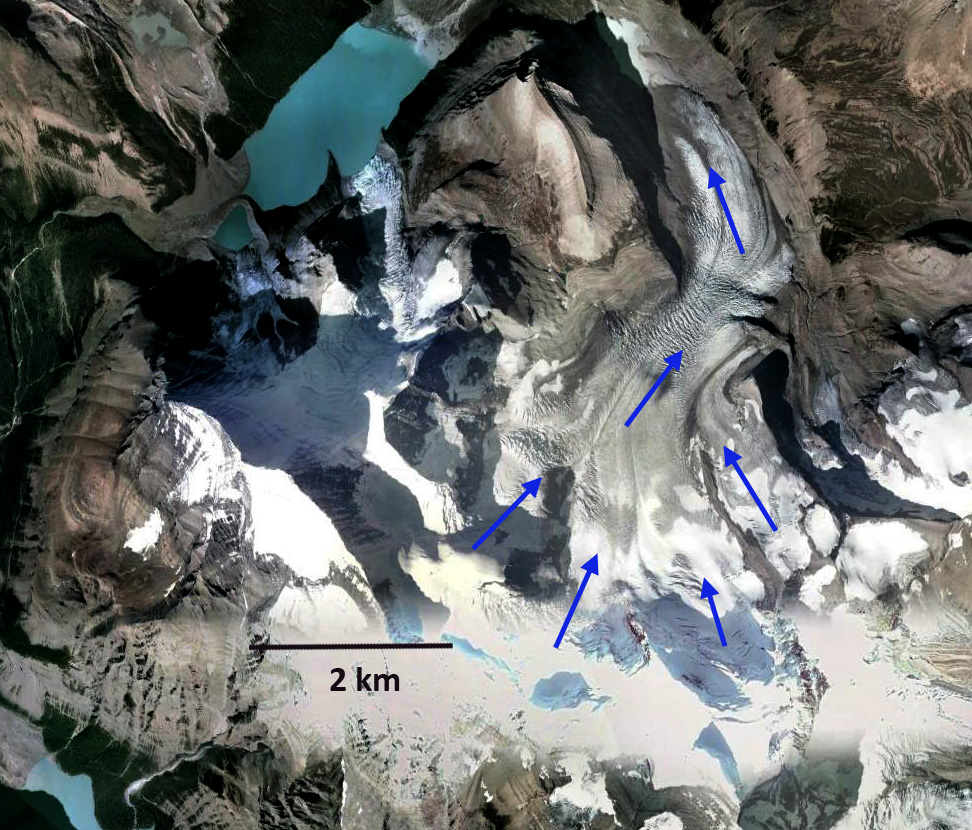
From 1984-2014 we have monitored the mass balance of the Rainbow Glacier on Mount Baker, North Cascade Range, Washington. This entails detailed monitoring of snowpack depth in July and August, and subsequent ablation to the end of the melt season. On July 13th the glacier was completely snowcovered. By August 10th the snowline had risen to 1575 m, with 1.4 m of ablation since July 13th. We measured the snowdepth at 85 locations on the glacier, with only 6 measurements exceeding 3.5 m on Aug. 10th.Ben Pelto and Ashley Edwards examining crevasse stratigraphy both the 2013 and 2014 layers evident.
Limited snowpack below the main icefall at 1750 m on Aug. 10.
Limited snowpack below the main icefall at 1750 m on Aug. 10.By September 27th the snowline had risen to 1975 m with a few pockets of snow retained where the snowdepth had exceeded 3.2 m on Aug. 10th. Snowdepth at the Sept. 27th snowline had been 3.0 to 3.2 m on Aug. 10th. This indicated ablation of approximately 3 m of snowpack, 1.8 m of water equivalent from Aug. 10th to Sept. 27th. Ablation from July 13th to Sept. 27th was 5.3 m of snowpack and 3.2 m w.e. This was 5-10% more ablation than any other year since 1984. A comparison of images from the ground on Aug. 10th indicates the snowpack on the glacier from 1550-1950 m, the blue arrows indicate locations where a patch of 2014 snow remained on Sept. 27th. The Sept. 27th image was taken by Tom Hammond from Rainbow Ridge the only location where the whole glacier can be viewed. The firn is simply old snow that survived a summer and could be from 2012 or 2013. Aug. 10th accumulation zone view
Tom Hammond Image adusted to show firn, ice and retained snow. Sept. 27th
Winter snowpack was normal on Mount Baker, the record ablation then led to a large negative mass balance for the glacier of -1.8 m, but not a record loss. The ablation did lead to many significant surface streams on the glacier shown below, which drain into the glacier at moulins.
The terminus of glacier retreated rapidly from 1984 to 1998, but has slowed as it currently is in an avalanche runout zone. We visited the terminus in 1984 and all retreat is measured from that point when the glacier was in contact with an advance moraine from the 1955-1980 period of advance. A comparison of 1993 and 2006 Google Earth images indicates the retreat, red outline 2006 margin and black outline 1993. The 2014 image taken by Tom Hammond indicates that the terminus did get exposed in 2014 which will lead to additional retreat when we measure the terminus position next summer. Total retreat from 1984 to 2014 is 490 m. 1993 Google Earth view of terminus
2006 Google Earth view of terminus.Picture of the terminus in 2014 indicating the 214 and 1984 position. Taken by Tom Hammond from Rainbow Ridge.Ablation zone on Aug. 10
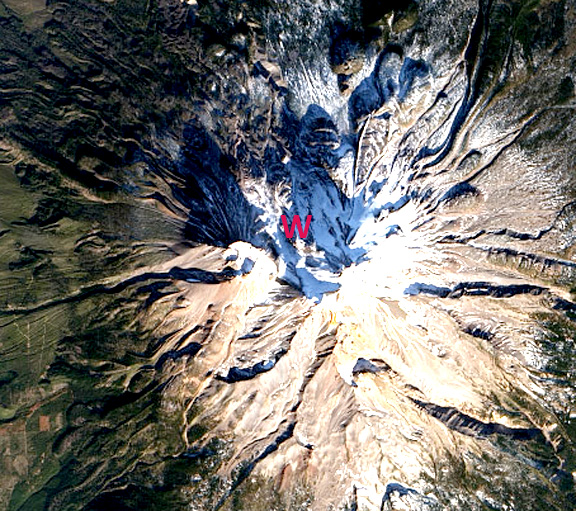
Mount Shasta is a stratovolcano home to the largest glaciers in California. Of the seven glaciers on the mountain Whitney Glacier on the north side is the longest. The last two years 2013 and 2014 have seen hot dry summers separated by a dry winter in 2013/14, see below, how are the glaciers responding? In 1981 USGS (Driedger and Kennard, 1986) mapped the area and volume of several of the glaciers, in a landmark study of glacier volume on Cascade volcaones. Whitney Glacier had an area of 1.3 square kilometers, a maximum depth of 38 m, and a volume of 25 million cubic meters. The glacier was noted as having a length of 3.0 km ending on the USGS map at 9900 feet.
January satellite image of Mount Shasta’s limited snowpack
Topographic map of Mt. Shasta.
A UCSC study looking at the change in the glaciers from 1944 to 2003 noted an expansion of the Mount Shasta glaciers that when published in 2008 was in contrast to most alpine glaciers globally or in the Pacific Northwest. Tulaczyk and Howat (2008) noted that Whitney Glacier had advanced 850 m since 1951 to 2003, but when did retreat begin? There was a period of advance for many Cascade volcanoes glaciers between 1950 and 1980, but retreat after. For example on Mount Baker all of the glaciers advanced during the 1944-1979 period by an average of 480 m (Pelto and Hedlund, 2001). By 2010 Pelto and Brown (2012) observed all were retreating with an average retreat of 370 m. In 2003 all of them all had retreated , but many were in advance of their 1944 position. By 2014 the retreat has exceeded the advance from 1944 on most Mount Baker glaciers, more on this in the next post. This is an important point for Mount Shasta too, Whitney Glacier was advancing in 2003 but had been retreating in the late 1980’s and 1990’s. Whitney Glacier was further advanced than in 1944, but how short lived was the advance? Here we examine satellite images from 1987 to 2014 to identify recent trends, along with Google Earth imagery of termini of several glaciers and the 1981 USGS observations.
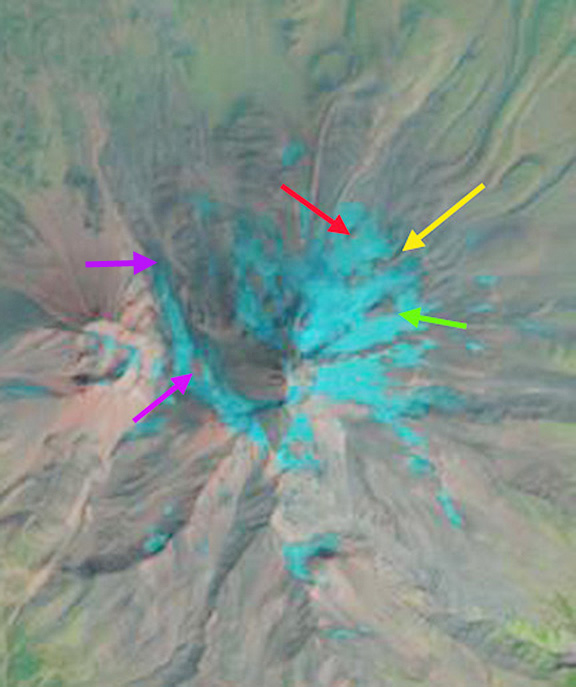
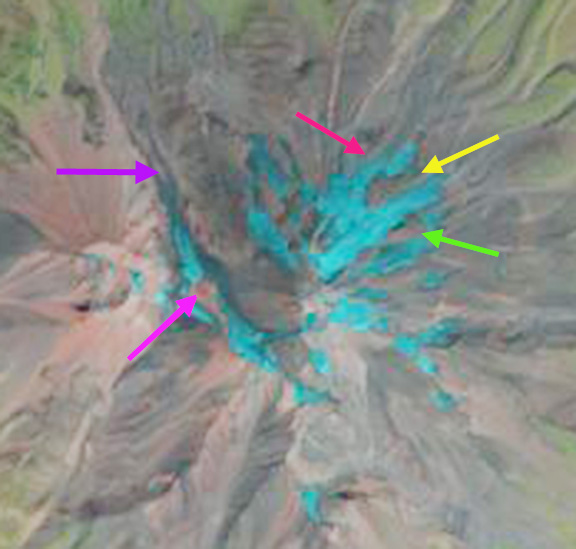
The first sequence is a 1987, 2013 and 2014 Landsat image with a pink arrow at the top of Whitney Glacier indicating the expansion of bare rock at the head of the glacier. The purple arrow is at the 1987 terminus, which indicates some retreat and also thinning by 2013.
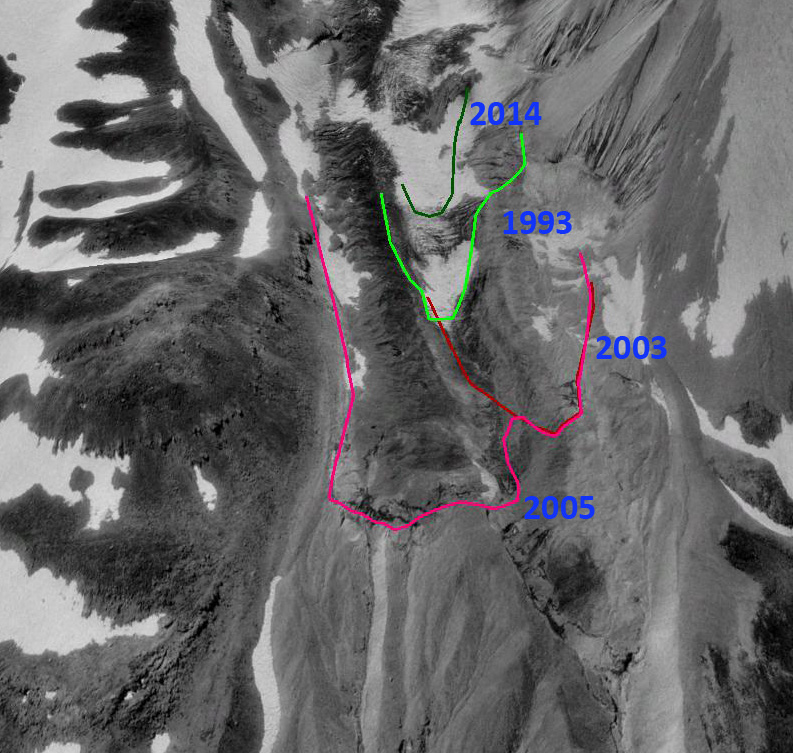
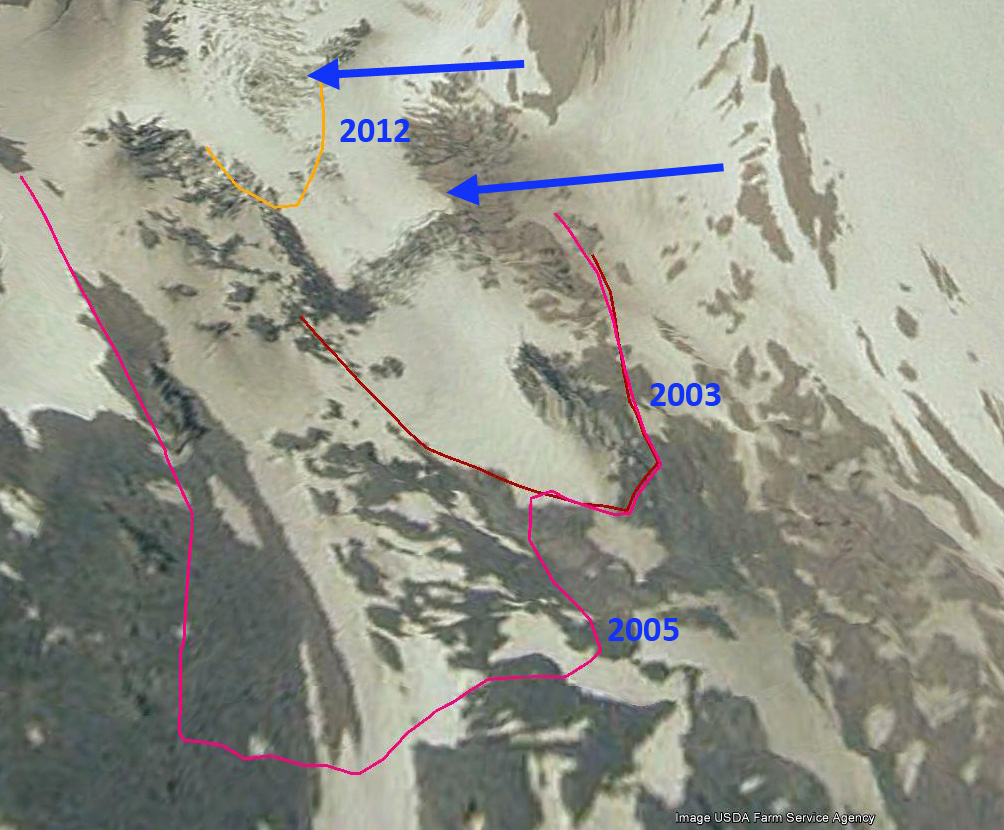
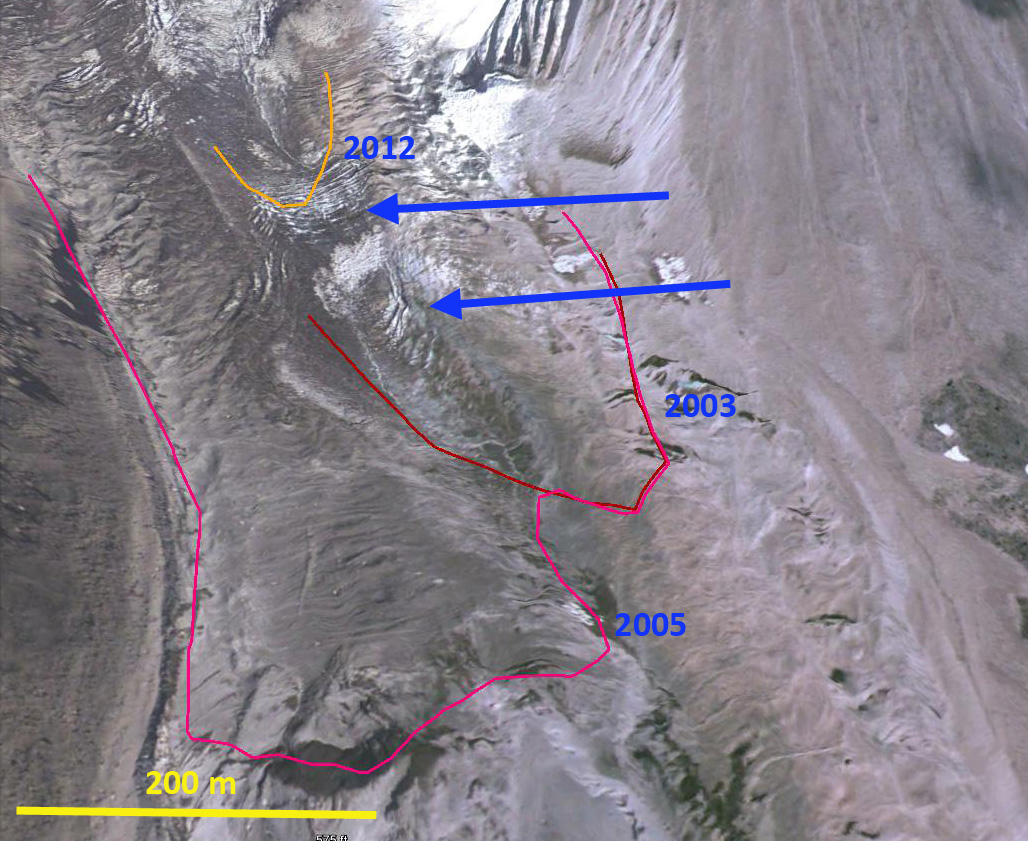
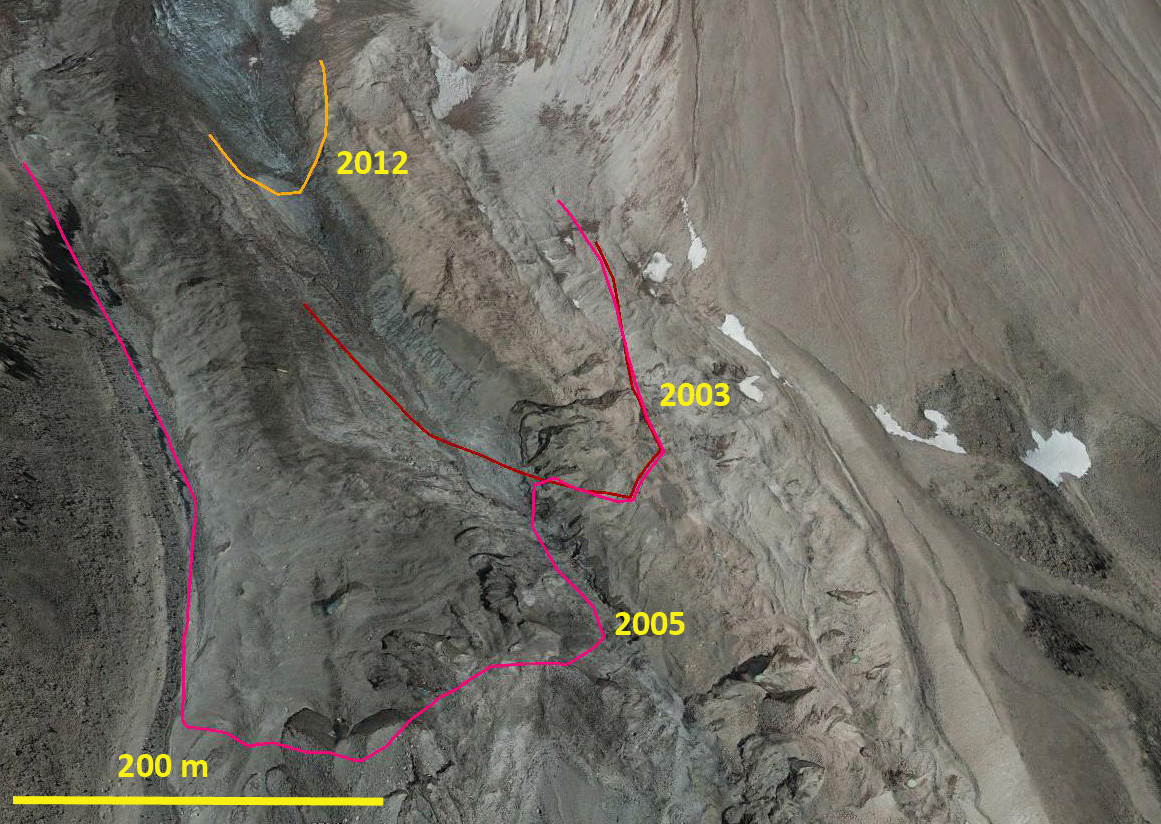
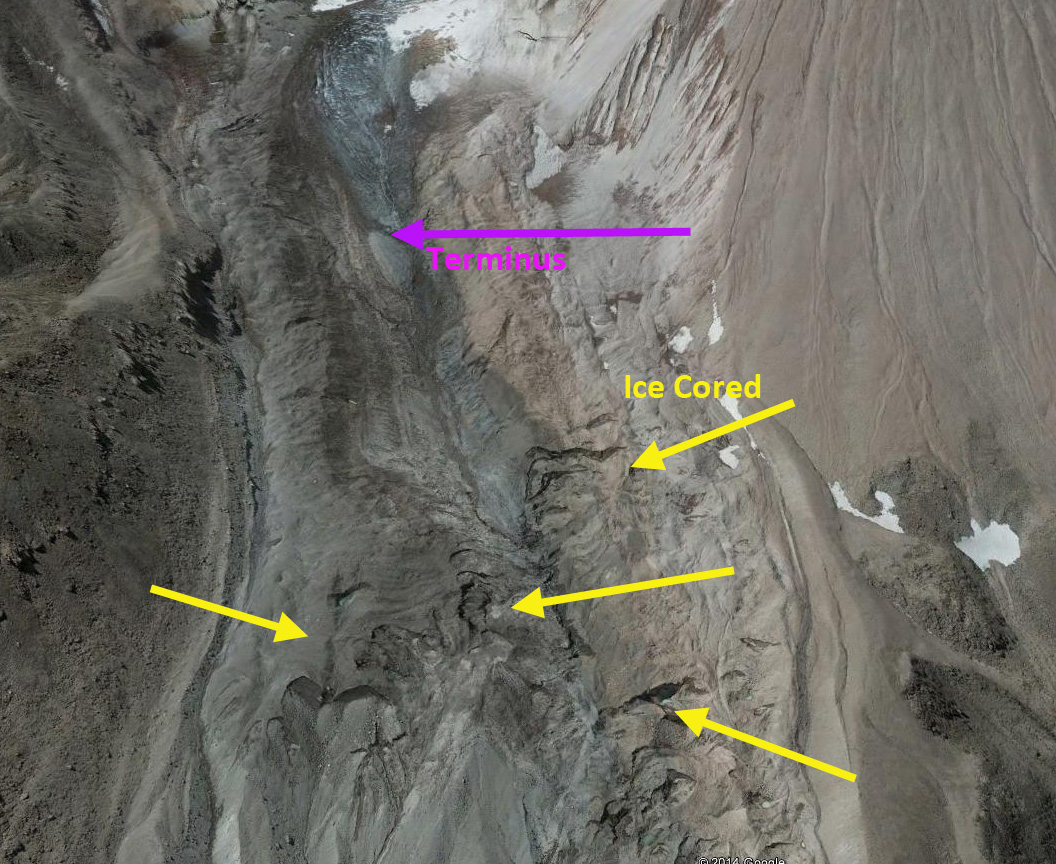
In between 1987 and 2013 of course was the period of advance and then retreat that is examined in the second sequence of images from Google Earth of the glacier in 1993, 2003, 2005, 2012 and 2014. It is evident that the glacier did expand between 1993 and 2005, as Tulaczyk and Howat (2008) had noted the advance period was unusual. The advance was likely limited to the 1999-2005 period due to heavy snowfall from 1998-2002. The 2005 terminus is quite near the 1981 terminus position indicating a period of retreat in the 1980’s and 1990’s. In 2003 and 2005 there is extensive crevassing at the blue arrows. The glacier terminus margin is indicated by a red line for 2003, pink line for 2005 and orange line for 2012 and green for 2014. It is evident that the zone of heavy crevassing and significant ice motion in 2003 and 2005 is in the vicinity of the 2012 terminus. By 2012 and 2014 the glacier is thin in its lower reaches with no crevassing. This indicates the retreat will be continuing. By 2014 the terminus of the glacier had retreated 700 m from 2005 and is now 2.6 km in length and terminates at 10,200 feet, 400 feet higher than a decade before or in the 1981 map. A closeup of the terminus in 2012 indicates the thin uncrevassed nature with surface streams incised into the ice. There are some areas of ice cored moraine beyond the current terminus.
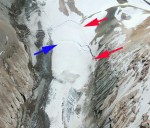
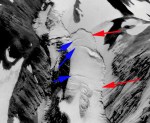
The retreat of glaciers on Mount Shasta leads to thinner ice and lower velocities, but can also lead to ice failure and avalanching, along with more subglacial melt pockets-caves developing. This is likely beyond the recent small outburst flood on Mt, Shasta. The reduced velocity high on Whitney Glacier is evident from observations of a key crevasse set higher on the glacier beginning at an elevation of 11700 feet. The red arrows point out what is a bergshrund along most of its length separating the glacier from the surrounding non-glacier snowfields. The blue arrows indicate crevasses below the bergshrund. Note that the vertical and horizontal offset of the bergshrund had declined from 1998 to 2014, and the number and extent of the crevasses has also declined. Both indicate reduced acceleration and velocity.
On glaciers in the coastal ranges of the Pacific Northwest glacier ice worms thrive. Their diet as far as we have seen from looking in their gut is algae. They cannot survive during daylight hours on the surface of the snow with even indirect solar radiation. They can survive on the surface of glacier ice if bathed in meltwater. When we leave the edge of a glacier and cross onto a snowfield that persists in many years, the number of ice worms plummets from 100-400 worms/square meter to zero within 20 m. This suggests that ice worms do not tend to roam off glaciers. There movement is relatively vertical, so they cannot migrate around a glacier to remain on a snowcovered section. Since their diet is largely algae, which can thrive in snowpack, what happens to this diet when the snowpack is lost and they have to exist on the glacier ice? If this period of existence on the ice is expanded due to earlier snow melt, is this a significant stress? This latter question is what I was pondering while observing and filming the ice worms on the surface of Sholes Glacier on August 11th, 2014. The snowpack had been lost and yet there was still at least 7 weeks left in the melt season. The snowpack had been lost in 2013 in early August as well. In 2014 monitoring the ice worm population in the same location as every year, the numbers were the lowest we had seen since 2005 also a low snowpack year following a low snowpack year. The population did rebound in 2007 and 2008 with better snowpack. The data does not answer the question, but is suggestive that repeated low snowpack occurring with significant periods left in the melts season may reduce glacier ice worm populations. You may think why does that matter, but in fact on Sholes Glacier the population of glacier ice worms based on our surveys is approximately 200 million. The process of answering this question will continue.
Ice worm film location 8/11/14.
Landsat image of Sholes Glacier 9/12/2013 with the red dots indicating the snowline separating blue ice from snowcover.
Landsat image of Sholes Glacier 9/15/2014 with the red dots indicating the snowline separating blue ice from snowcover.
This is the best video of ice worm motion that I have captured.
Boston Glacier is the largest glacier in the North Cascades with an area of just over 6 square kilometers. The is a steep, wide slope glacier that currently lacks any type of main terminus tongue or valley section. The glacier is extraordinarily heavily crevassed this is due a steep slope, a smooth hard bedrock basal slope and high accumulation rates. In 1986 the first time I stepped onto this glacier is was immediately apparent that traversing the glacier in any direction was not wise and this glacier would be a poor choice for detailed observations. Richard Hubley, UWashington in the 1950’s chronicled the beginning of an advance for the glacier. A series of aerial photographs of this glacier from 1960 to 1979 by Austin Post, USGS indicate the glacier remained in an advanced position. By 1998 Granshaw and Fountain (2006) noted retreat and glacier area loss had begun. Here we examine a series of images from 1955-2014 to identify the changes in the terminus and crevassing on this glacier.
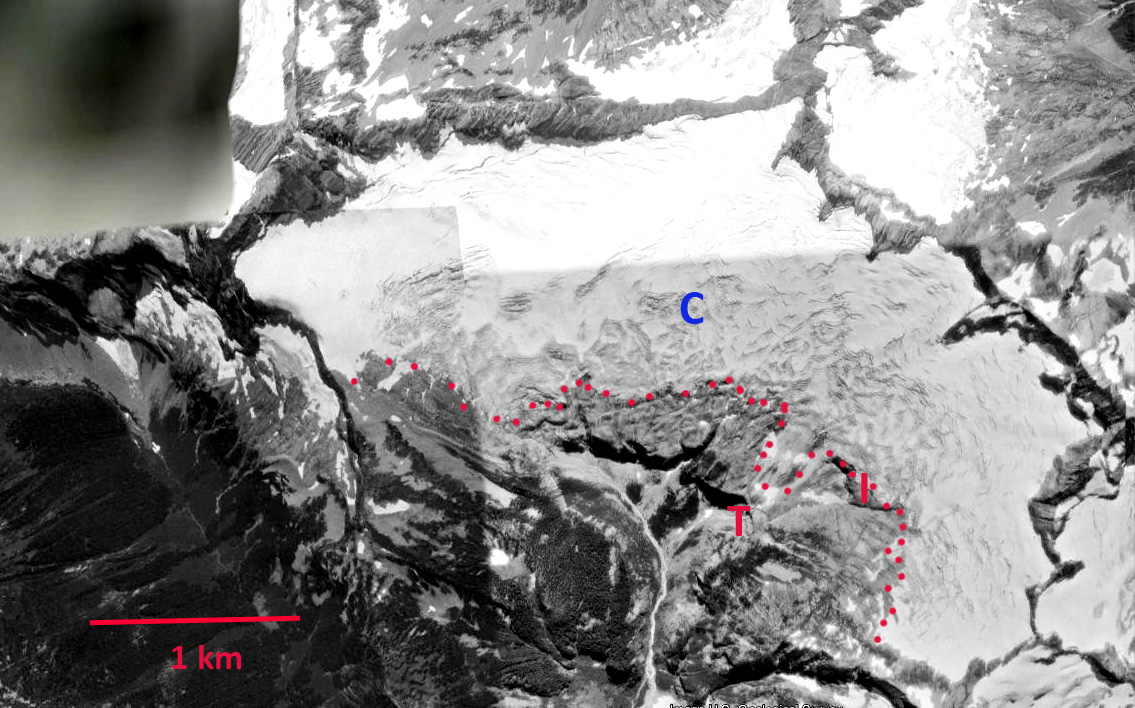
In each image C,I and T are in the same location. In 1955 the Richard Hubley image indicates the main terminus has advanced down a steep bedrock step to a small basin, I indicates the west side of the step. In 1972 an Austin Post image indicates the main terminus has descended a second step to end at a small lake basin (T). The crevasse density in a grid of 40,000 square meters around point C indicate that 55% of the glacier surface is a crevasse feature. A 1998 Google Earth image indicates the terminus has retreated from the small lake basin (T) but is still below the steep bedrock step (I), a 200-250 m retreat. At Point C crevassing has been reduced to 30% of the surface area.
1955 Richard Hubley image
1972 Austin Post image
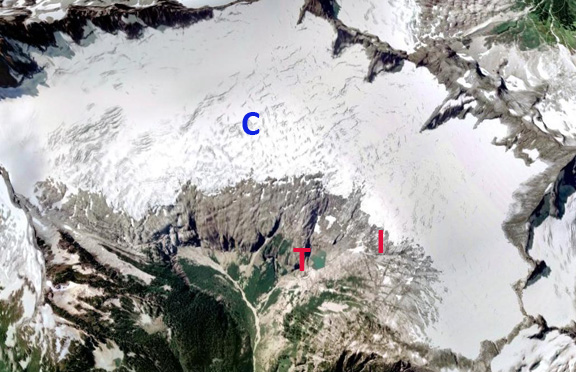
1998 Google Earth image
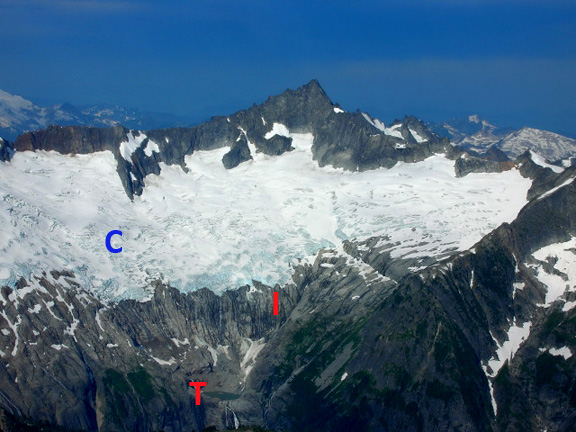
By 2005 and 2006 the glacier has retreated from the basin below the steep bedrock step a retreat of 650 m since 1972, and 400 m since 1998. Crevassing at Point C is nw 25% of the surface area. This indicates crevassing has decreased by 50% since 1972. This glacier remains large and vigorous in its flow. The decrease in crevassing indicates some deceleration. The crevasse pattern is caused by the thin ice, for the size of the glacier, passing over small bedrock knobs. The red arrows in the last image indicate the deglaciated bedrock knobs and the blue arrows the pattern of crevassing going over the knob. This is a 2009 picture, the terminus is quite thin indicating retreat is ongoing. The retreat of this glacier follows that of Quien Sabe Glacier over the ridge to the south and McAllister Glacier 10 km to the west. The glacier is like all 47 glaciers we have observed in the North Cascades retreating.
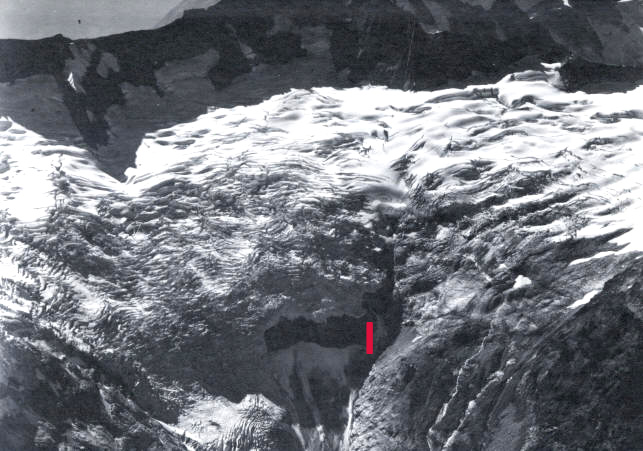
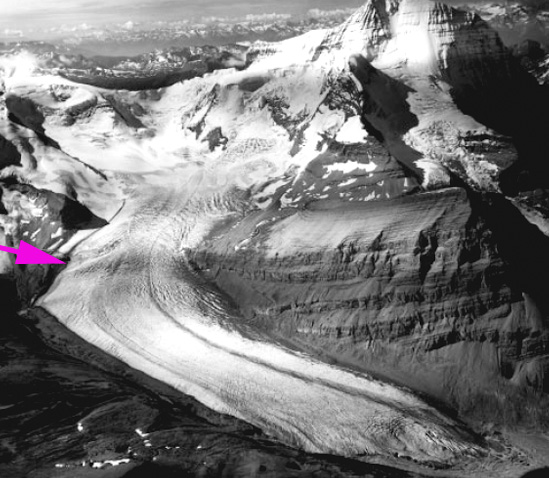
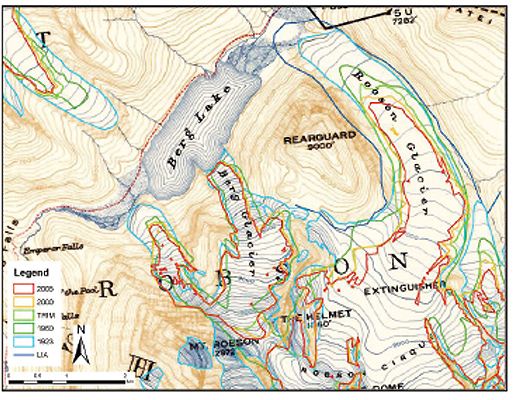
Robson Glacier is the largest glacier on the highest mountain in the Canadian Rockies. The glacier begins at 3200 m and drains northeast from the summit ending in a proglacial lake at 1720 m. The glaciers upper west side has heavy avalanche accumulation from Mount Robson’s upper slopes, note the 1964 photograph from the legendary USGS glacier guru Austin Post. The history of this glacier has been examined using tree rings and lichenometry. Heusser (1954) observed that the glacier reached its Little Ice Age Maximum arond 1780 and had retreated at a rate of 2 m/year from then until 1908 and at a rate of 16 m/year from 1908-1953. The terminus history up to 2006 is summarized in a map from Roger Wheate (UNBC) and Laura Thomson that indicates, a minor retreat of 300 m from 1850 to 1922, a rapid retreat from 1922-1950 of 1200 m, a readvance from 150 to the 1980’s of 300 m and a resumed retreat of 500 m from the 1980s to 2005. Here we examine satellite imagery from 1987-2014 to see more recent changes.
Robson map from Wheate (2012)
Austin Post 1964 Photograph
In each image the red arrow indicates the 1987 terminus position, the yellow arrow the 2013 terminus position and the pink arrow a bedrock step on the east margin of the glacier. In 1987 the proglacial lake at the terminus is 350 m long. The bedrock step on the eastern margin is largely buried under the glacier and the snowline is at 2300 m though the melt season still has six weeks to go. In 1989 the terminus is not quite as wide and the snowline is at 2500 m. By 2002 the glacier has retreated 400 m with the proglacial lake having expanded into a new narrower section. The bedrock bench is more prominent adjacent to the glacier and now extends as a bare rock further into the main glacier. The snowline is at 2400 m. By 2006 the glacier has retreated an additional 100 m and the snowline is at 2500 m. There are two apparent bedrock ribs the upglacier one extends 300 m toward the glacier center from the east margin and the lower rib 150 m. This represents most of the flow from the eastern tributary of the glacier that extends only to 2800 m and has less avalanche contribution. By 2013 the glacier has retreated 700 m since 1987, a rate of 30 m/year. This is a more rapid rate than the retreat observed from 1908-1953.The snowline is just above 2500 m. In 2014 the terminus position is a bit obscured in this September image, the bedrock rib is more prominent than in 2006 and the snowline is again above 2500 m, with three weeks left in the melt season.
It is apparent that a zone of persistent and consistent accumulation remains above 2600 m on Robson Glacier, and that it can survive current climate change. The recent trends of a snowline above 2500 m indicates that retreat will continue in the near future in response to current climate. Both 2013 and 2014 have been warm summers leading to above average melt conditions that should lead to rapid thinning of the lower terminus tongue and rapid retreat in the next several years. Hopefully another satellite image will be obtained to indicate the end of season snowline (ELA). The retreat of the is glacier parallels that of Coleman Glacier just east of Mount Robson, Freshfield Glacier and Columbia Glacier.
1987 Landsat image
Robson Glacier is the largest glacier on the highest mountain in the Canadian Rockies. The glacier begins at 3200 m and drains northeast from the summit ending in a proglacial lake at 1720 m. The glaciers upper west side has heavy avalanche accumulation from Mount Robson’s upper slopes, note the 1964 photograph from the legendary USGS glacier guru Austin Post. The history of this glacier has been examined using tree rings and lichenometry. Heusser (1954) observed that the glacier reached its Little Ice Age Maximum arond 1780 and had retreated at a rate of 2 m/year from then until 1908 and at a rate of 16 m/year from 1908-1953. The terminus history up to 2006 is summarized in a map from Roger Wheate (UNBC)and Laura Thomson that indicates, a minor retreat of 300 m from 1850 to 1922, a rapid retreat from 1922-1950 of 1200 m, a readvance from 150 to the 1980’s of 300 m and a resumed retreat of 500 m from the 1980s to 2005. Here we examine satellite imagery from 1987-2014 to see more recent changes.
Robson map from Wheate (2012)
Austin Post 1964 Photograph
In each image the red arrow indicates the 1987 terminus position, the yellow arrow the 2013 terminus position and the pink arrow a bedrock step on the east margin of the glacier. In 1987 the proglacial lake at the terminus is 350 m long. The bedrock step on the eastern margin is largely buried under the glacier and the snowline is at 2300 m though the melt season still has six weeks to go. In 1989 the terminus is not quite as wide and the snowline is at 2500 m. By 2002 the glacier has retreated 400 m with the proglacial lake having expanded into a new narrower section. The bedrock bench is more prominent adjacent to the glacier and now extends as a bare rock further into the main glacier. The snowline is at 2400 m. By 2006 the glacier has retreated an additional 100 m and the snowline is at 2500 m. There are two apparent bedrock ribs the upglacier one extends 300 m toward the glacier center from the east margin and the lower rib 150 m. This represents most of the flow from the eastern tributary of the glacier that extends only to 2800 m and has less avalanche contribution. By 2013 the glacier has retreated 700 m since 1987, a rate of 30 m/year. This is a more rapid rate than the retreat observed from 1908-1953.The snowline is just above 2500 m. In 2014 the terminus position is a bit obscured in this September image, the bedrock rib is more prominent than in 2006 and the snowline is again above 2500 m, with three weeks left in the melt season.
It is apparent that a zone of persistent and consistent accumulation remains above 2600 m on Robson Glacier, and that it can survive current climate change. The recent trends of a snowline above 2500 m indicates that retreat will continue in the near future in response to current climate. Both 2013 and 2014 have been warm summers leading to above average melt conditions that should lead to rapid thinning of the lower terminus tongue and rapid retreat in the next several years. Hopefully another satellite image will be obtained to indicate the end of season snowline (ELA). The retreat of the is glacier parallels that of Coleman Glacier just east of Mount Robson, Freshfield Glacier and Columbia Glacier.
1987 Landsat image
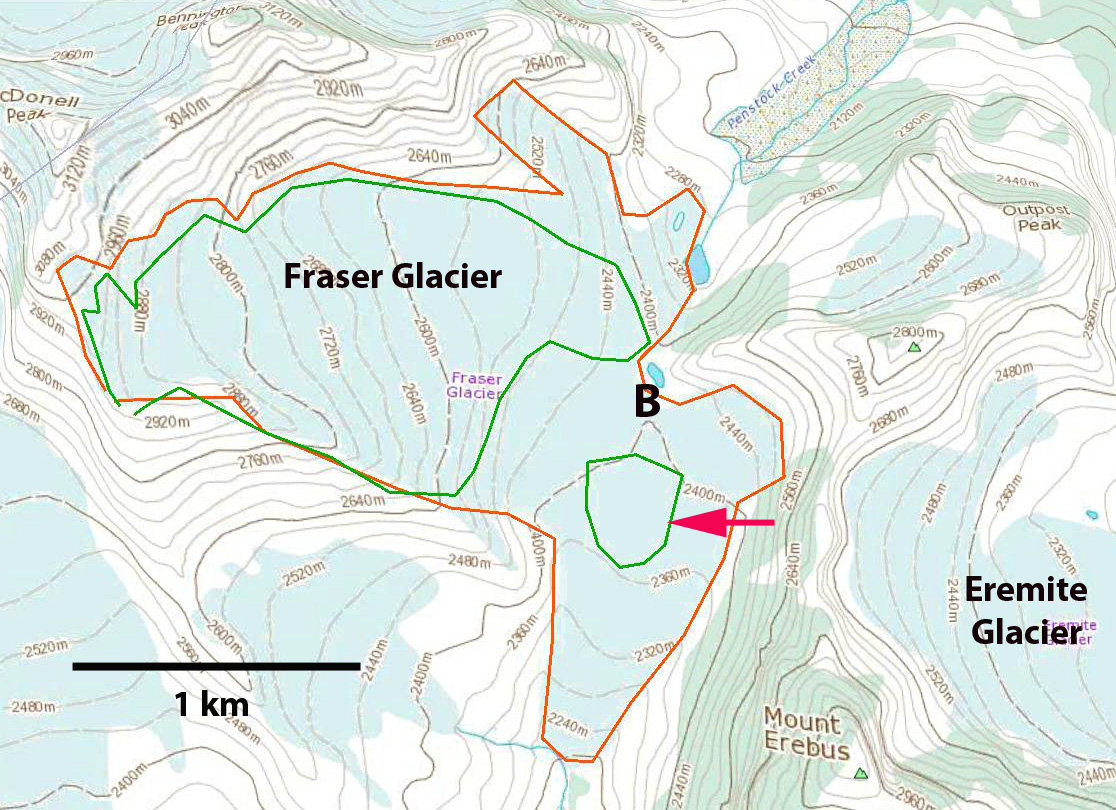
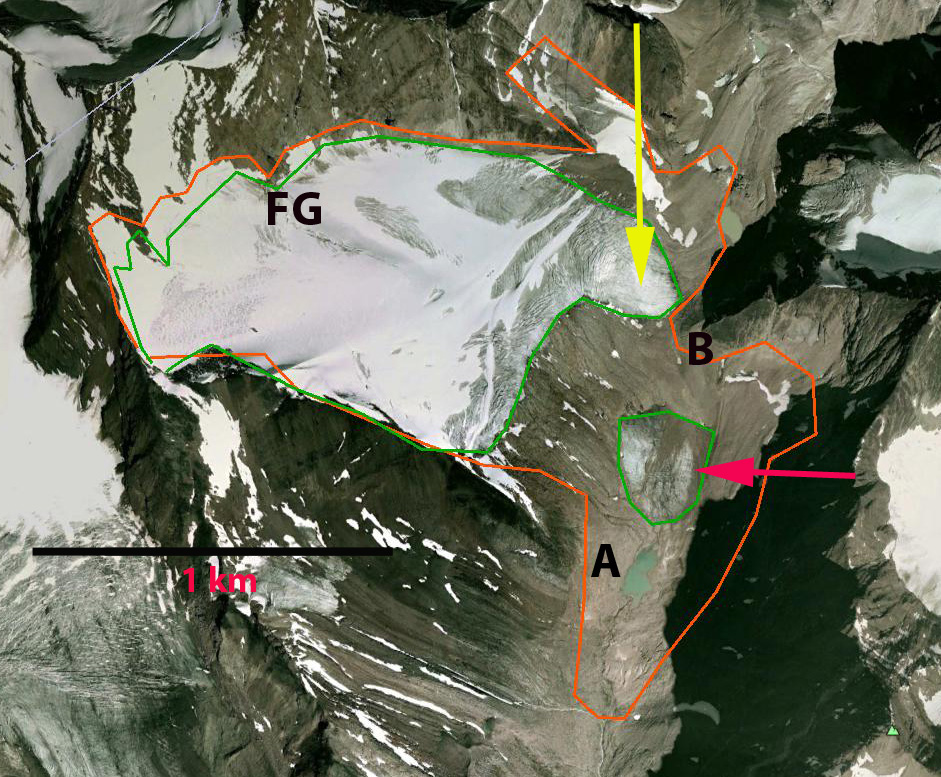
Fraser Glacier, Alberta on the southern flank of Bennington Peak in Jasper National Park drains into the Athabasca River not the Fraser River. The glacier was reported in the USGS satellite image atlas as having a length of 3.5 km in the 1970’s. In Canadian Topographic maps the glacier extends for over 3.0 km from 2900 m to 2200 m. Today the glacier is barely half that length. The glacier first separated and then the lower section has now melted away. Here we use Google Earth and Landsat imagery from 1996 to 2014 to identify the changes. Bolch et al (2010) noted that from 1985-200 Alberta Glaciers lost 25% of their area. Tennant et al (2012) noted that from 1919-2006 the glaciers in the central and southern Canadian Rocky Mountains lost 40% of their area. Of the 523 glaciers they observed 17 disappeared and 124 separated, Fraser Glacier falls into the latter category.
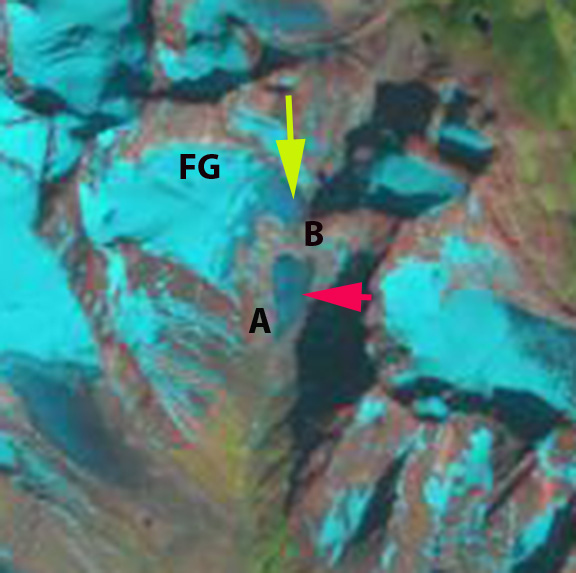
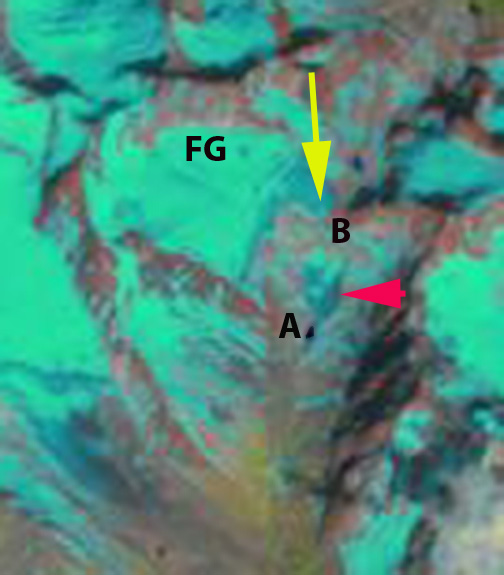
In each image Point A indicates the same location which after 2000 a small lake develops, Point B, is the location where the glacier separated into two parts. The red arrow indicates the lower section and the yellow arrow the position of the upper terminus in 2014. In the map the orange outline is the glacier boundary on the map, while the green line is the 2005 boundary.
By 1999 the glacier has separated into two parts, but no lake exists yet at Point A. By 2002 a small lake is developing at Point A and the separation between the upper and lower glacier has increased. By 2005, a Google Earth image indicates the diminishing lower section of the glacier is 300 m long and less than 200 m wide, separated from the upper glacier by 250 m. By 2013 the lower glacier is no longer evident, there could be a small remnant of debris covered ice, but it is essentially gone. The glacier now is just 1.6 km long having lost half its length from the mapped glacier and more than half since the satellite image analysis of the 1980’s. The upper margins of the glacier have changed little and some snowpack has been retained. This suggests that now with the entire glacier in the upper basin above 2400 m, the retreat should slow down,and that the glacier can survive current climate (Pelto, 2010). The retreat of this glacier is similar to Apex Glacier, Petain Glacier, Coleman Glacier and Mangin Glacier. The retreat fits the pattern noted by Tennant et al (2012), further Jiskoot et al (2009) noted that the glaciers of the nearby Chaba-Clemenceau Icefield are experiencing faster retreat rates in recent years. All of this loss in glacier area of course means less glacier runoff, since the area lost is greater than the increased melt rate from the remaining glacier area in Alberta.
2005 Google Earth image
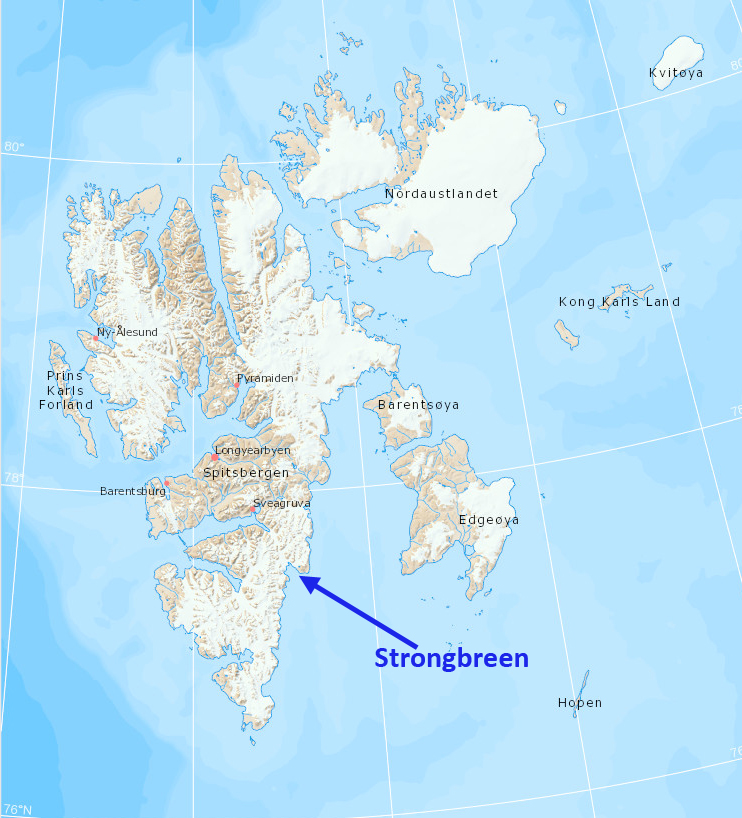
Strongbreen is a glacier in Svalbard on the southern part of Spitsbergen draining east into the Kvalvagen Fjord. Blaszczyk et al’s (2009) analysis identified 163 Svalbard glaciers that are tidewater with the total length calving ice−cliffs at 860 km for the 2001-2006 period. They observed that 14 glaciers had retreated from the ocean to the land over the last 30–40 year period. One glacier they observed having separated from neighboring glaciers was Strongbreen, which they noted was retreating at a rate of approximately 40 m/year since the previous inventory. The glacier had been connected with the Kvalbreen and Perseibreen Glacier. They also identified this as a surging glacier with the last known surge in the 1870’s.
Map from TopoSvalbard
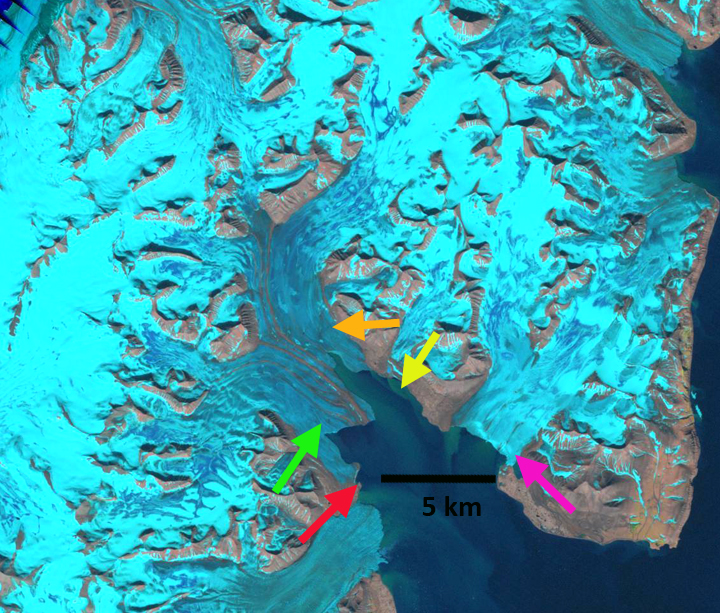
Here we examine Landsat images from 1990. 2002, 2014 and a Digital Globe image from 2010, to identify changes in the glacier over the last 25 years, the colored arrows are in the same location in each image. In 1990 the glacier extended down fjord to the red arrow and yellow arrow on the south side and north side of Kvalvagen respectively. On the southern side the terminus is at Sergievskijfjellet. Kvalbreen at the pink arrow terminates nearly parallel with the northern shore of the fjord. At the blue arrow is the glacier junction with a very small glacial dammed lake between the glacier and the adjacent mountain. By 2002 a small fjord is beginning at the pink arrow where Kvalbreen terminates. Strongbreen on the southern side of the fjord has a much narrower connection to the peninsula at the red arrow and has retreated on the north side from the yellow arrow. By 2014 the glacier has retreated to the green arrow on the southern side of the fjord from the red arrow, a distance of 3.75 km in 24 years. On the northern side the glacier has retreated almost to the orange arrow a similar distance of 3.5-3.8 km. This is a retreat of 150 m/year for Strongbreen quite an acceleration. Kvalvagen has retreated 1 to 1.25 km up the newly developing fjord, a retreat of 1 km in 25 years, 40 m/year. The glacial dammed lake at the blue arrow has expanded. A better view of this lake is in the 2010 image, last one, indicating that the lake now is almost half the tributary glacier width. The expansion of this lake will lead to this tributary having a separate terminus and undermine the stability of the lower section of Strongbreen.
The lower portion of the glacier is largely uncrevassed indicating quite slow velocities. Blaszczyk et al (2009) report a velocity of less than 30 m/year from 2000-2006. The low slope, limited crevassing, expanding supraglacial lake all indicate continued retreat. It then seems likely the glacier will separate into two fjords with a southern and a northern arm. The only thing that could forestall the retreat for a brief period is a surge as happended on nearby Perseibreen in 2000 (Dowdeswell and Benham, 2003). The retreat of this glacier paralells that of other glaciers in southern Svalbard: Vasilievbreen, Olsokbreen, Hornbreen and Hambergbreen.
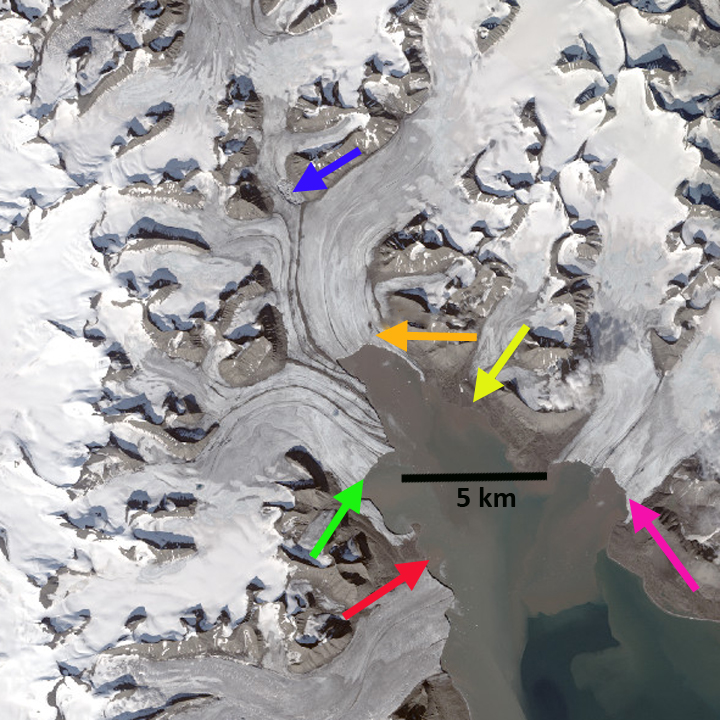
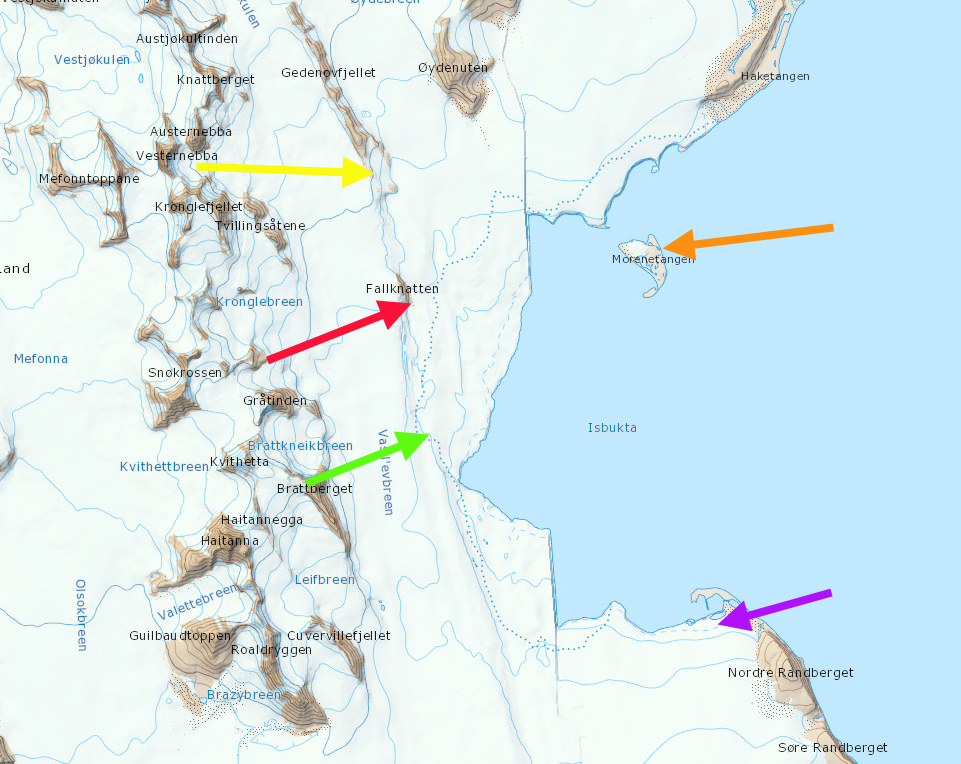
Vasilievbreen is a glacier that terminates on the east coast of the southern island of Svalbard a short distance southeast of Hornsund. In 1990 this glacier had a single continuous terminus margin along the coast. The glacier retreated 50 m/year from 1936 to 1990, as the embayment of Isbukta expanded. The glacier has since separated into distinct termini, on each image colored arrows indicate the same specific location, red arrow a developing island named Fallknatten, yellow arrow the tip of peninsula called Gedenovfjellet, the orange arrow an island called Morenetangen, the green arrow an emerging island not evident on the map and the purple arrow an area of new coastline on the south side of Isbukta. Blaszczyk et al (2009) analysis identified 163 Svalbard glaciers that are tidewater with the total length calving ice−cliffs at 860 km for the 2001-2006 period. They observed that 14 glaciers had retreated from the ocean to the land over the last 30–40 year period. One glacier they observed having separated was Vasilievbreen. A more detailed examination by the same researchers, Blaszczyk, Jania and Kolondra(2013) reported the total area of the glacier cover in Hornsund Fjord from 1899–2010 diminished by approximately 172 km2. The average glacier area retreat increased from a mean of 1.6 square kilometers per year to 3 square kilometers per year since 2000. The Polish Polar Station at Hornsund is an ideal location from which to conduct annual field research on the glacier and arctic environment in the area.
Map from TopoSvalbard
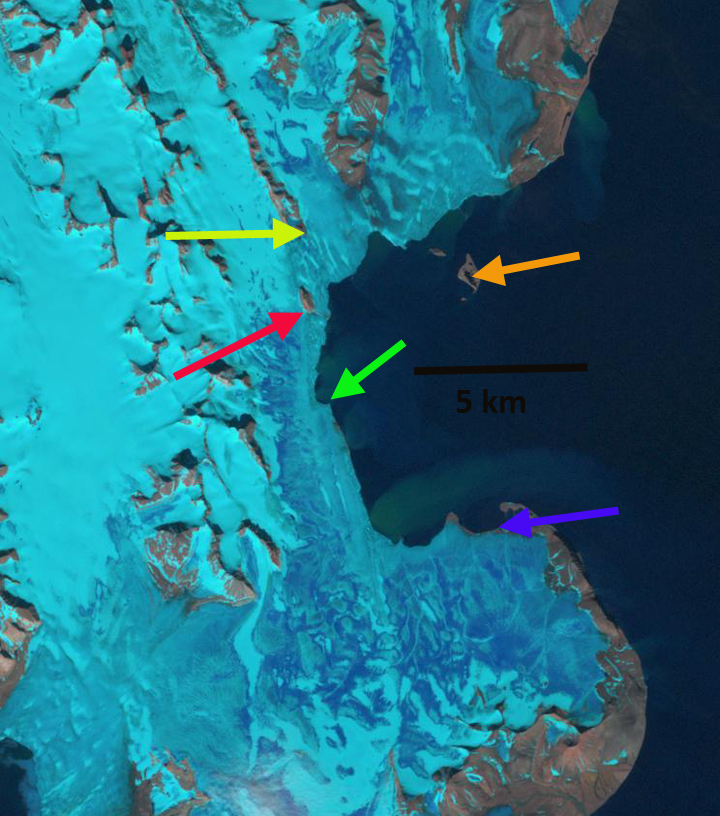
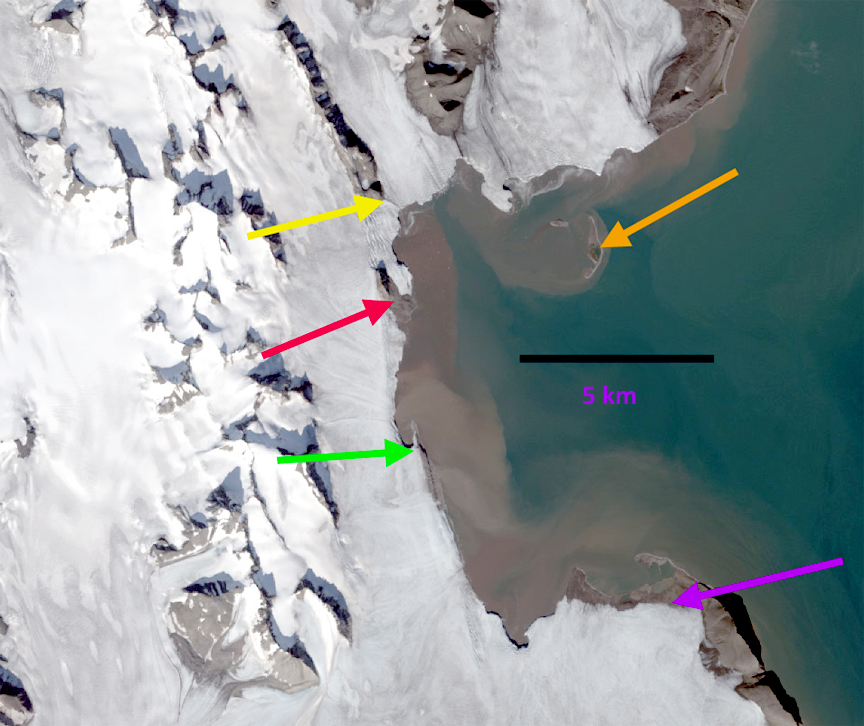
Here we use Landsat imagery to examine the changes in Vasilievebreen from 1990-2014. In 1990 the terminus is continuous. The glacier reaches the coastline at the purple arrow. There is no evident land at the green arrow. The terminus approaches quite close to the island at the orange arrow and there is a nunatak surrounded by ice at the red arrow. By 2002 Vasilievbreen is no longer a continuous terminus. The glacier at the purple arrow has retreated from the sea, exposing a narrow strip of coastline. At the green arrow some bedrock has emerged that will become islands. At the orange arrow the glacier has retreated from the vicinity of the island. By 2014 The strip of land at the purple arrow has expanded to a length of 2km and a width of 300-500 m, this is a retreat of 400 m. At the green arrow a 3 km long rib of bedrock is exposed and the glacier has retreated 500 m since 1990. At the red arrow the nunatak of 1990 is now at the terminus of the glacier and is much larger, a retreat of 750 m. At the yellow arrow the end of a peninsula is now much closer to the ocean, a retreat of 900 m. At the orange arrow this moraine based island has been eroding, but is also much further from the glacier, a retreat of 800 m. The glacier now has five distinct terminus segments that can retreat independently of each other. That this retreat occurred along a front that is 20 km long represents a loss in glacier area of approximately 10 square kilometers. This is more significant than the actual distance of retreat. The snowline on the glacier in 2014 is above 300 m with the melt season still going, this leaves most of the glacier in the melt zone. The retreat and changing nature of this glacier paralells that of other glaciers in southern Svalbard: Nannbreen, Olsokbreen, Hornbreen and Hambergbreen.
1990 Landsat image