Professor of Environmental Science at Nichols College in Massachusetts since 1989. Glaciologist directing the North Cascade Glacier Climate Project since 1984. This project monitors the mass balance and behavior of more glaciers than any other in North America
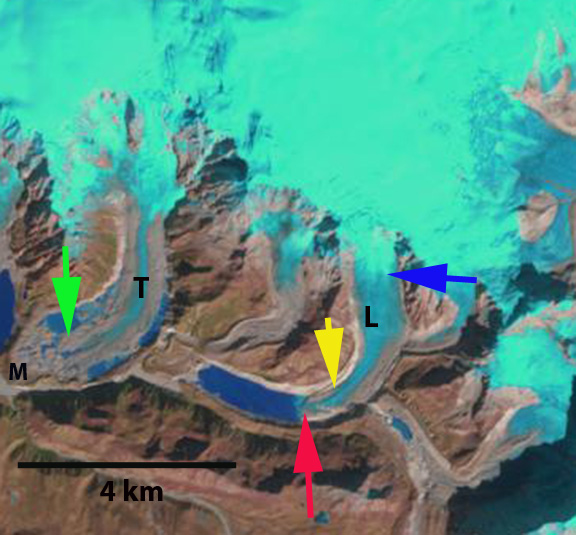
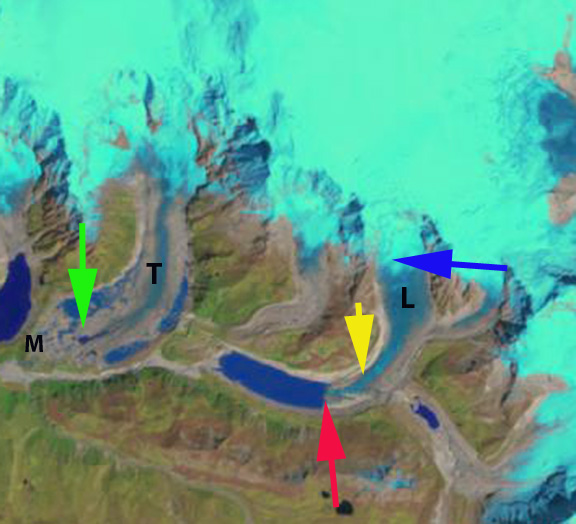
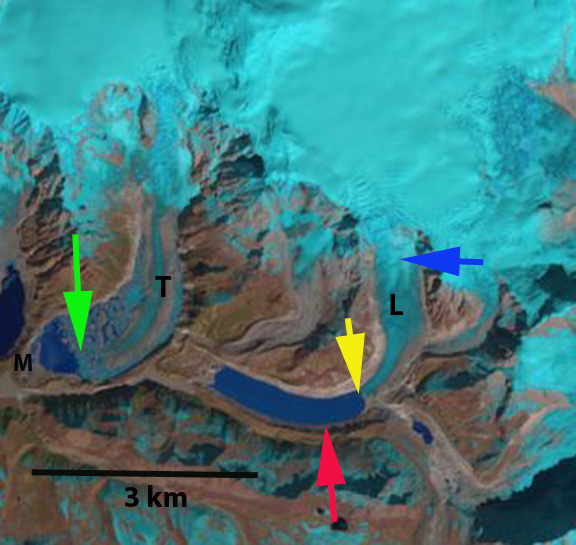
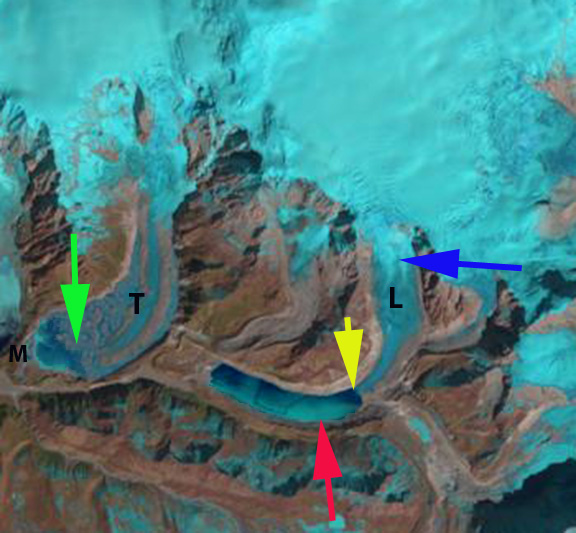
Gauligletscher drains into the Aare River in the Bernese Oberland of Switzlerand. The glacier is in the next valley north or the Oberaar Glacier, that is also retreating and important to hydropower. The Aare River is both has a complex scheme for generating hydropower and a simple system of run of river power stations Alpiq Hydro Aare AG manages the Flumenthal, Ruppoldingen and Gösgen which use the power of the River Aare to generate 90 MW of electricity, without using significant reservoirs or altering flow. Kraftwerke Oberhasli (KWO) from the 1930’s through 1979 built a constellation of power plants, seven hydro dams, a natural lake and around 130 km of water carrying pipes. The total output of the KWO system is 1100 MW, equivalent of a large nuclear plant. This network supplies 7% of the hydropower for Switzerland. The glacier has been in rapid retreat since 2000, with the Swiss Glacier Monitoring Network identifying a retreat of 246 m from 1958-1990, 132 m from 1990-2000 and 864 m from 2000-2013.
KWO hydropower scheme for Aare River.
Google Earth 2007 image showing new lake that the glacier is calving icebergs in.
Here we use Landsat satellite imagery to examine the retreat, the formation of a new lake and the retreat from that lake during the 1990-2013 period. The Glaciers Online site has excellent images of the retreat of this glacier during the lake formation phase from Jürg Alean and Michael Hambrey. In each Landsat image Point A-D are fixed to provide a comparison of terminus change. In 1990 there is no lake at the terminus of the glacier, the terminus has a low slope ending at 2170 m. By 1999 a tiny lake can be seen forming at the northern side of the terminus as the glacier has retreated into a basin. By 2002 there are two small lakes at the north and south corner of the terminus. In 2007 the lake has coalesced into one lake that is 500 m wide and has a length of 600 m on the northern and southern margins and 250 m long in the middle, where ice is still calving into the lake as seen in the Google Earth image above. By 2013 the glacier has retreated out of the 800 m long lake, and terminates 100-150 m from the lake shore. The terminus in 2013 is approaching the base of a steeper slope with more crevassing. This region has thinned both in width, depth and has lost crevassing. The retreat will slow as the glacier retreats up the slope, but is not near an end.
If glaciers did not change in response to climate, we would not have to think about their role in water resources in the watersheds that they reside. During the last two years in an ongoing study with the Nooksack Indian Tribe we have been working on quantifying the role glaciers play in that watershed. Glaciers comprise the headwaters of the Nooksack River and are a critical source of summer discharge and greatly influence summer stream temperatures. There are nine species of salmon in the watershed that the Nooksack Indian Tribe depends on for cultural, subsistence, and economic uses. Climate change is an additional new threat to salmon that has caused and will continue to cause an increase in winter flow, decreased summer baseflow, and increased summer water temperatures.
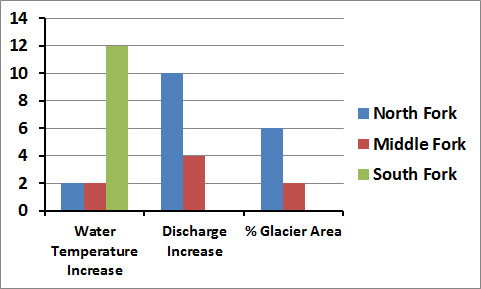
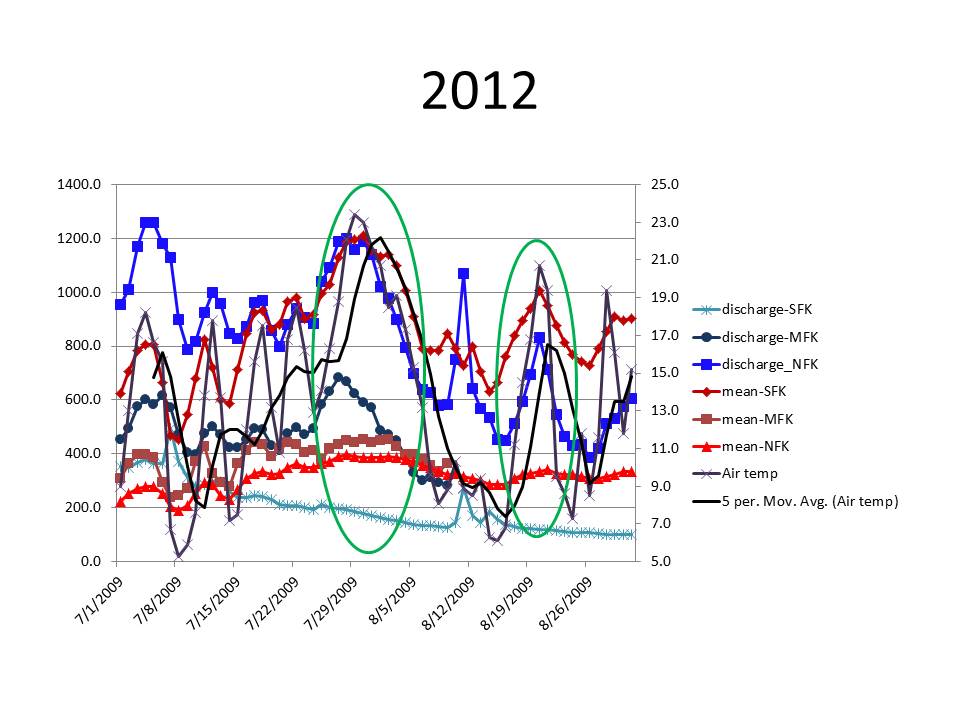
This post will focus on the changing impact of glaciers on streamflow and the evolving water temperature threat. The Nooksack River watershed has three significant watersheds, South Fork, Middle Fork and North Fork. The South Fork has no glaciers, the Middle Fork has four significant glaciers and 2% of the watershed area above the USGS gage is glaciated. The North Fork has 12 significant glaciers that cover 6% of the watershed area above the USGS gage. Here we examine stream discharge and water temperature at USGS gages on each stream to illustrate the different response to 12 warm weather events during the summers of 2009, 2010, 2012 and 2013. During each of these periods we have along with Oliver Grah and Jezra Beaulieu, working for the Nooksack Tribe, have been observing the ablation and runoff directly from the glaciers. The largest area of glaciers are those on Mount Baker, a strato volcano that is the highest mountain in the North Cascades. Pelto and Brown (2012) note that terminus observations on the nine principal Mount Baker glaciers, 1984–2009, indicate retreat ranging from 240 to 520 m, with a mean of 370 m or 14 m/year. Pelto and Brown (2012) observed that this is the result of a sustained mass balance loss averaging -0.5 m/year during the 1990-2010 period. This equates to an 11-m loss in glacier thickness, 12–20% of the entire 1990 volume of glaciers on Mount Baker. This summer we will for the 31st consecutive year be measuring glacier mass balance on Mount Baker.
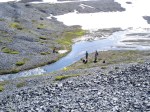
Mazama Glacier headwaters North Fork
Deming Glacier headwaters Middle Fork
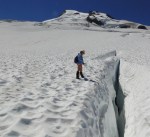
Crevasse examination
Probing snow depth
Outlet of Sholes Glacier, North Fork
Measuring snow depth in crevasse
During each of these events ablation was measured on glaciers in the basin. For stream discharge, a 10% increase is set as the key threshold for significant response to each warm weather event. For the North Fork 10 of 12 warm weather events exceeded the limit, in the Middle Fork 4 of 12 events had a significant response and for the South Fork none of the 12 events led to a 10% flow increase. It is apparent that warm weather events increase glacier melt, thus enhancing flow in the North Fork. In a basin without glacier runoff the hydrologic system consistently experiences reduced discharge.
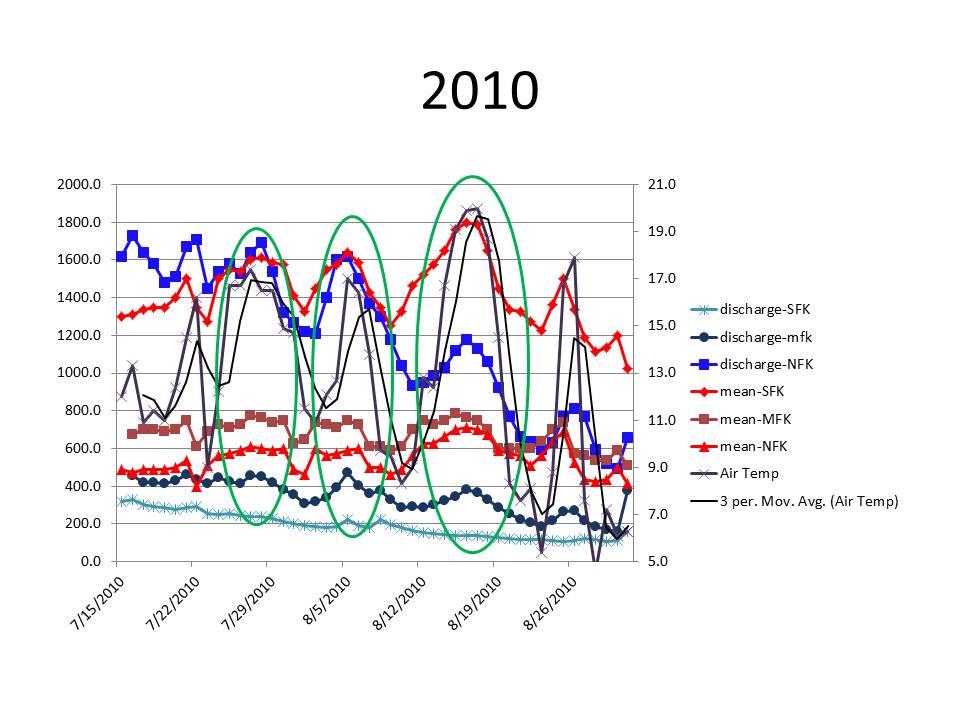
For water temperature, an increase of 2° C is the threshold of significance used for response to warm weather events. In each the North Fork and Middle Fork, 2 of 12 events exceeded this threshold, and for the South Fork 12 of 12 events exceeded this threshold, each event is a green ellipse on the charts below. Warm weather events consistently generate a significant increase in stream water temperature only in the non-glaciated South Fork Basin. During 6 of these 12 warm events, runoff measurements below Sholes Glacier and ablation measurements on Sholes and Easton Glacier indicate daily ablation ranging from 0.05-0.06 meters per day, which for the North Fork currently yields 9.5-11 m3/second. This is 40-50% of the August mean discharge of 24 m3/second, despite glaciers only covering 6% of the watershed. Increased glacier discharge largely offset the impact of increased air temperature on stream water temperature during the warm weather events. In the charts below note the red line with diamond markers that is the South Fork stream temperature and the top brightest blue line that is North Fork discharge and what happens during the warm events, green ellipses. Also note the South Fork discharge bottom blue line does not respond nor does the North Fork stream temperature red line with triangles.
As the glaciers continue to retreat the North Fork will trend first toward the more limited impact of the Middle Fork and then the highly sensitive South Fork where warm weather leads to declining streamflow and warming temperatures. This will lead to a situation similar to the Skykomish River where the number of low flow days has sharply increased. The retreating glaciers include the Sholes, Roosevelt,Deming and Mazama.
Number of the 12 warm weather events with increased discharge, increased water temperature and the percent of glaciation in each basin
Streamflow and water temperature in the Nooksack in Summer 2009
Streamflow and water temperature in the Nooksack in Summer 2010
Streamflow and water temperature in the Nooksack in Summer 2012
Streamflow and water temperature in the Nooksack in Summer 2013
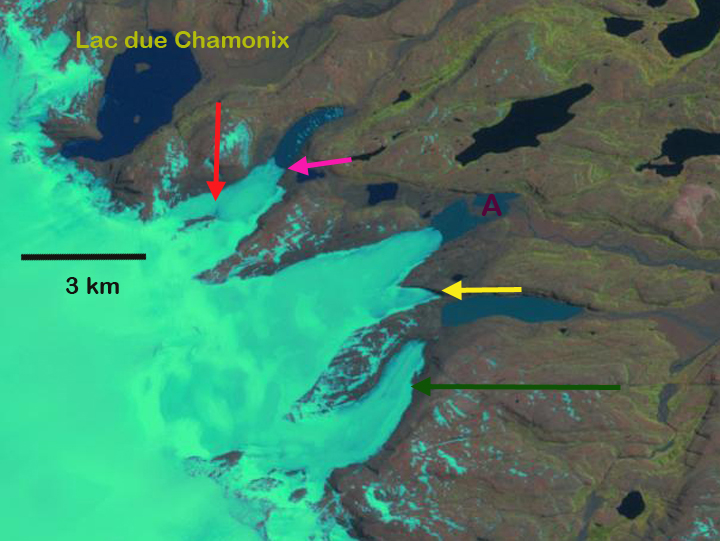
On the east side of the Cook Ice Cap on Kerguelen Island a series of outlet glaciers have retreated expanding and forming a new group of lakes, red arrow. This area is just south of Lac du Chamonix which has existed. Here we examine the changes from 2001-2014 along using Landsat imagery. This is a retreat examined by Berthier et al (2009), and exemplified by the retreat of Ampere Glacier and Aggasiz Glacier from the same ice cap.
In 2001 at the red arrow is the north tributary of a glacier ending in the northernmost lake at the pink arrow. In the second lake is an island, marked with point A, this glacier has a secondary terminus ending at the yellow arrow. The southernmost glacier examined at the green arrow has retreated from one lake and does not end in a lake. By 2011 the northern tributary is starting to separate losing its connection with the Cook Ice cap, red arrow and retreating from the pink arrow. The distance from the island for the middle glacier has increased. A lake is forming at the yellow arrow. For the third glacier a lake has formed at the green arrow. The 2013 Landsat image still has snowcover obscuring the glacier boundaries. In January 2014, it is evident that at the red arrow the northern tributary has lost all connection with the Cook Ice Cap. The main terminus has retreated 700 m, expanding the lake it terminates in. With the loss of the northern tributary the retreat will continue. The distance from the island at Point A to the terminus of the middle glacier has increased 900 m indicating the retreat since 2001. The glacier is nearly at the western end of the lake it terminates in. At the yellow arrow the new lake is now 900 m long indicating a retreat of slightly less than this. The green arrow marks the 2013 terminus in each image of the southern of the three glaciers. This glacier has retreated 800-900 m leading to the continued expansion of a new lake. In just a decade we see the formation of two new lakes and the expansion of two others at the terminus of the three eastern outlet glaciers of Cook Ice Cap.
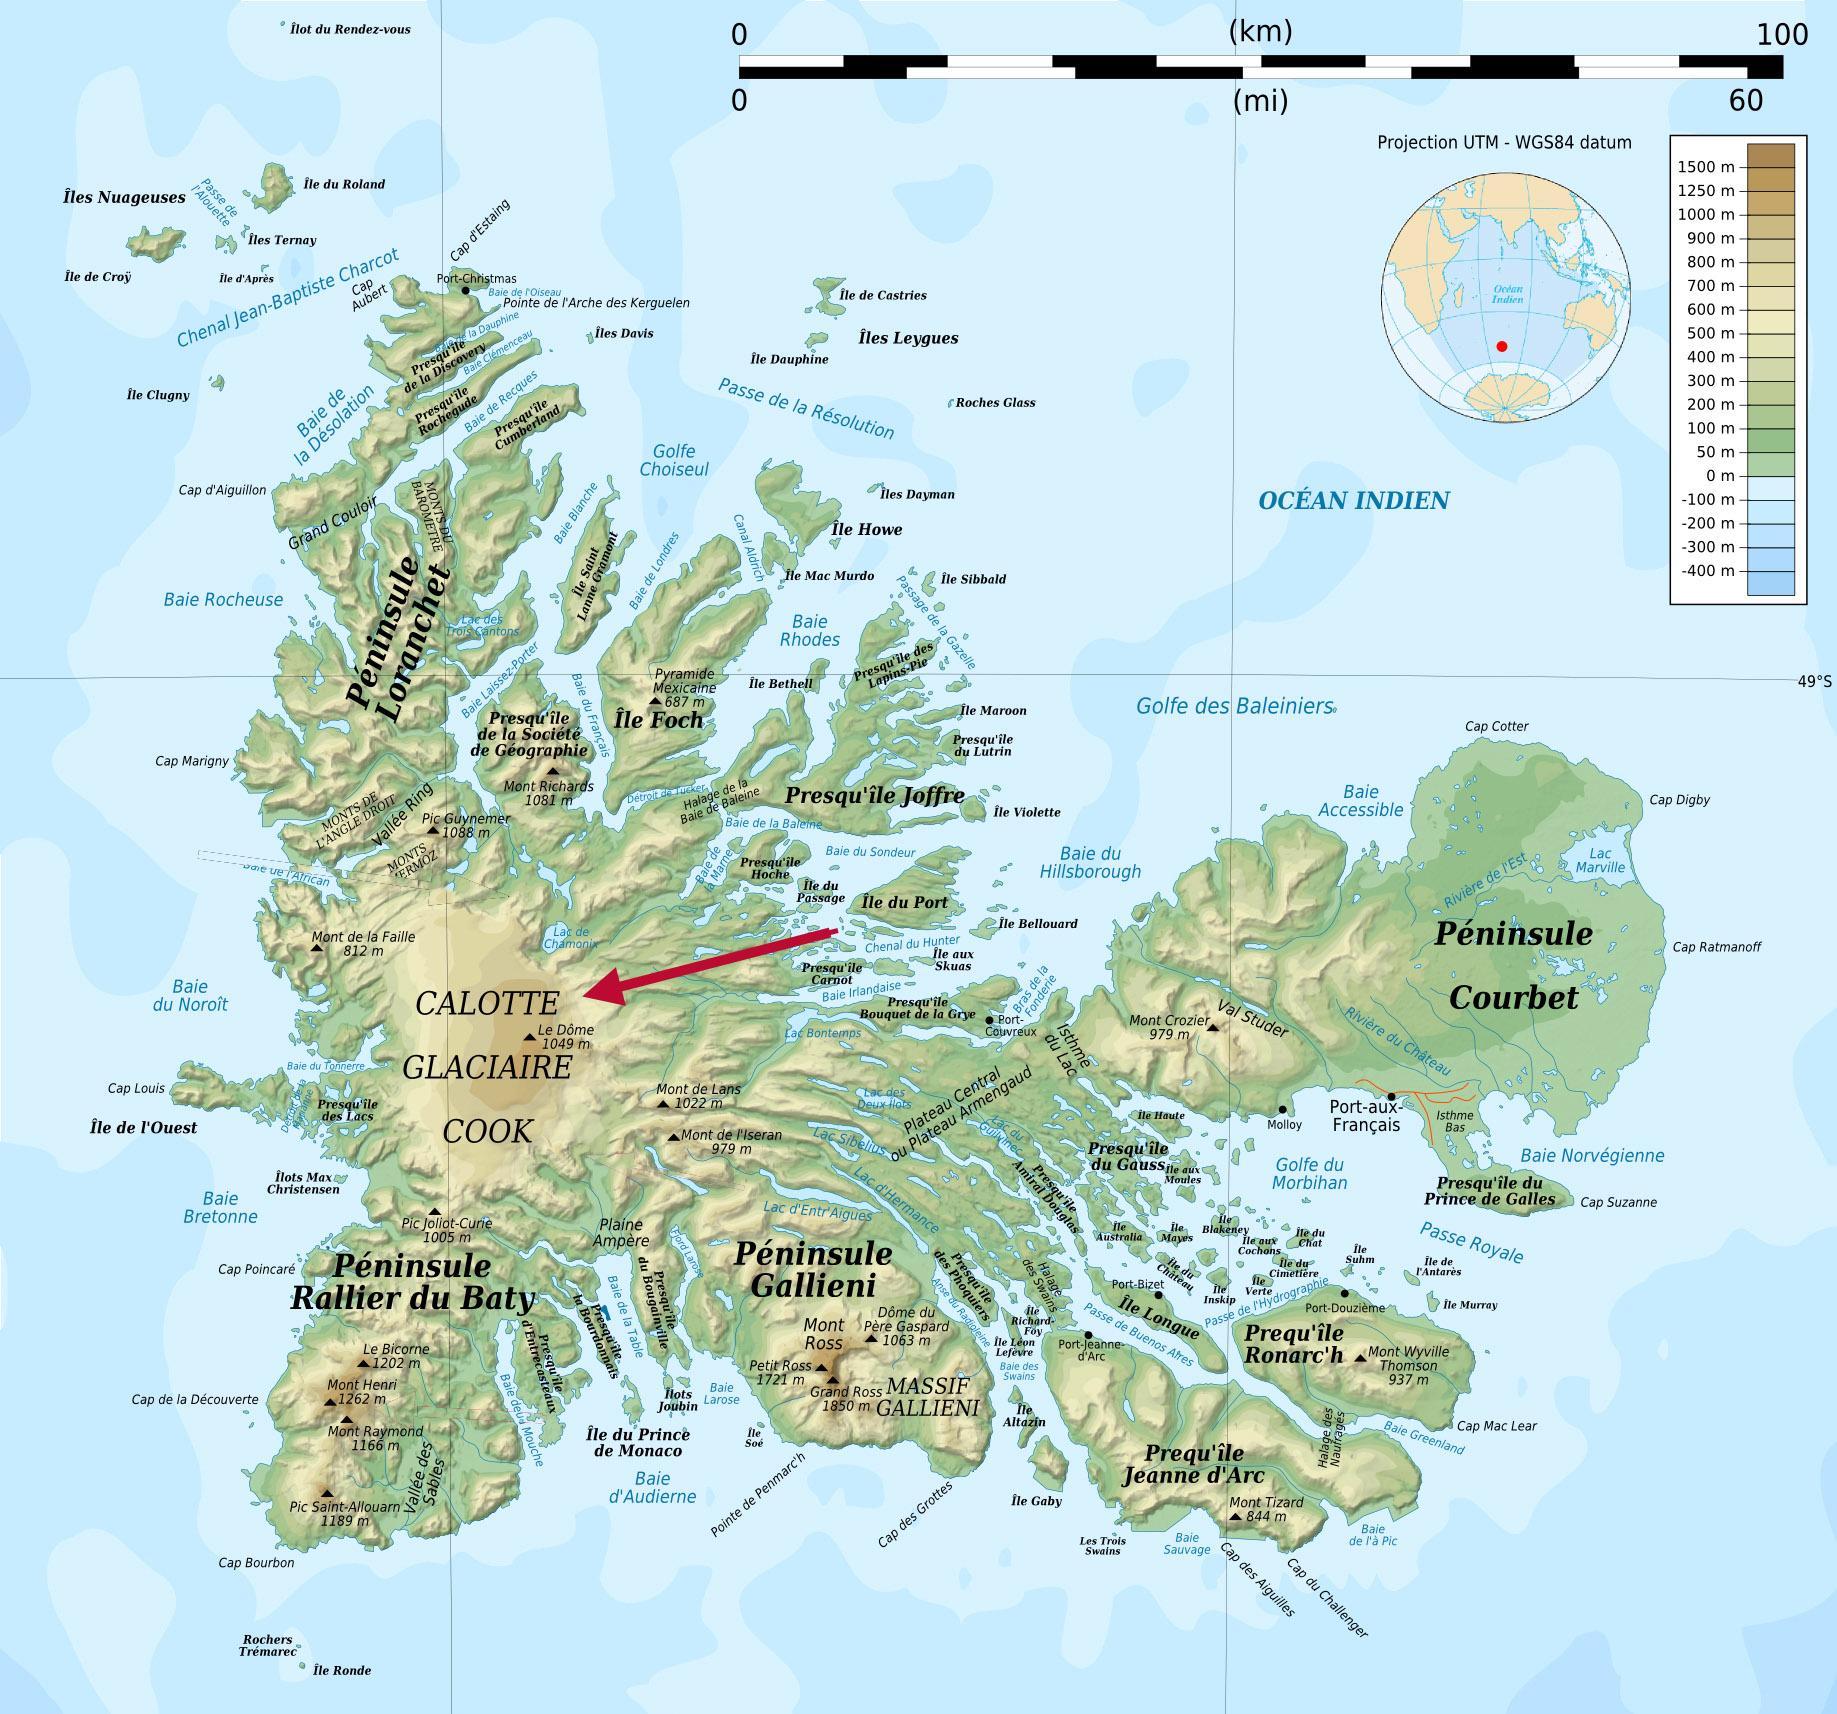
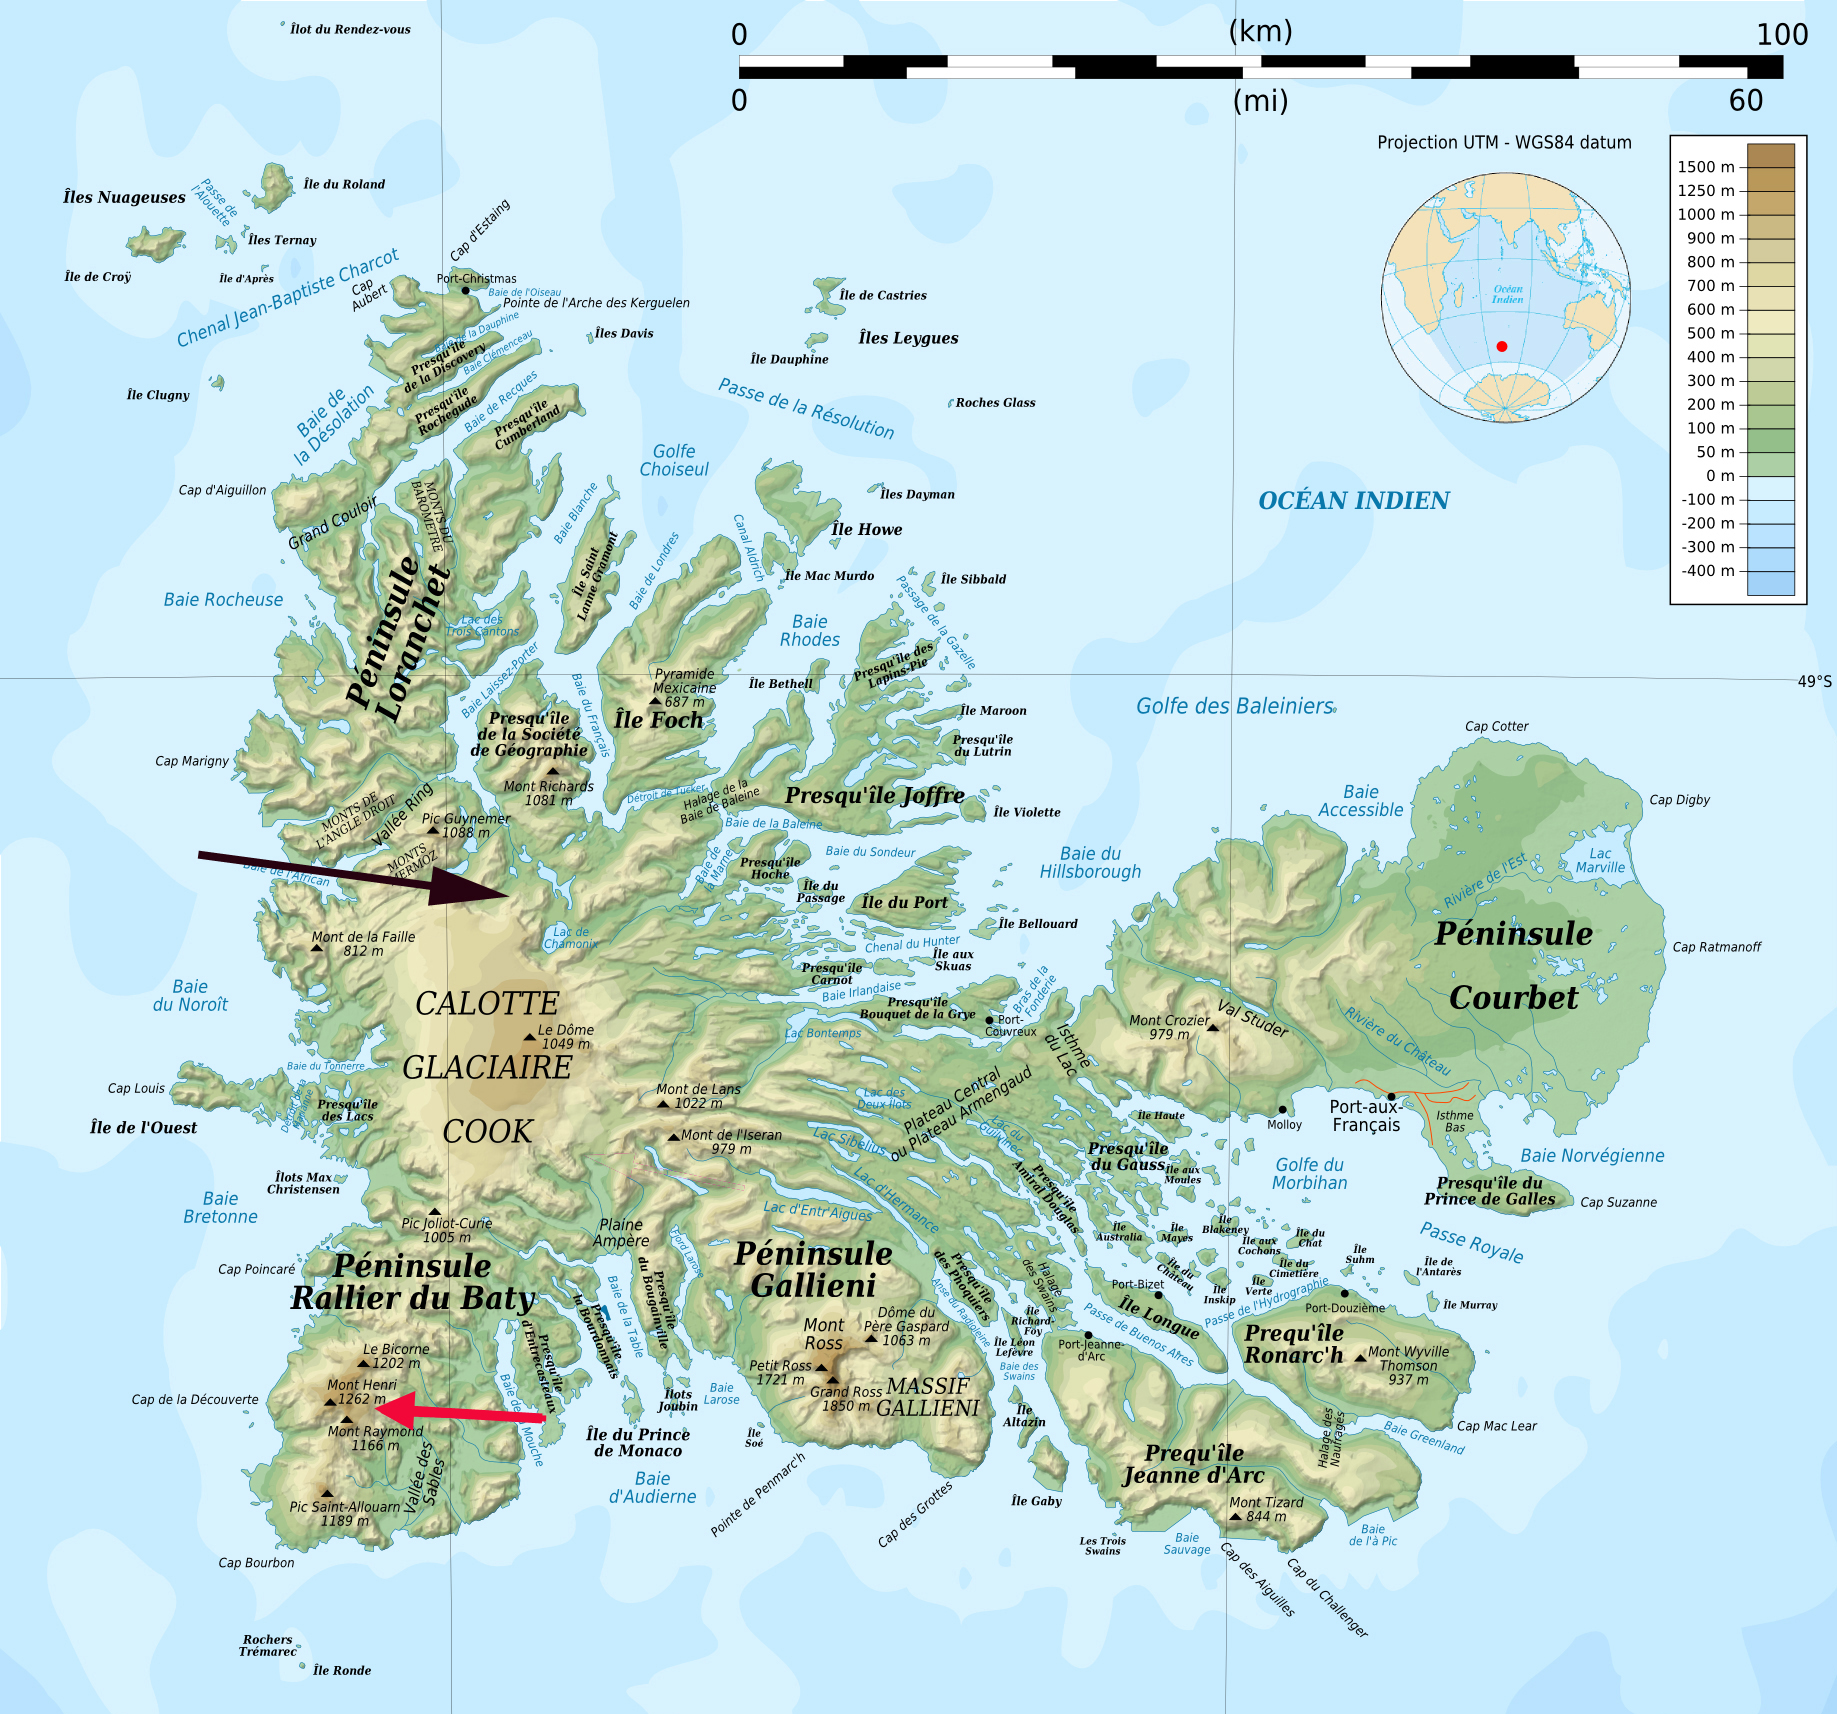
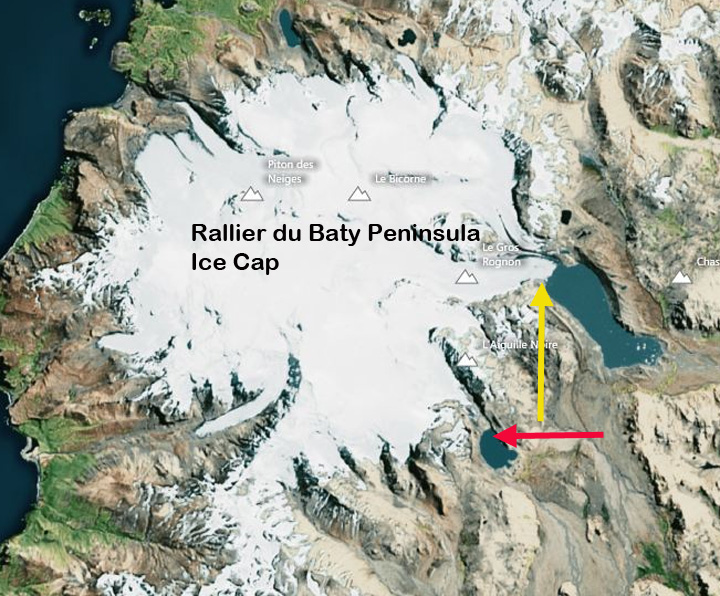
Kerguelen Island sits alone isolated at the edge of the furious fifties in the southern Indian Ocean. The island features numerous glaciers, the largest being the Cook Ice Cap at 400 square kilometers. Here we focus on the Arago Glacier and an adjacent glacier to the south on an icecap on the Raillier du Bay Peninsula Ice Cap using satellite imagery from 2001-2011. Arago Glacier descends east from the ice cap currently ending in a proglacial lake.
Kerguelen Island Map
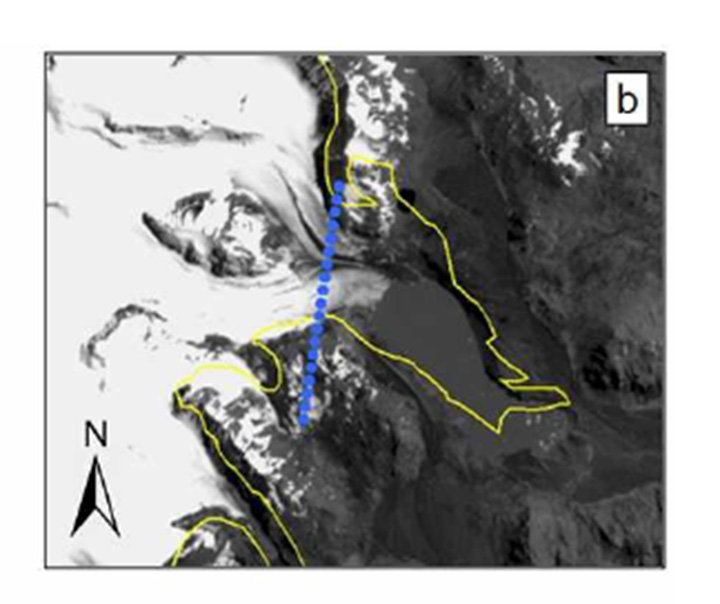
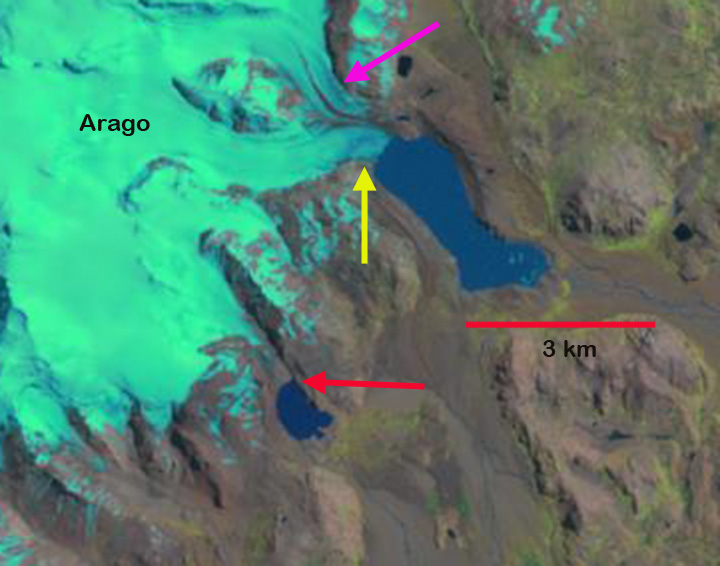
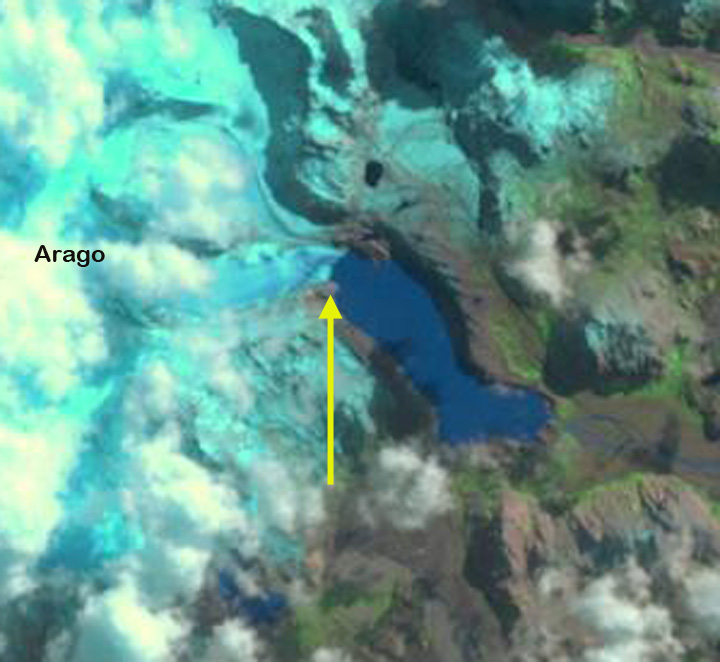
Rallier du Baty Peninsula Google Earth image Berthier et al (2009)note that this glacier had retreated 3 km from 1964-2001. In 1964 the glacier filled the lake basin, yellow line in first figure below. They had a single profile across the glacier shortly above the terminus that indicated 80 km of thinning from 1964-2000 and 30 m from 2000-2005. The profile is the blue dotted line from their paper in the first figure below. In 2001 Arago Glacier terminated at the tip of a peninsula, yellow arrow. The Arago Glacier is joined just above the terminus by a tributary from the north, which has a substantial width in 2001 at the pink arrow. The glacier to its south ended at the northern end of a lake, red arrow. By 2006 Arago Glacier has retreated from the peninsula. Cloud cover obscures the glacier to the south. By 2011 Arago Glacier has retreated from the peninsula, 300-400 m since 2001, expanding the proglacial lake. The glacier tributary at the pink arrow width has declined substantially. This is indicative of a thinning glacier as well. The contribution of this tributary to the main terminus is quite limited by 2011. The glacier to the south at the red arrow has also retreated 300-400 m, leading to lake expansion there. This island is notoriously cloud covered, and I have not located an image with a clear view of the region since 2011, when I do the post will be updated. The retreat of Arago Glacier follows the pattern of retreat of the glaciers of other glaciers on the island including Ampere Glacier and the northern outlet of the Cook Island Ice Cap
Figure 8 from Berthier et al (2009)
Landsat image in 2001
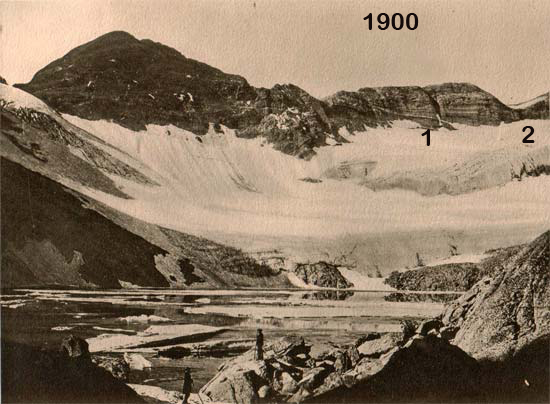
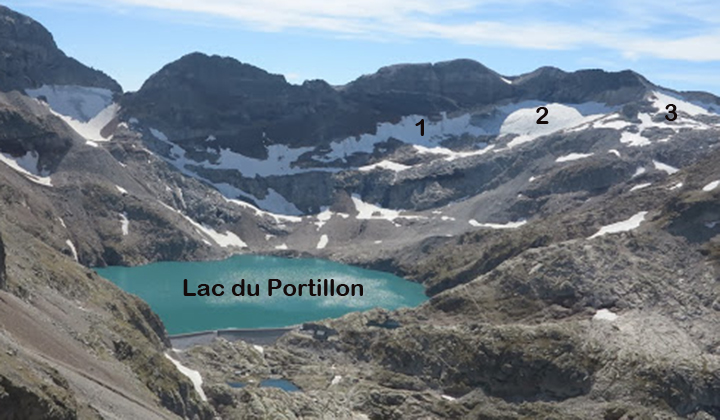
Portillon Glacier is in the Luchon-Bagneres region of the French Pyrenees, just north of the border with Spain. This currently small, and becoming smaller glacier drains into Lac du Portillon, which has a dam impounding it for hydroelectric generation. Like the nearby Aneto Glacier, Portillon Glacier has been thinning, retreating and separating. First a comparison of photographs from 1900 and 2013. In 1900 the glacier fills most of the cirque and nearly reaches the shore of the lake. The lake level is lower at this time also. By 2013 the glacier occupies a few small niches near the head of the cirque.
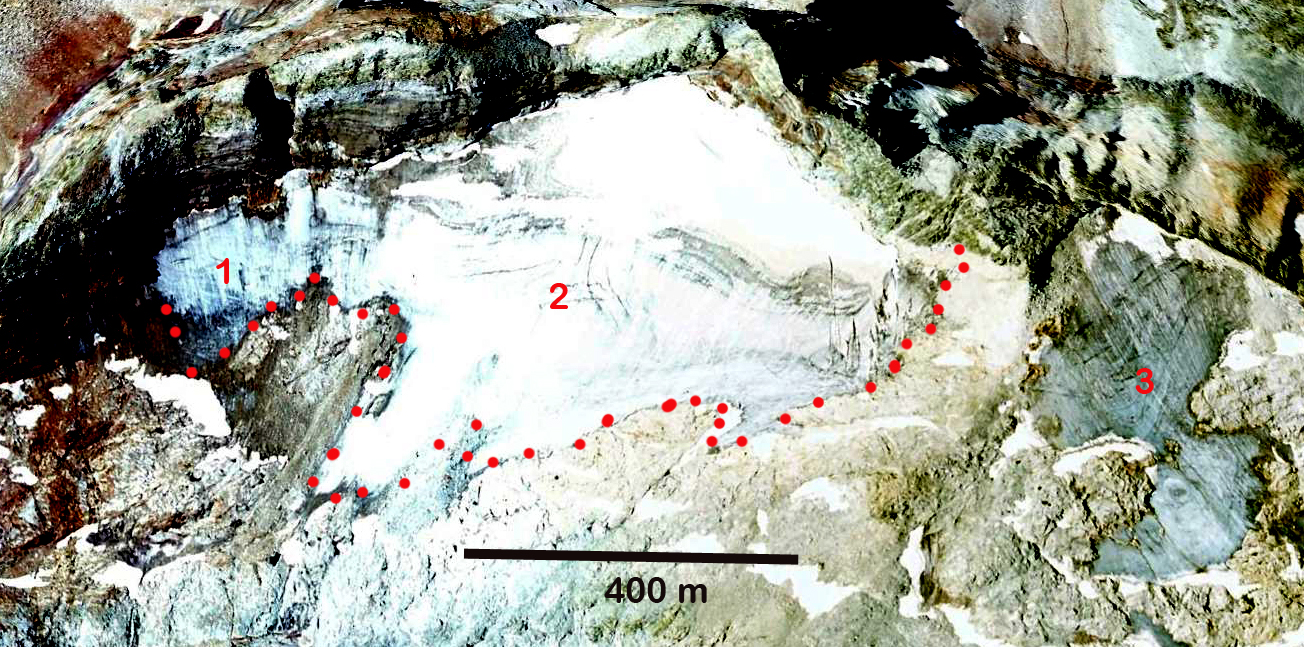
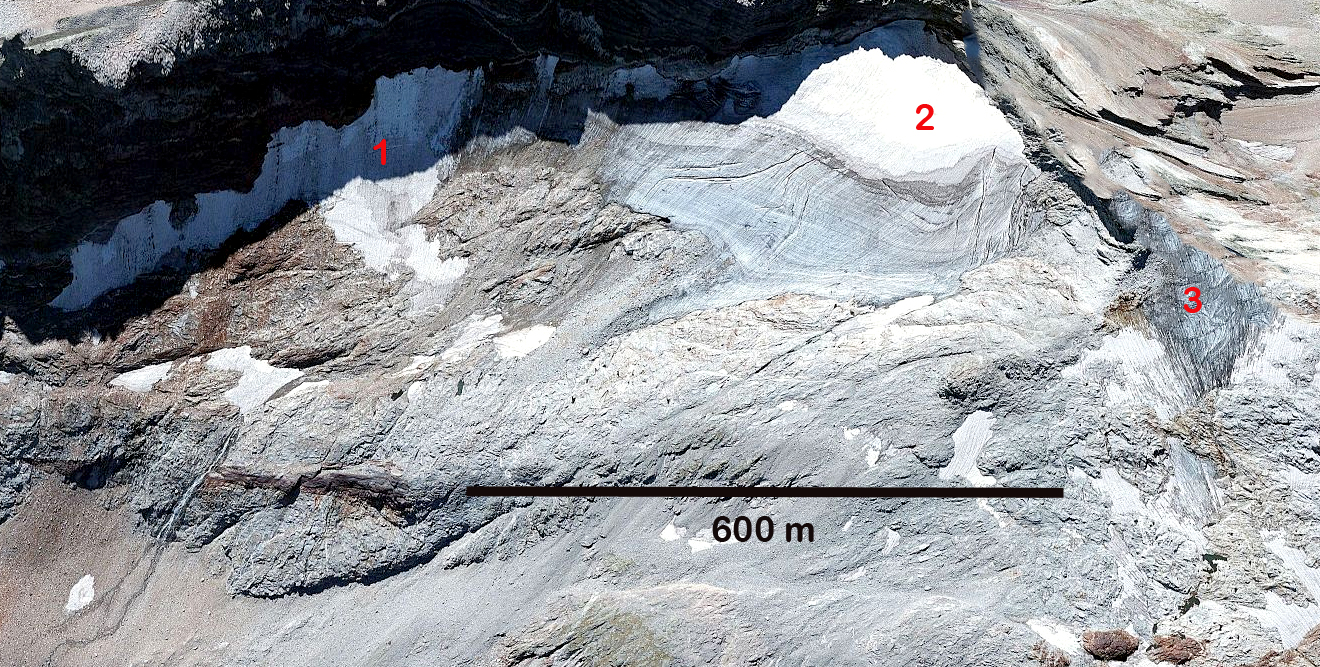
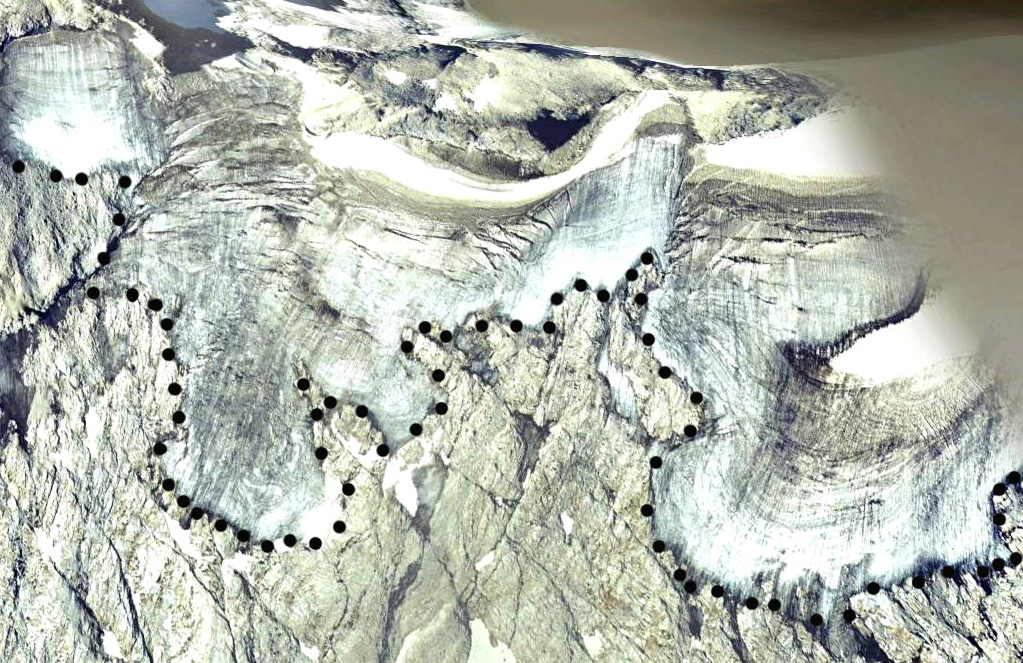
By 2006 Google Earth imagery indicates a glacier with an area of 0.12 square kilometers, red dots indicate the terminus of the glacier. Section 3 of the glacier has separated from the main section, 2. Section 1 is a narrow avalanche fed fringe beneath the cliffs. This section is too steep to retain good snow. In the 2008 image The glacier also is notably thin with few crevasses, and several bedrock outcrops amidst the thinning ice. Both the 2006 and 2008 image indicate the lack of snowcover on the glacier. This has exposed up to 75 annual layers in a closeup transect from head to terminus of the glacier. There are only a few crevasses on this relatively steep glacier, indicating the lack of movement, which can only come from thin ice on a steep slope.
The lack of persistent snowcover at the end of the melt season indicates a glacier,, like the Aneto and Maladeta Glacier, that will not survive current climate (Pelto, 2010). Its area is much less than Aneto Glacier, and it will disappear sooner. As SOER (2010) indicates more than 80% of the area of glaciers in the Pyrenees has been lost since the start of the 20th century. The color of Lac du Portillon and the loss of glacier in the basin reminds me of the Milk Lake Glacier, Washington that I watched disappear recently.
Google Earth image
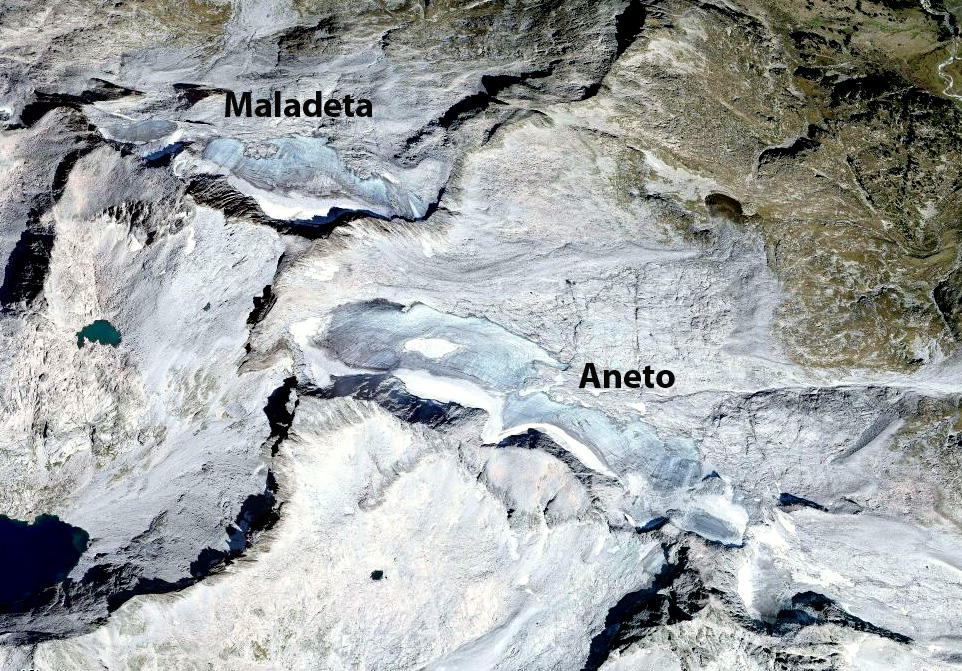
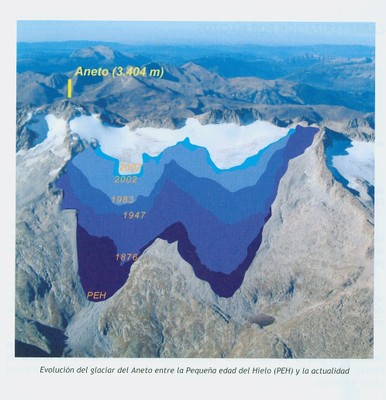
Aneto Glacier in the Pyrenees of Spain is listed as its largest glacier in a 1984 inventory. In 1984 the glacier had an area of 1.32 square kilometers and a length of 1.6 km (Serrat and Ventura, 2005). The glacier is located on the northeast side of Aneto Peak. The glacier is just a few kilometers from the rapidly retreating Maladeta Glacier. SOER (2010) indicate that more than 80% of the glacier area on the Maladeta-Aneto Massif was lost between 1984 and 2007.
Image from SOER (2010)
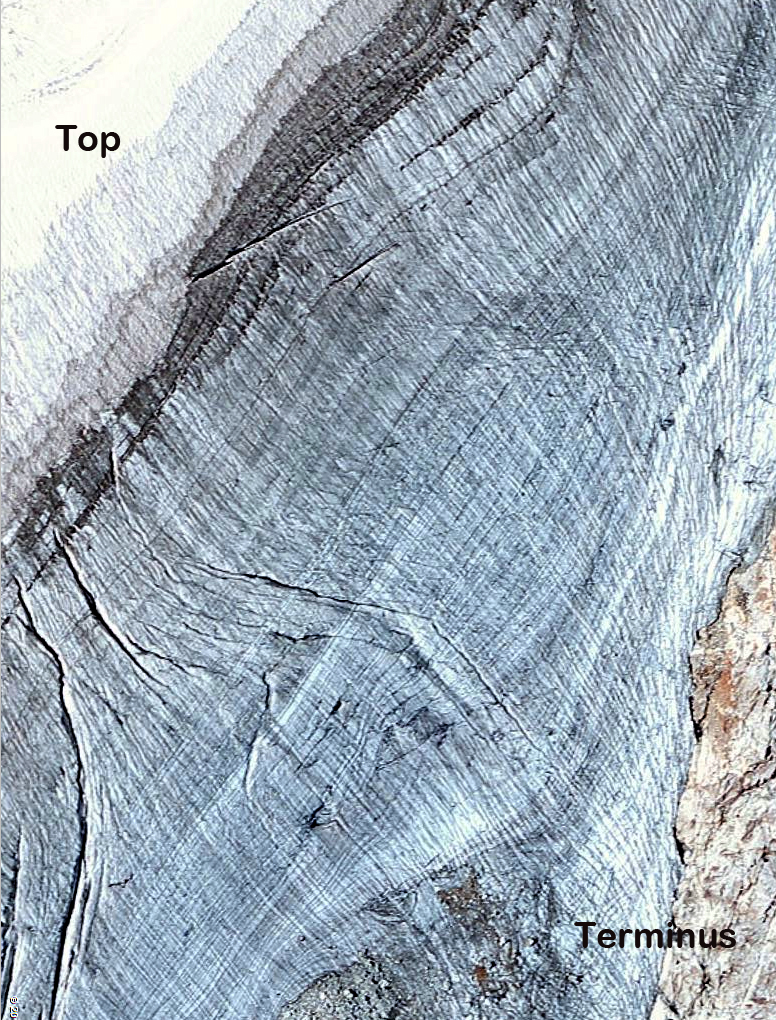
The glacier is too small to rely on our usual Landsat imagery. Here we focus on images from Google Earth and the Digital Globe. The glacier’s maximum top to bottom length by 2005 is no more than 600 meters, black dots indicate glaciers lower margin. The area in 2007 is 0.4 square kilometers by which time the glacier has developed a number of rock outcrops protruding through the thin ice. Snowcover in most images by late summer is minimal. This indicates the lack of a consistent accumulation zone, which a glacier cannot survive without (Pelto, 2010). The glacier has many exposed annual layers extending well upglacier, this is a further indication of the poor preservation of even old glacier ice. In 2005 and 2007 less than 10% of the glacier is snowcovered in the images which are not even at the end of the summer. This glacier is disappearing and like the Careser Glacier, Italy will break into several parts. The thin nature of the glacier is evident by looking up glacier from the terminus, last image from Gus Llobet (llobetgus-on Panaramio)
2005 Google Earth image, limited snowcover evident
Arrows indicate rock outcrops amidst the glacier.
2007 Digital Globe image
Annual layers of main glacier trunk in 2007
Images from Panaramio user-llobetgus
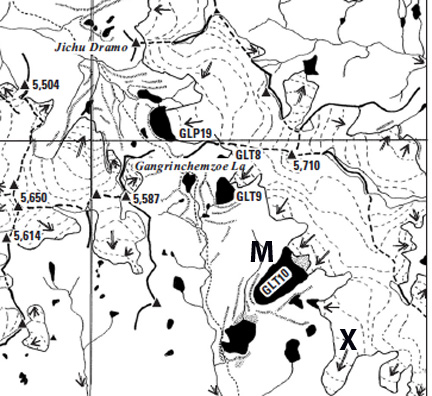
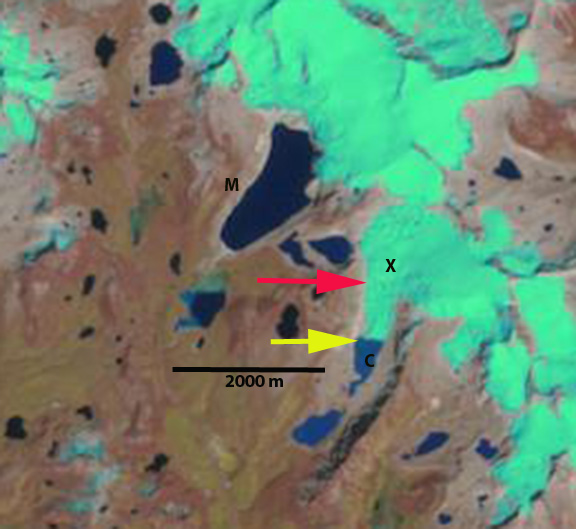
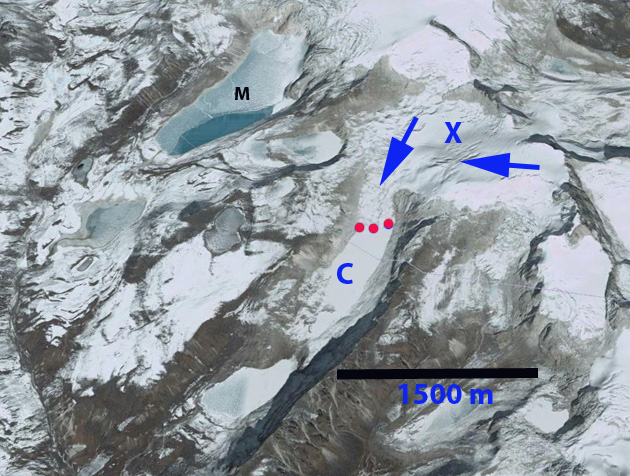
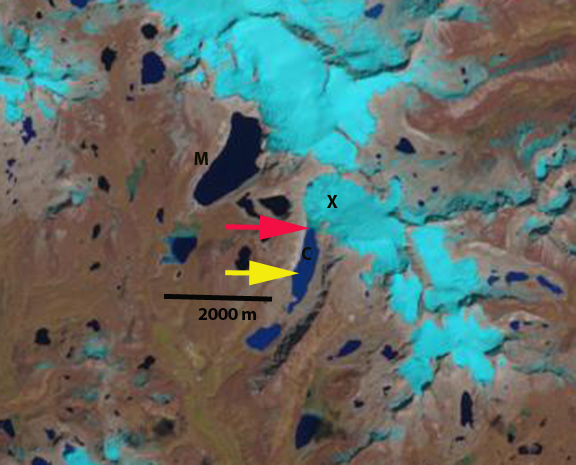
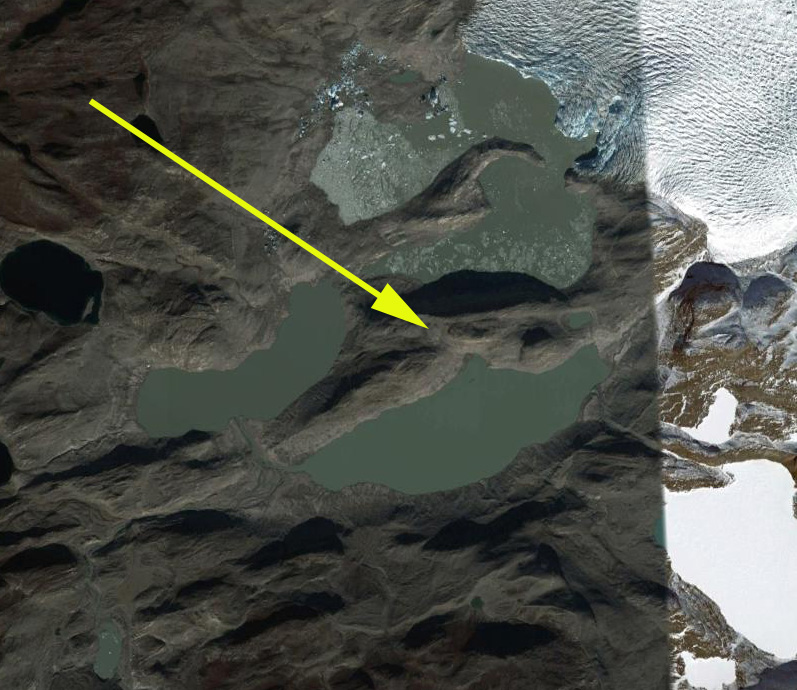
The Mangde Chu Basin in Bhutan is home to many alpine lakes, and the number is increasing as glacier retreat leads to both new lakes and expanding lakes. Many of these alpine lakes are impounding by glacial moraines of varying stability. Some of the glacial lakes are capable of outburst floods (GLOF), the resulting hazard has led to an inventory of these lakes in Bhutan and this watershed in a joint effort between Bhutan and EROC in Japan. Here we examine the development of a new lake not shown in the USGS map of the region from a 1993 SPOT image. This glacier is marked by an X and is just south of the Methatshota Tsho (M).
USGS Map
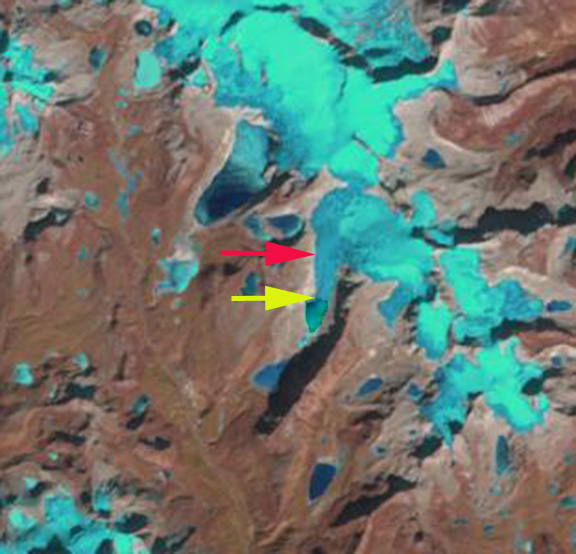
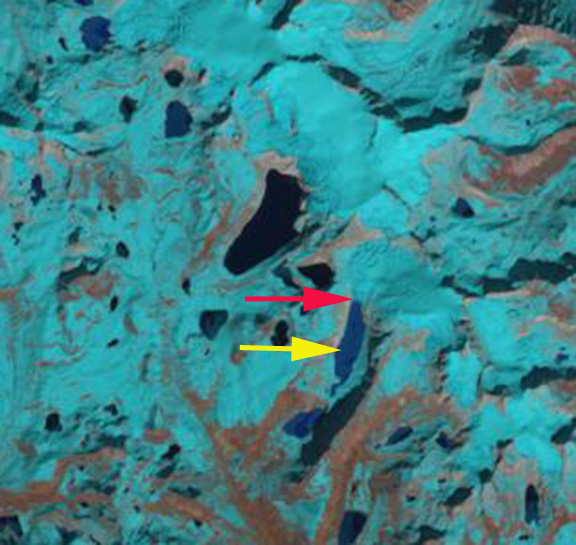
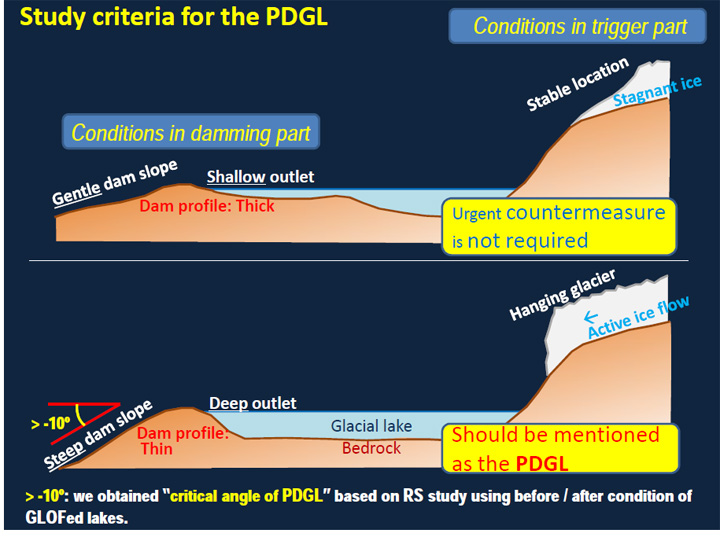
In a pair of Landsat images from October and December of 2000 the lake (C) has formed and the glacier terminates at the yellow arrow, red arrow is 2013 terminus. The lake is 550 m long. By 2006 in the Google Earth image the lake is 850 m long, terminus red dots. In 2013 Landsat images from October and December indicate the lake has expanded to a length of 1400 m. The glacier has retreated 1400-1500 m since 1993 and 850 m since 2000. Just above the red arrow the lake to the west of the glacier is not as close to the glacier, this indicates thinning of the upper sections of this glacier and marginal retreat in the accumulation zone. This is typically a sign that a glacier cannot survive current climate (Pelto, 2010). The lake is not impounded by a substantial terminal moraine, and does not appear to be prone to a substantial GLOF. This is what the joint Bhutan-Japan study indicates as not requiring urgent counter measures as the moraine dam is thick and the slope is not too high either of the moraine or the glacier leading into the lake, note last figure. The channel leading out of the lake is immature and will likely downcut through the glacial sediments, reducing the lake area somewhat. The glacier surface rises quickly just above the current terminus, indicating that the lake will not grow much longer, and glacier retreat will then slow as the terminus pulls out of the lake. This glacier is retreating as are the nearly all glaciers in the region such as Lugge Glacier, Thorhormi Glacier and Theri Kang Glacier all a short distance north.
2000 Landsat image
2000 Landsat image
2006 Google Earth Image
2013 Landsat image
2013 Landsat image
2006 Google Earth Image Image from Kumori
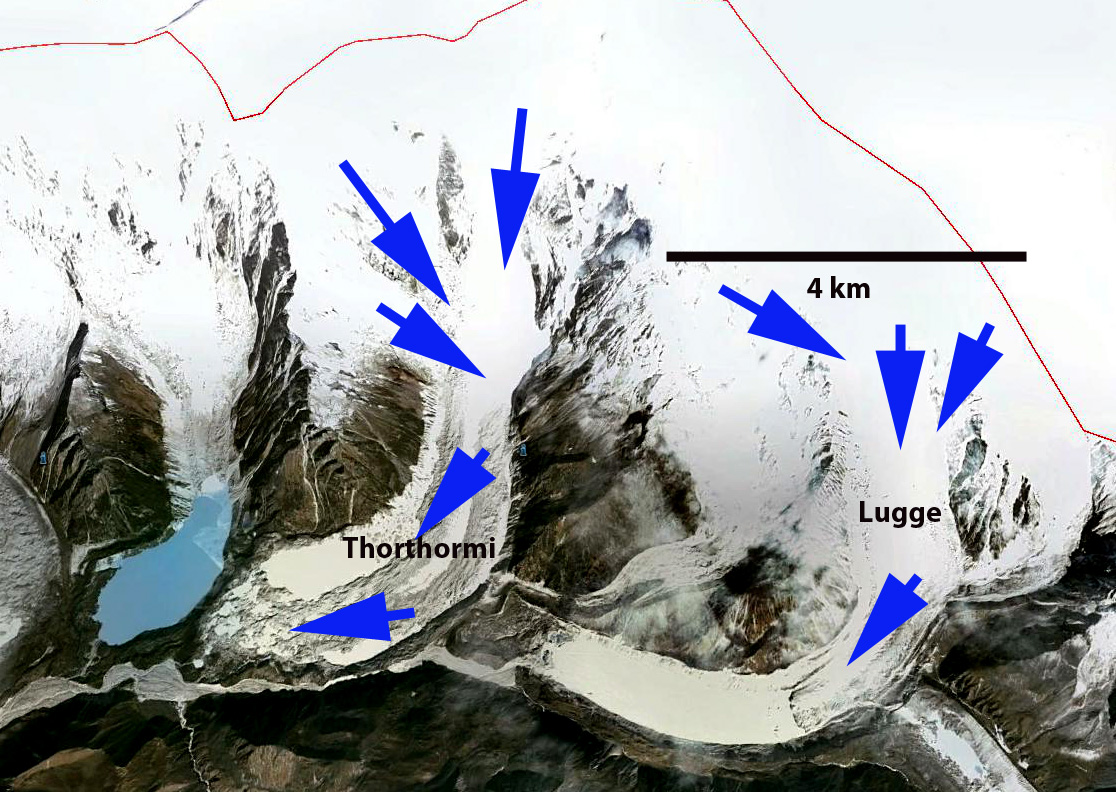
Luge and Thorthormi Glacier drain south from the border with China into the Pho Chu River in Bhutan. Both glaciers end in expanding glacier lakes that are prone to outburst floods, which sweep down the Pho Chu. Osti et al (2012) reported in detail on the nature of these floods, noting there are eight dangerous lakes including the two at the terminus of Lugge and Thorthormi Glacier, Thorthormi Cho and Lugge Cho. In 1994 Lugge Cho experienced a glacier lake outburst flood GLOF which incurred huge damage in the Pho Chu basin. The 1994 GLOF event had a peak discharge of about 2539 cubic meters/s and extended 200 km downstream as a flood wave Osti et al (2012) . The GLOF occurred after rapid retreat of Lugge Glacier from 1988-1993 of 160 m/year.
Google Earth Image
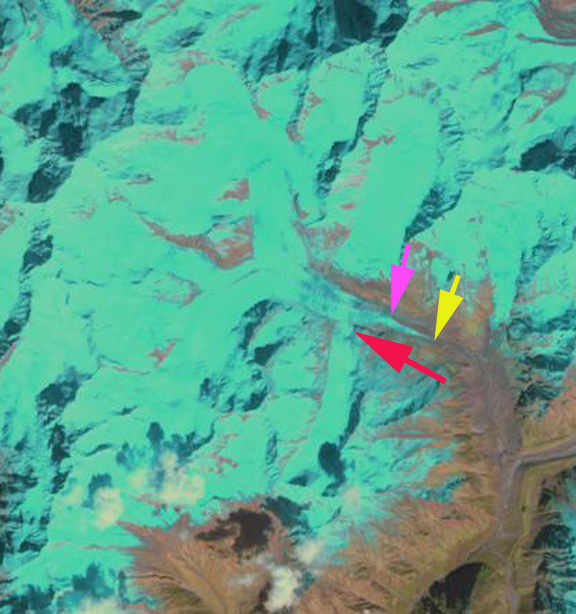
Here we examine the retreat of both glaciers in Landsat imagery from 2000-2014. In each image the red arrow indicates the 2000 terminus, the yellow arrow the 2014 terminus, the blue arrow the snowline on Lugge Glacier and the green arrow the center of the Thorthormi Glacier terminus in 2013. In 2000 the Lugge Glacier ends in a 2 km long Lugge Cho. The Thorthormi Glacier has pockets of proglacial lake in 2000, but also a debris covered terminus that extends across the lake basin to the Little Ice Age moraine (M). The two images from 2000 are from the start of October and late December. Note the snowline remains near 5100-5200 m in both images. The glaciers of Bhutan are summer accumulation type glaciers, in which the main accumulation season is during the summer monsoon. The snowline tends to rise from October into December with limited snowfall. By 2013 Lugge Glacier has retreated 1 km from the 2000 position, and Lugge Cho is now 3 km long. The terminus of Lugge Cho is not stagnant and it is not clear how much longer the deep basin extends under the glacier. If the basin does not extend much further retreat will soon be reduced. Thorthormi Glacier debris covered terminus connection to the moraine (M) has melted away and a lake extends across the full width of the glacier basin. The contiguous lake now has an area of over 1 square kilometer. The retreat of Thorthormi has been 700 m since 2000. The lowest 1 km of the glacier is stagnant and melt should be enhanced by calving into the lake, hence the retreat should remain quick in the next decade. The snowline in the Late November 2013 and early February 2014 image indicate the snowline at close to 5300 m in both. The retreat of these glaciers is leading to expansion of proglacial lakes much like the nearby Theri Kang and many other across the region Changsang Glacier, Sikkim, Lumding Glacier, NepalMatsang Tsanpo, Tibet .
2000 Landsat image
2000 Landsat image
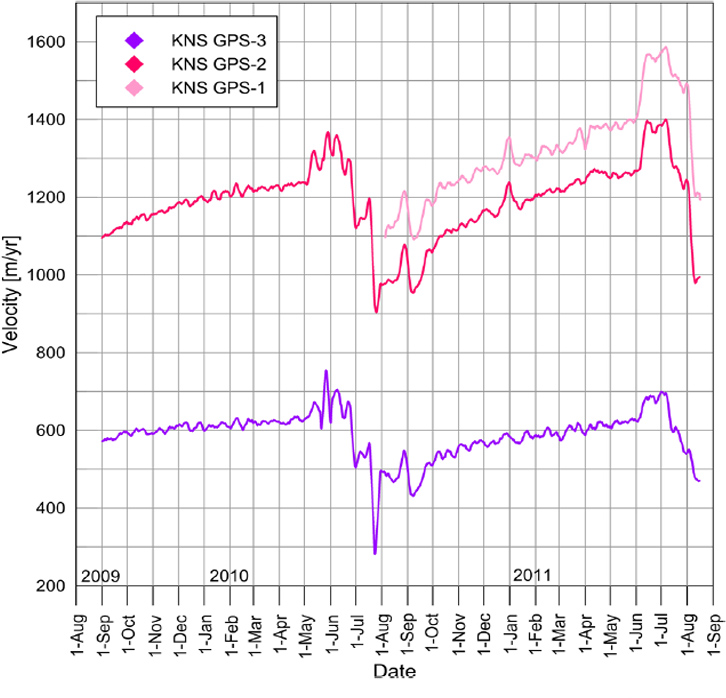
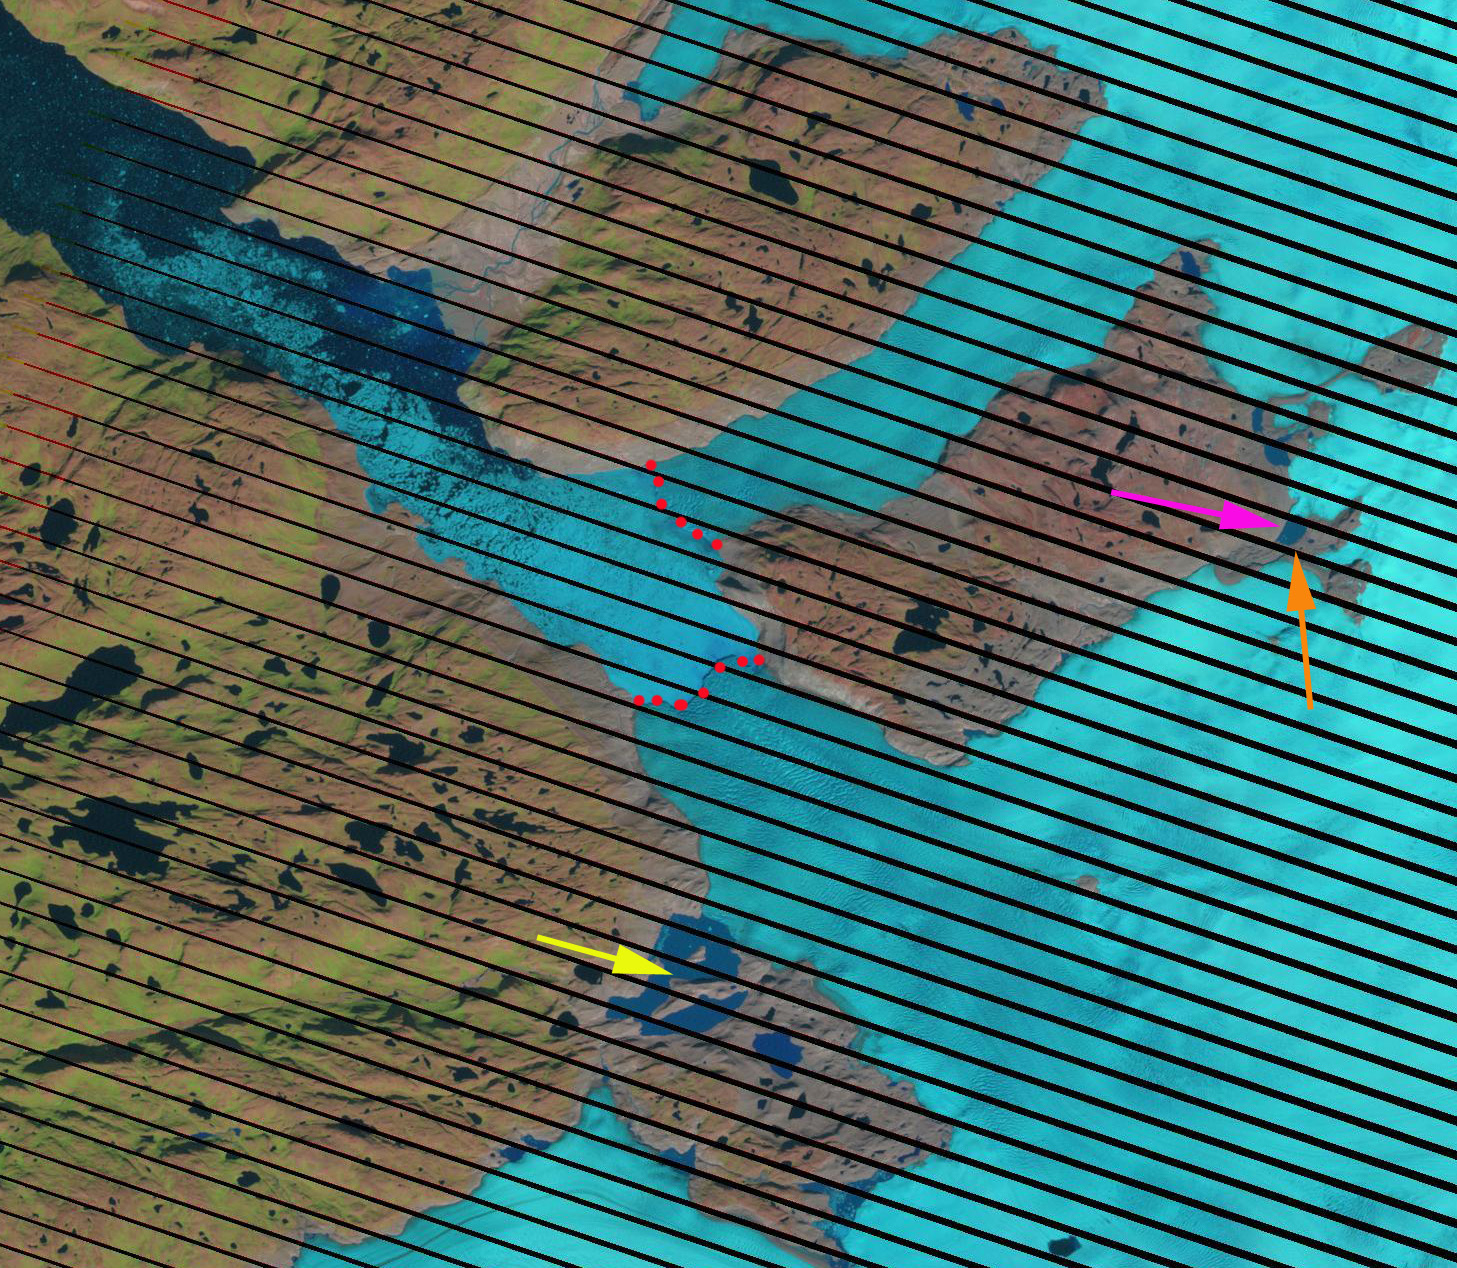
Kangiata Sermia is an outlet glacier in Southwest Greenland that empties into the Kangersunaq fjord east of Nuuk. Thomas et al (2009) noted that Kangiata Glacier thinned most notably near its terminus decrasing up glacier to negligible thinning 30 km inland. They further found that the glacier bed was above sea level 40 km inland. Sole et al (2010) observed variations in the velocity of this glacier and found that there was a substantial spring speedup as the melt season began and then an even more significant slowdown for most of the summer. They noted that the net effect of the summer speed variations on annual motion is small (∼1%), indicating the lack of a meltwater induced overall acceleration. The velocity figure below is from Figure 4 of Ahlstrom et al (2013), indicating the annual velocity minimum is in late summer. Box and Decker (2011) noted that glacier retreated 100 meters/year from 2000 to 2010.
Google Earth image
Thomas et al (2009) Figure showing the bedrock and surface profile of Kangiata Sermia
Ahlstrom et al (2013) Figure showing seasonal velocity change of Kangiata Sermia
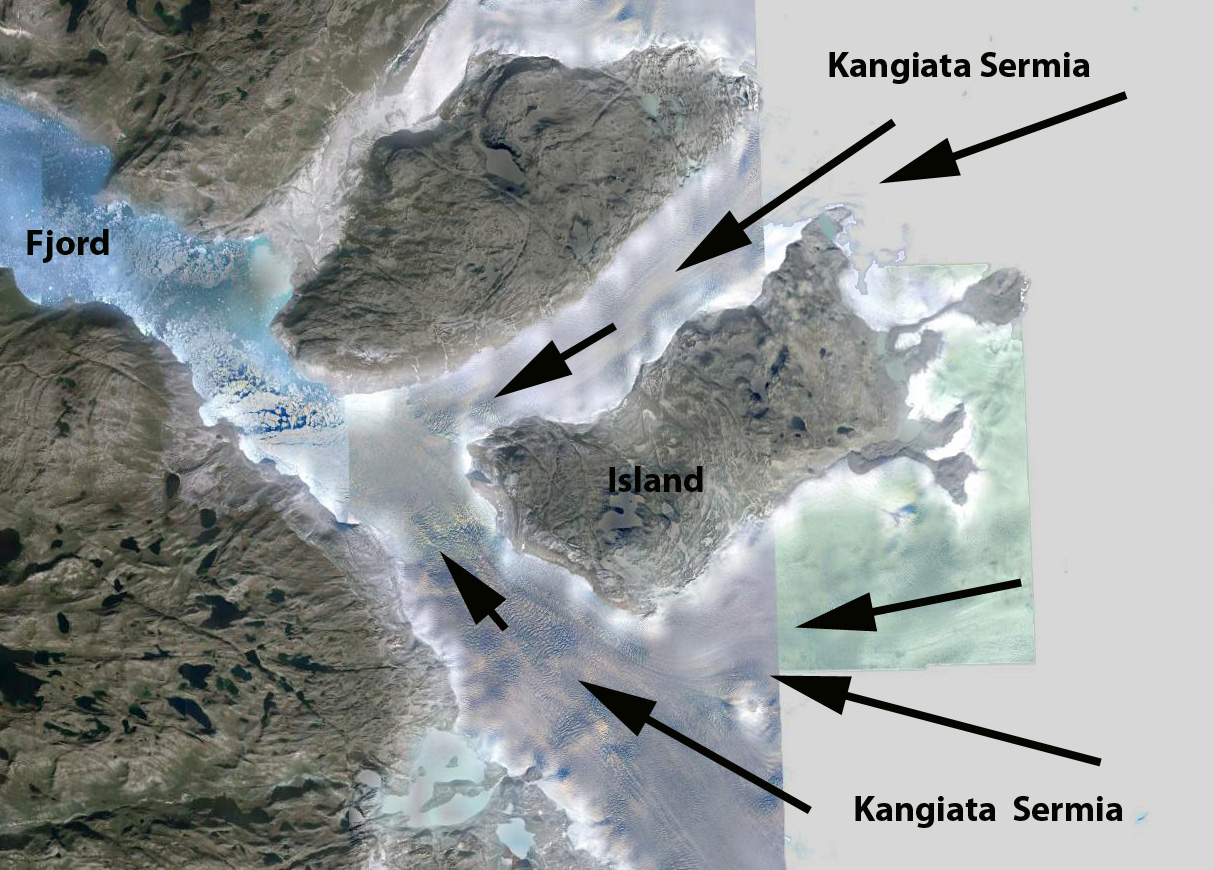
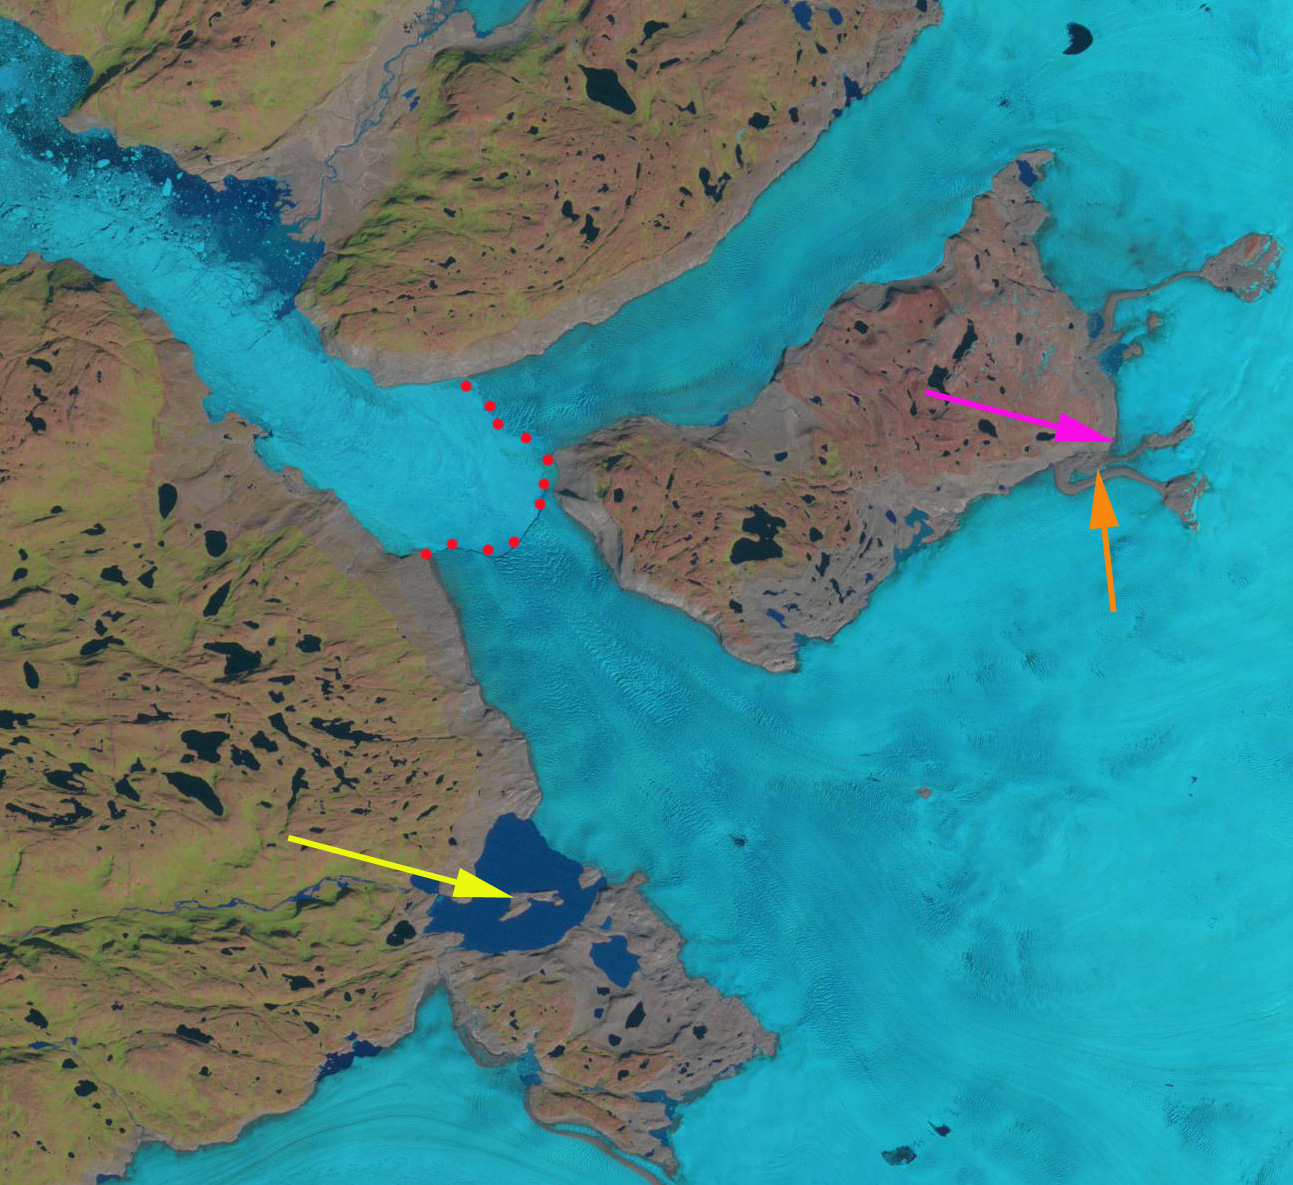
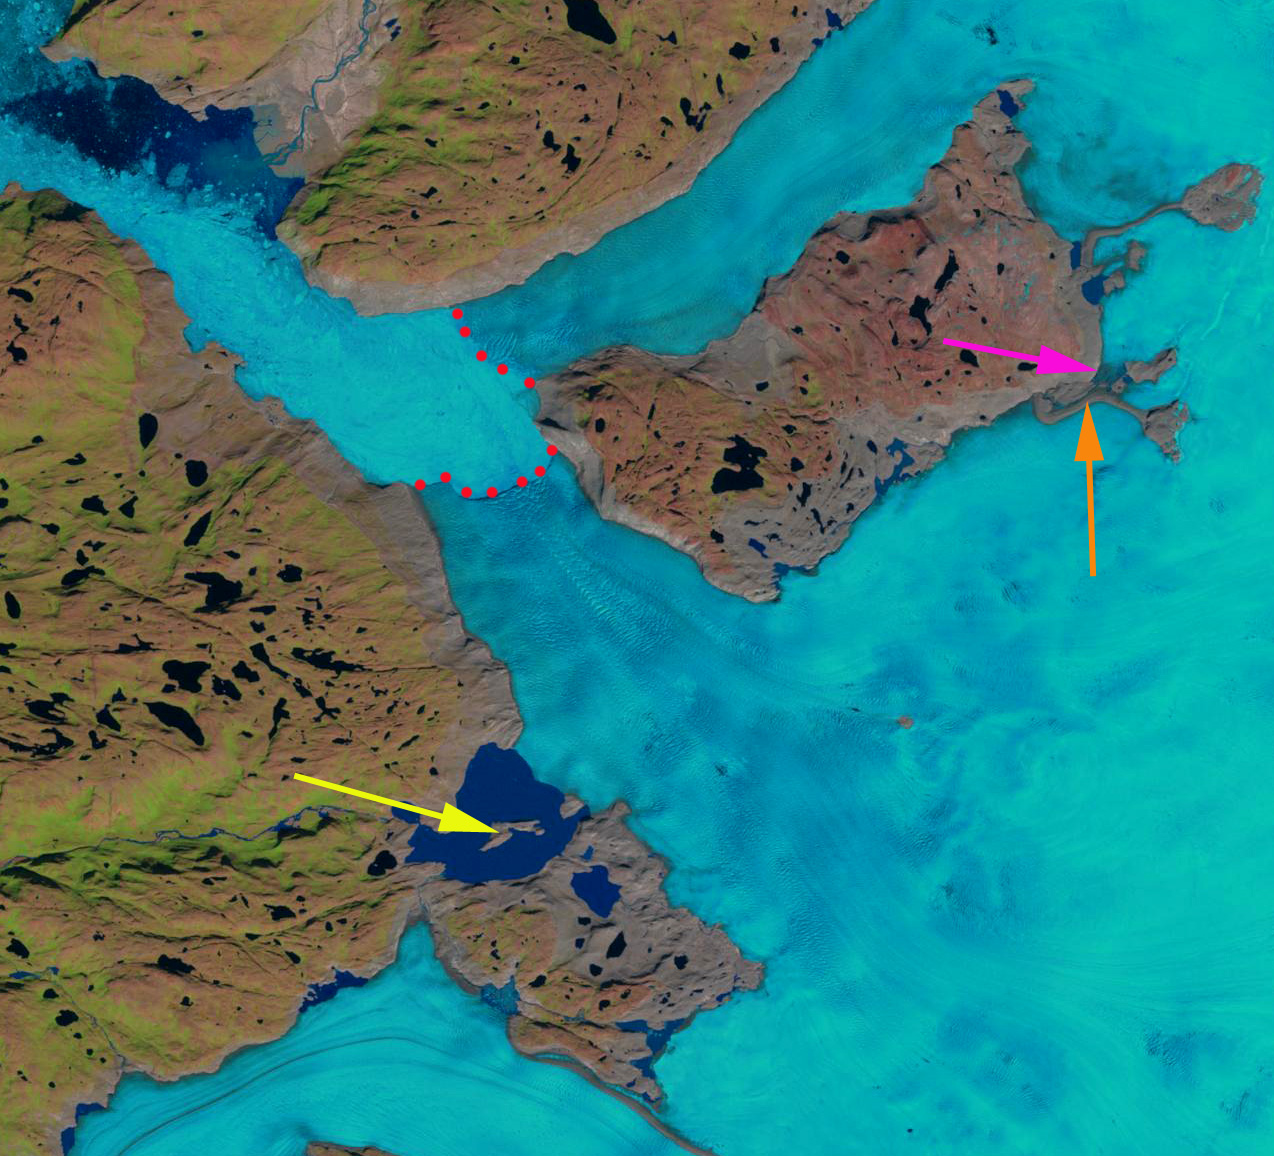
Here we examine Landsat imagery of the glacier from 1987 to 2013 to identify changes. In 1987 the two main termini of the glacier were joined, down fjord of an island that separates the two branches. The terminus in each image is indicated by red dots, the yellow arrow note an island in the middle of a peripheral ice dammed proglacial lake, the pink arrow a minor terminus on the north side of the island and the orange arrow a medial-lateral moraine comples extending into the glacier. By 2001 the glacier terminus has separated into two parts, with a retreat of jsut over 1 km in the 14 years. The proglacial lake is still full, yellow arrow. The upglacier minor terminus is developing a lake at its terminus as it retreats. The orange arrow indicates the expansion of the moraine complex as the glacier thins. By 2006 the main terminus has continued to retreat up the south side of the island 1.5 to 2 km since 2001. The proglacial lake level has declined and the island has become a peninisula. The thinning ice is simply not able to impound as deep or large a lake. The minor terminus at the pink arrow has developed a lake that is over 1 km long. In 2013 the changes from 2006 are limited, the moraine complex has continued to expand. The overall retreat from 1987 to 2013 is 3 km. The retreat is similar to that of Narssap Sermia , Kuussuup Sermia, and Qaleraliq as each responds to the climate warming. The lake is a bit larger, though the lake does fluctuate through an annual cycle filling and draining. Google Earth imagery indicates the lake at an even lower level, it no longer fills to nearly the level of 2001. This lake is similar to Tiningnilik in its size and location, but has lost more of its volume. The lake at the pink arrow is 1.2 km long. Each winter the fjord in front of the glacier freezes and the terminus protected from calving can advance. The Google Earth closeup image indicates the heavily crevassed nature of both termini indicative of rapid flow. On April 2, 2014 the fjord is quite filled with sea ice to the southeast bend 50 km from the terminus. The terminus is not distinct in this particular image.
1987 Landsat image
2001 Landsat image
2006 Landsat image
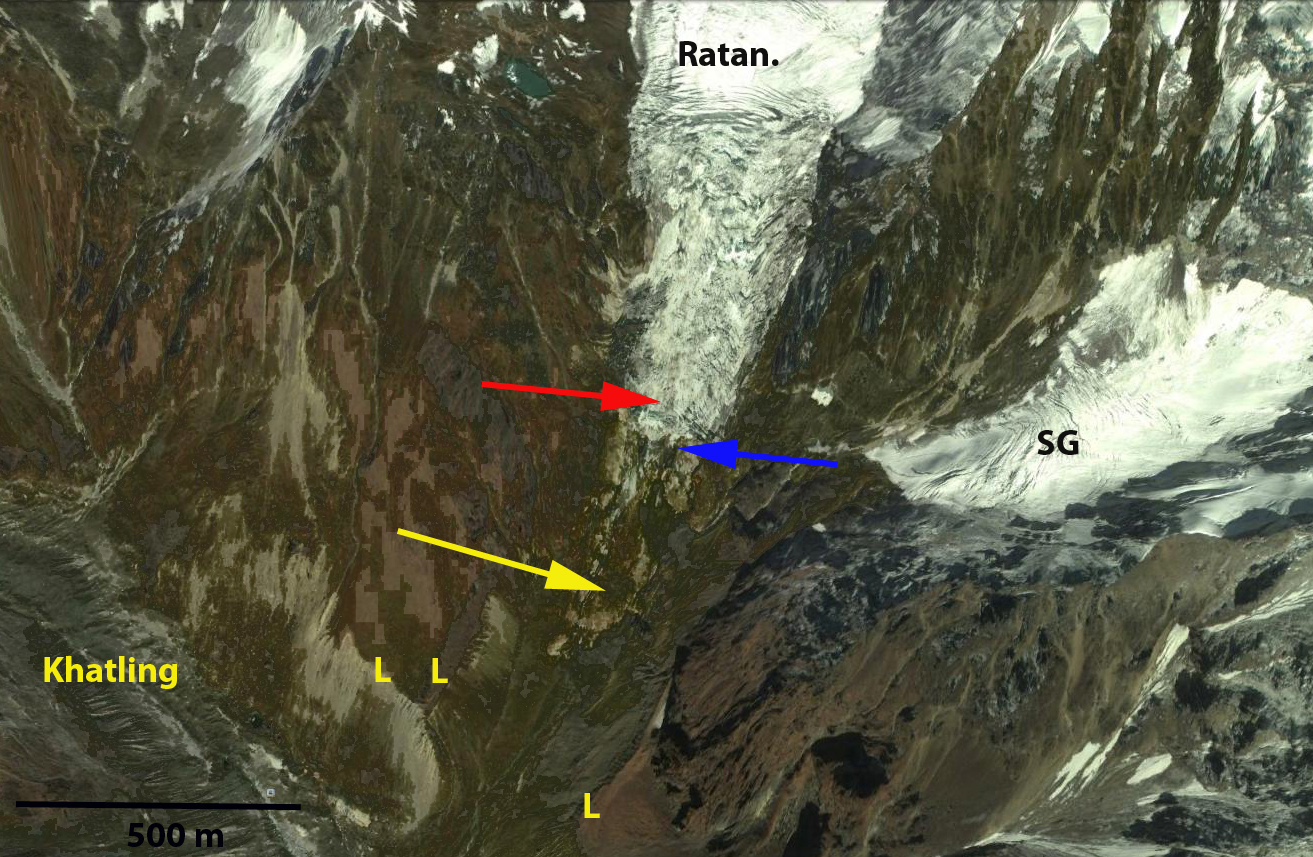
Khatling Bamak (Glacier) is the headwaters of the Bhilangana River in Uttarakhand, India. The Bhilangana River flows into the Tehri Reservoir(2400 MW), that along with the Bhilangana River’s three small hydropower projects (50 MW), make these glaciers key contributors to regional hydropower. The glacier was formerly joined with the Ratangrian Glacier as indicated by the map, but the two have separated with the Ratangrian Glacier now terminating 1.7 km upvalley of this former connection. The 10 km long glacier is fed by several mountain peaks including Jaonli over 6000 m. The lower section of the glacier is debris covered.
Here we examine satellite imagery from 1998, 1999, 2011 and 2013 to identify recent changes. The yellow arrow in the images indicates the lower limit of the clean ice in 1998, the pink arrow the lower limit of the clean ice in 2013. The red arrow indicates a significant tributary to Khatling Glacier joining from the south. The terminus is not evident in the Landsat images, but can be observed in the Google Earth imagery.
In 1998 the southern tributary joins the Khatling Glacier at 4500 m, 2.5 km upglacier of the terminus. The clean ice extends to within 1 km of the terminus. In the 1999 image the same connection with the southern tributary and location of the clean ice is evident. By 2011 the southern tributary is no longer connected to the glacier, red arrow. The clean ice does not reach the yellow arrow. The spread of the debris cover is not from additional avalanche input or flow from upglacier. The spread occurs as a glaciers ablation melts the clean ice faster and the debris cover where thick slows ice melt. This leads to topographic highs covered by debris cover that than slide-tumble down onto the clean ice. Without much input from upglacier the debris within the ice is melted out and can continue to concentrate at the surface. This is common among retreating glaciers with debris cover to have the debris begins to spread across the glacier. By 2013 the clean ice extent has retreated 1000 m from 1998 to the pink arrow of 2103. The southern tributary has retreated 200 m from its former junction. The terminus of the glacier has retreated 400 m from 1998-2013. A close up of the terminus from 2011 Google Earth imagery indicates the outlet river (pink arrow) issuing from beneath the stagnant debris covered ice (DC) and the distance from the terminus to the clean ice (CI). The lateral moraines of the Khatling and Ratangrian Glacier are also shown. The hummocky thin nature of the lower 700 m of the glacier is evident, light blue arrows, indicating an area that will be lost from the glacier soon. Khatling Glacier retreat is similar to that of nearby Gangotri Glacier and Jaonli Glacier that also feed Tehri Dam.
1998 Landsat image
Ratangrian Glacier is adjacent to Khatling Glacier and with that glacier is at the headwaters of the Bhilangana River. The Bhilangana River flows into the Tehri Reservoir(2400 MW), that along with the Bhilangana River’s three small hydropower projects (50 MW), make these glaciers key contributors to regional hydropower.
In the 1998 Landsat image the glacier terminus is at the red arrow, which is at 4150 m and downhill of the stream from the glacier labelled SG. The map above indicates the glacier was joined with Khatling Bamak at 3950 m, the lateral moraines (L-on second image below) indicate this too. The glacier is quite steep in its last mile descending from 5000 m to 4150 m in 1.5 km. The glacier is also not debris covered unlike many of its neighbors Khatling, Gangotri or Jaonli Glacier. A 2011 Google Earth image indicates the glacier has retreated to the blue arrow, where the outtlet stream from the glacier SG reaches the Ratangrian valley. By 2013 the glacier has retreated above the location where the outlet stream reaches the valley and is at the yellow arrow. The total retreat in 15 years is 400-450 m. The terminus of the glacier has risen from 4150 m to 4500 . The glacier is following the path of retreat of the nearby Gangotri Glacier and Jaonli Glacier that also feed Tehri Dam. The retreat is more rapid proportionally for the size of the glacier, probably due to the lack of debris cover. The slopes in the basin feeding the glacier are mostly covered by the glacier itself. If they were steeper and were not as ice covered, than avalanches could sweep debris onto the glacier.
1998 Landsat image
Verde Glacier is adjacent to Reichert Glacier and drains the north side of the Northern Patagonia Icefield. It is a small glacier compare to many outlet glaciers of the icefield that have been examined in previous posts, Reichert Glacier, Steffen Glacier, Nef Glacier, and Colonia Glacier. Here we examine Landsat imagery during the 1998-2014 period to identify the response of the glacier. The glacier flows from a pair of peaks at 1800 m to terminate at the edge of a proglacial lake. There is a significant icefall at 800-1250 m and a significant avalanche fan at the base of this icefall that is spills from a disconnected portion of the glacier west of the terminus and just northwest of the icefall. Davies and Glasser (2012) Figure 2d indicates the glacier nearly filling the entire lake in 1975. In Figure 8a they indicate the fastest retreat for the glacier being from 1998-2014. Rivera et al (2007) indicate the ELA for the glacier at the top of the icefall 1250 m.
The yellow arrow in each image is the 2014 terminus and the red arrow the 1998 terminus. In 1998 the glacier terminates at the red arrow just beyond the northeast bend in the lake. The lake is 1.6 km long. By 2001 the glacier has retreated 300 m and is at this bend. Notice that the lowest lone kilometer of the glacier is quite debris covered. By 2014 the glacier has retreated to the yellow arrow, this is a further 600 m retreat since 2011. The lake is 2.5 km long measured along its center line. The 900 meter retreat in 16 years is substantial for a glacier that is only 5 km long. A cloe up view of the terminus in a Goggle Earth image indicates that the lowest 300 m is debris coverered ice, notice the wetness of some of the debris, pink arrow. This looks more like ice cored moraine than active glacier ice covered by debris. If this is the case the active terminus is 300 m from the shore of the lake, at the yellow terminus where calving begins. It is certain the lake will expand further as the buried ice melts, but it is nearing its southwestern limit. The steep slope of the icefall and the rock slope to the right of the icefall is evident. This will lead to continued avalanching onto the terminus area, that will make that lowest region above the yellow arrow more difficult to melt out. One observation that is striking is the number of narrow alpine lakes that have formed and expanded as the Northern Patagonia Icefield outlet glaciers have receded.
1998 Landsat image


 Landsat image 1990
 Landsat image 1999
 Landsat image 2002
 Landsat image 2007