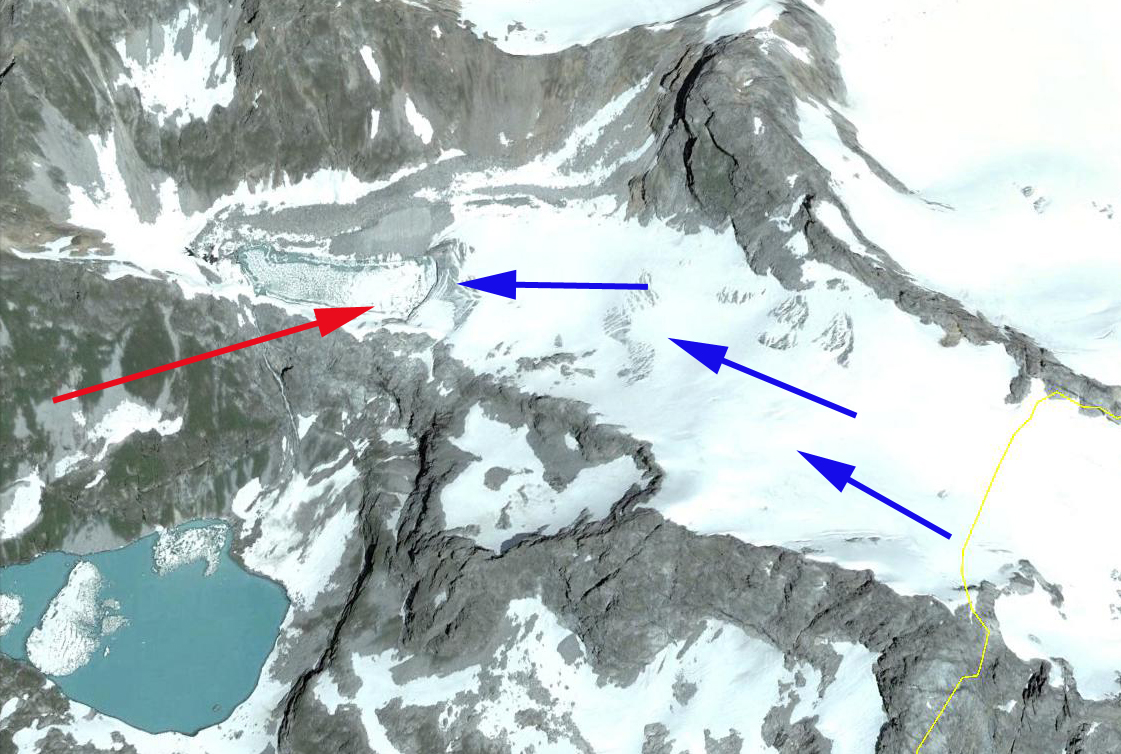
Reichert Glacier (Reicher) is at the northwest corner of the North Patagonia Icefield (NPI) and flows west from the Mont Saint Valentin region and ends in the expanding Reicher Lake. Rivera et al (2007) notes that the glacier was named for French geologist Federico Reichert, but that Reicher has ended up as the established spelling. They further note that the glacier lost 4.2 square kilometers of area from 1979 to 2001 and had an ELA of 1330 m. The glacier has two main icefalls, one at the first bend in the glacier above the terminus at 400 m, the second at the ELA from 1100-1600 m. Davies and Glasser (2012) identify the most rapid area loss of -0.77% per year to the 1986-2001 period. The glacier retreated rapidly from 1987-1997, but the terminus was stabilized from 1997-2001, before retreating again to near the 2014 terminus by 2002.
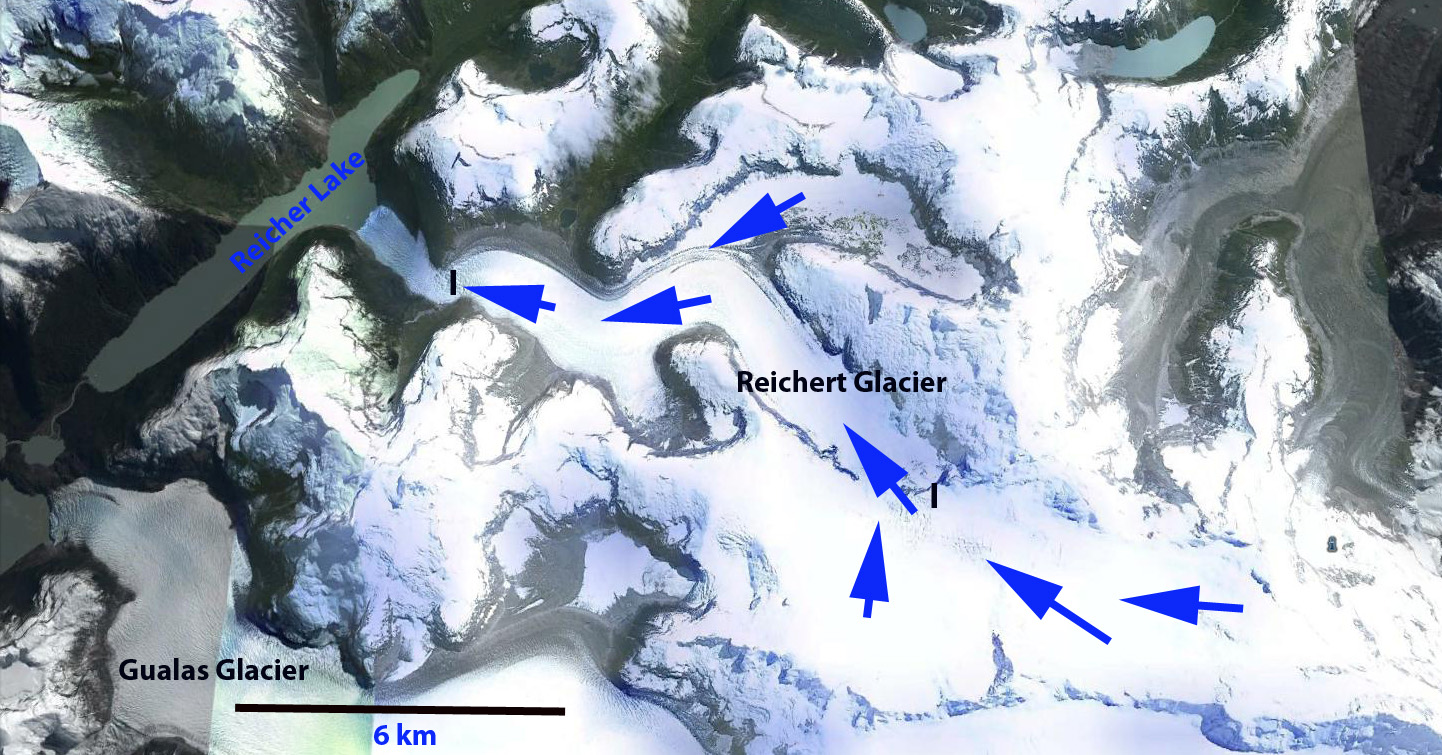
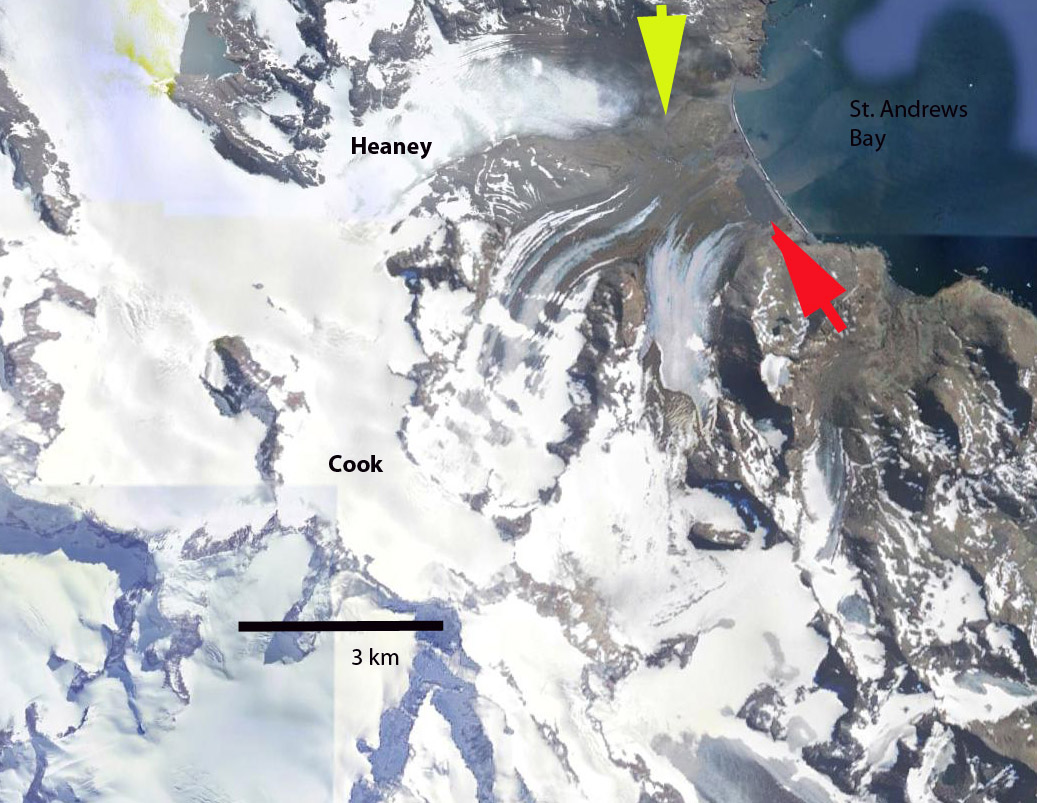
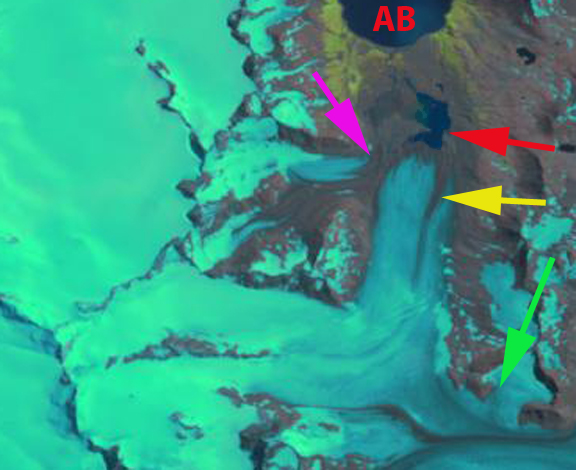
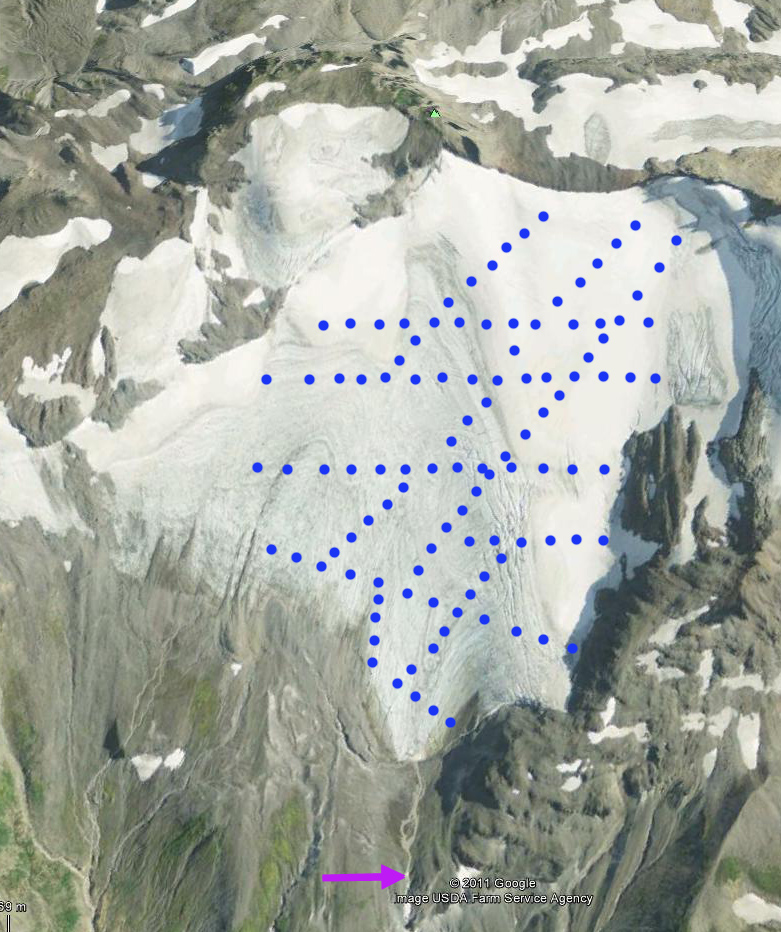
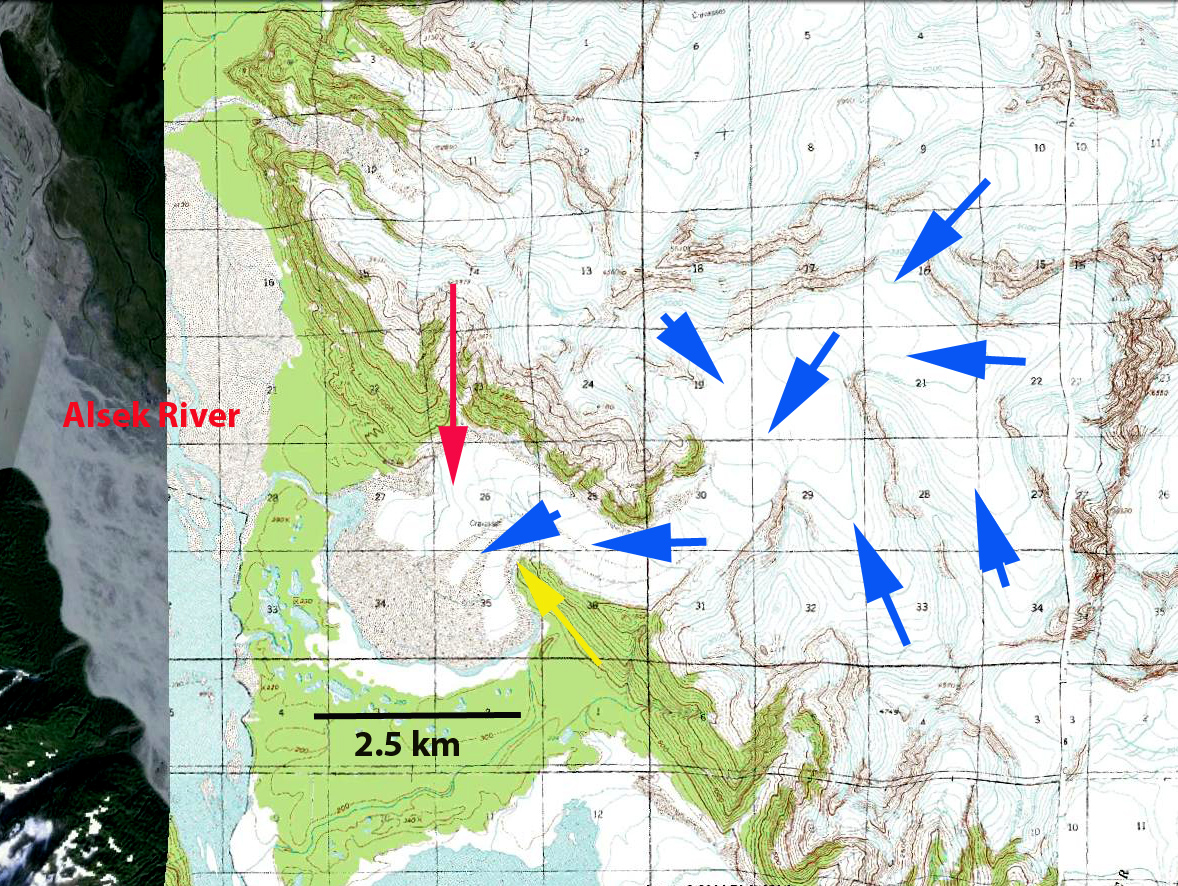
2013 Google Earth image
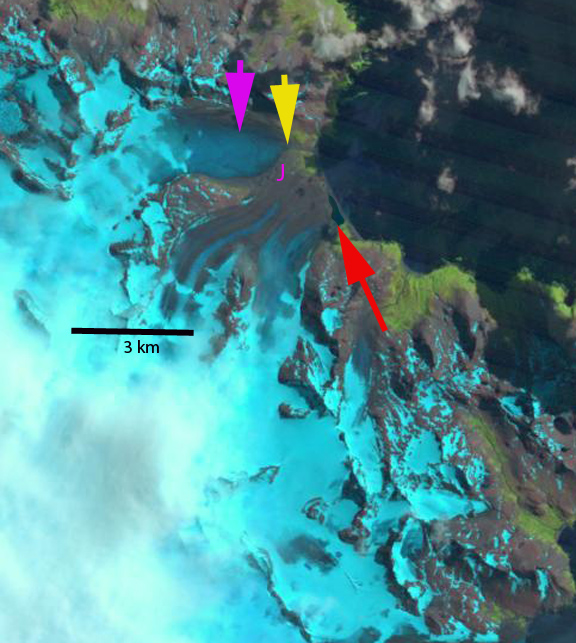
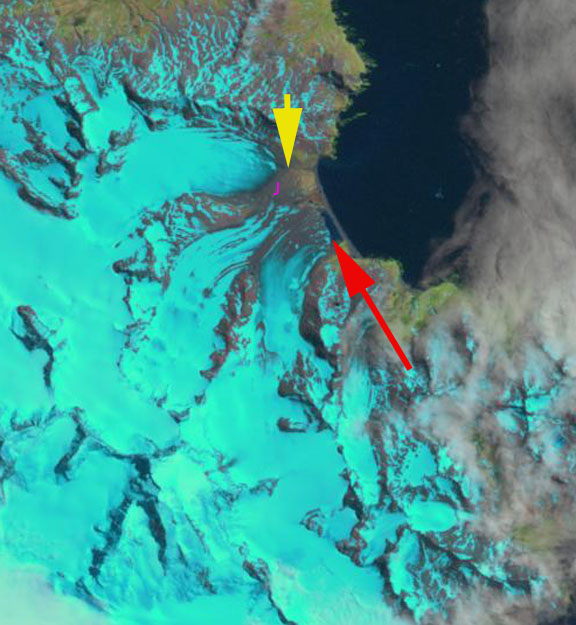
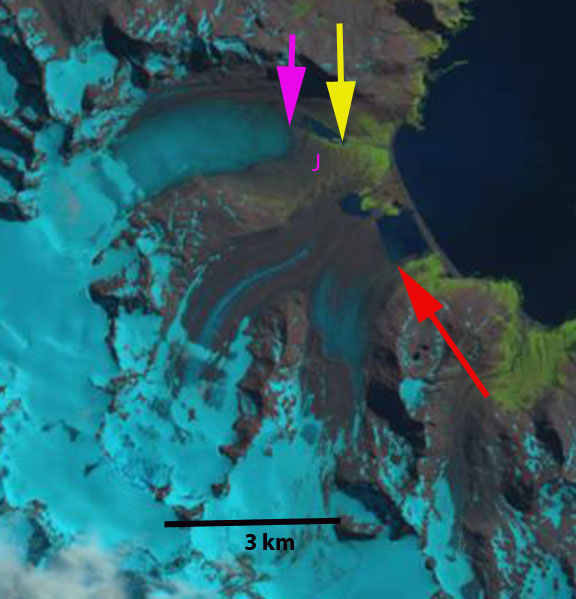
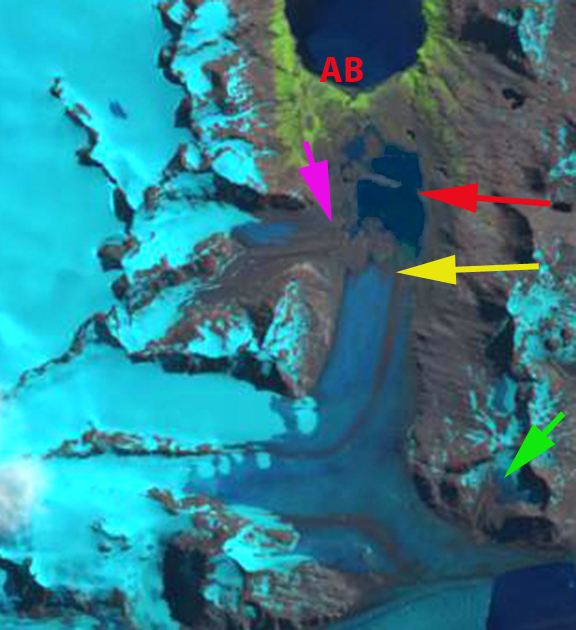
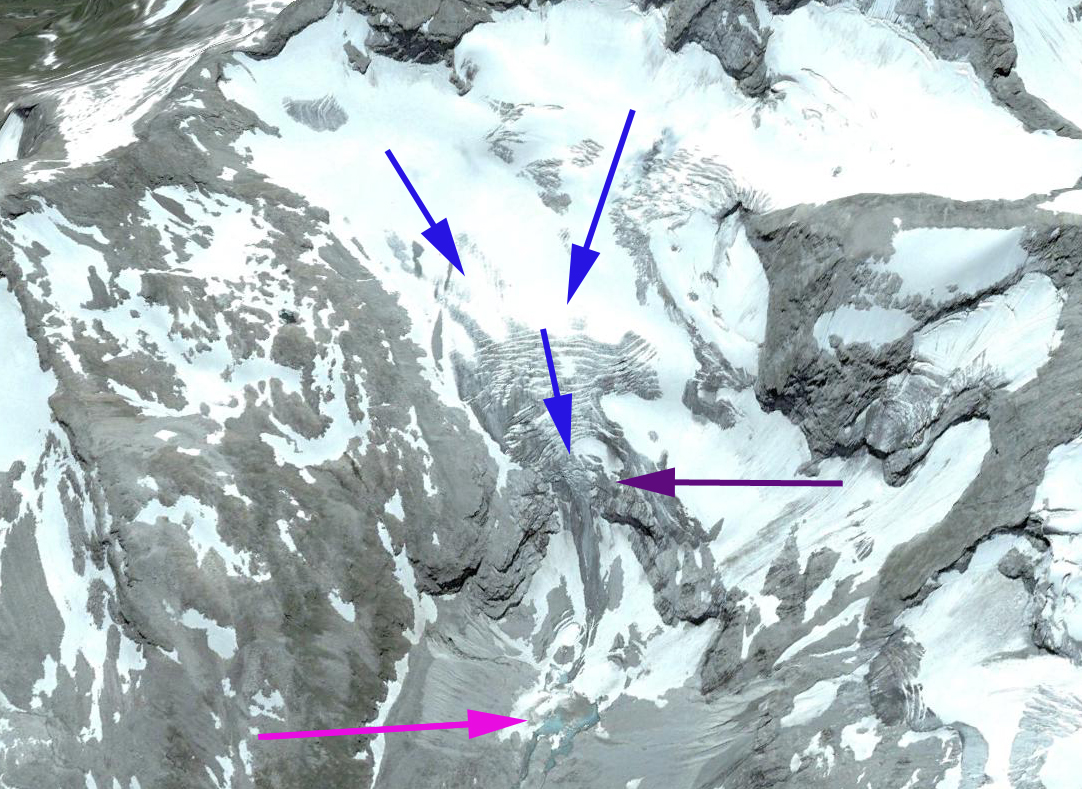
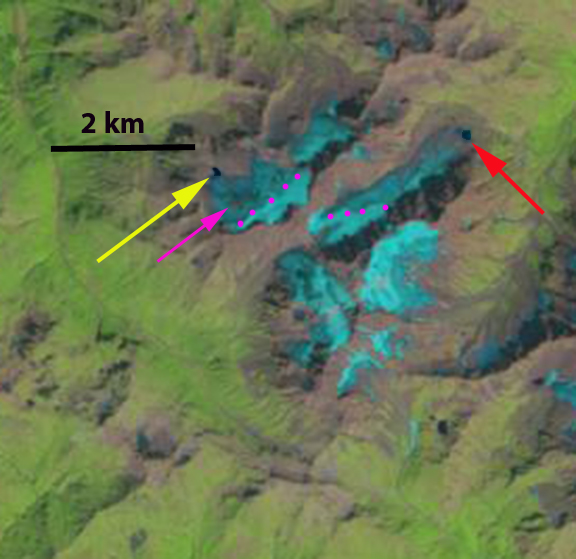
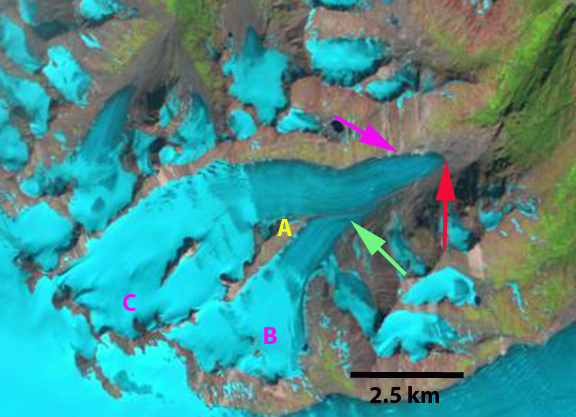
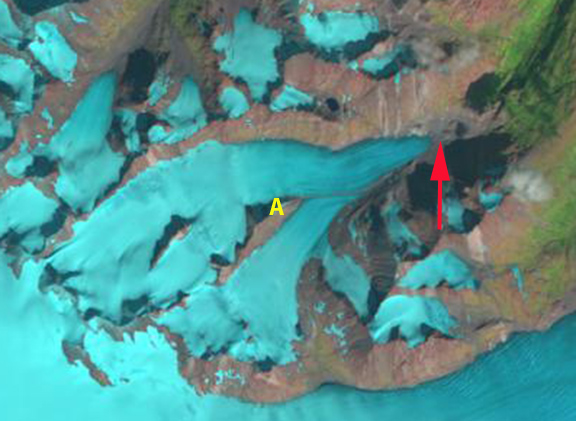
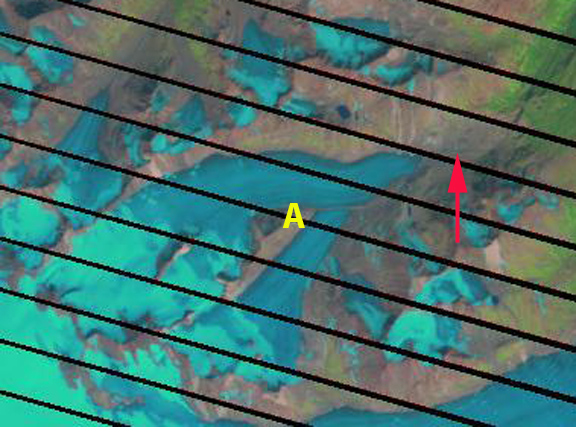
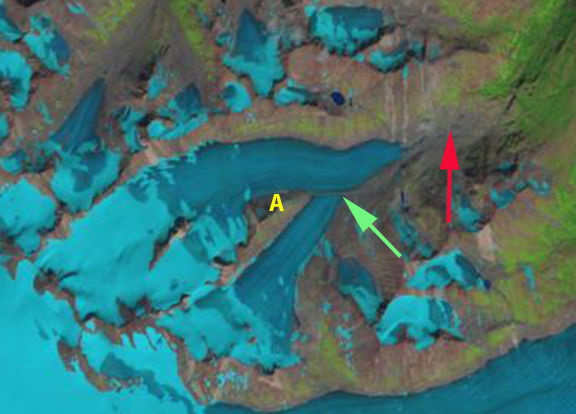
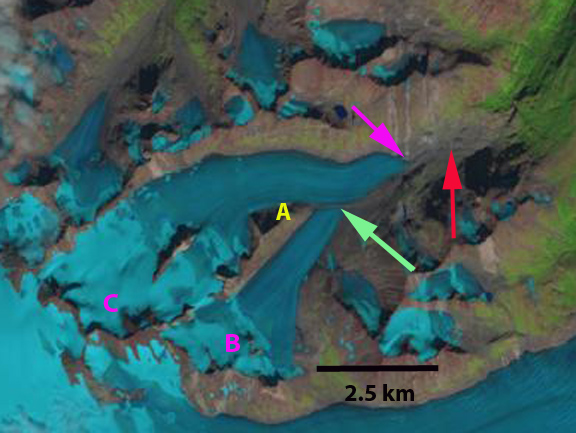
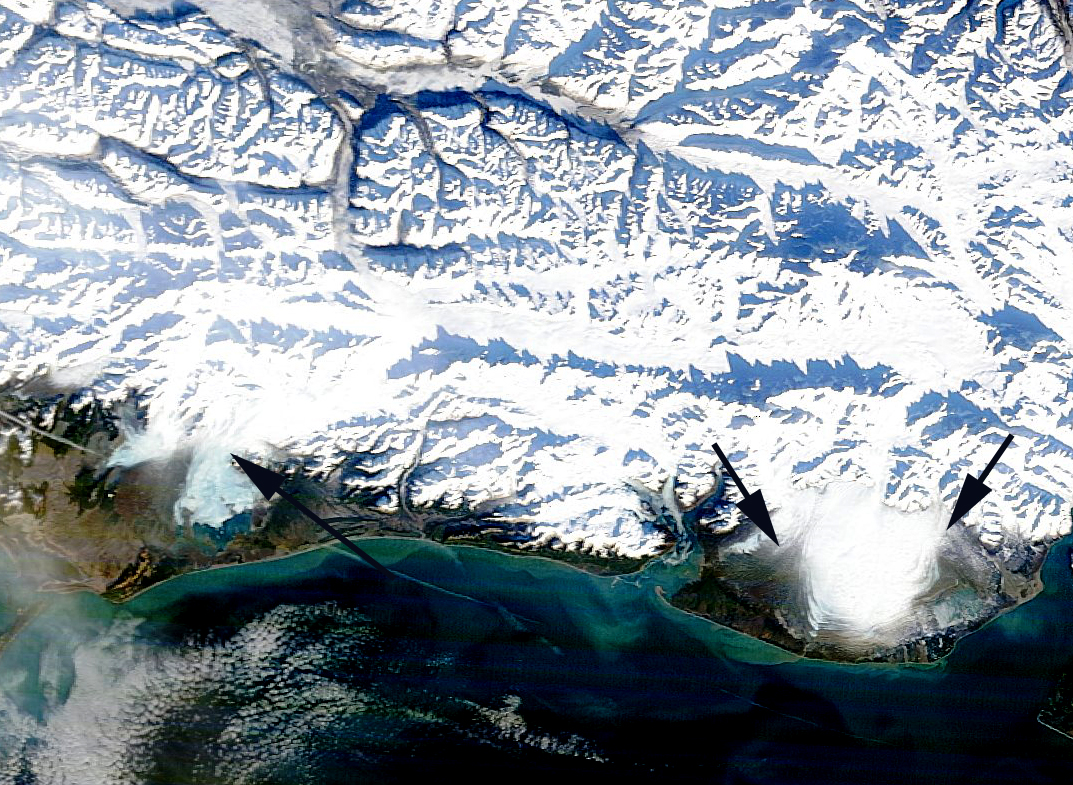
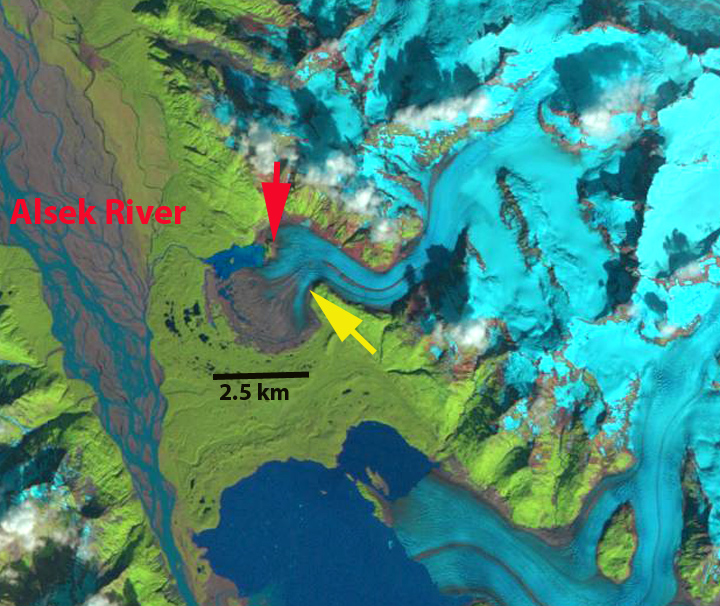
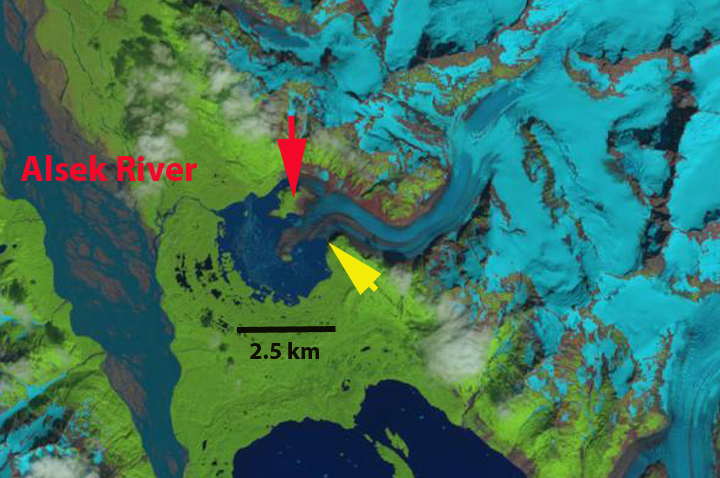
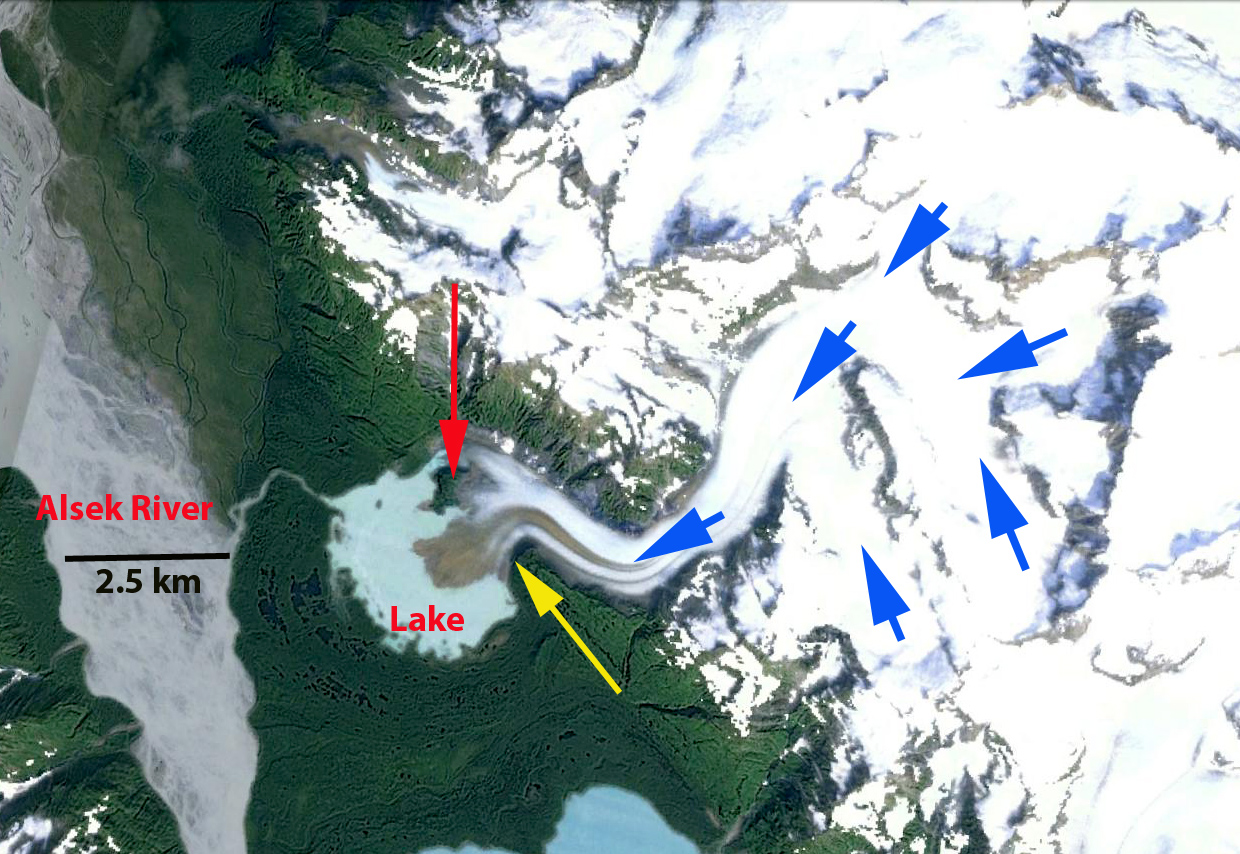
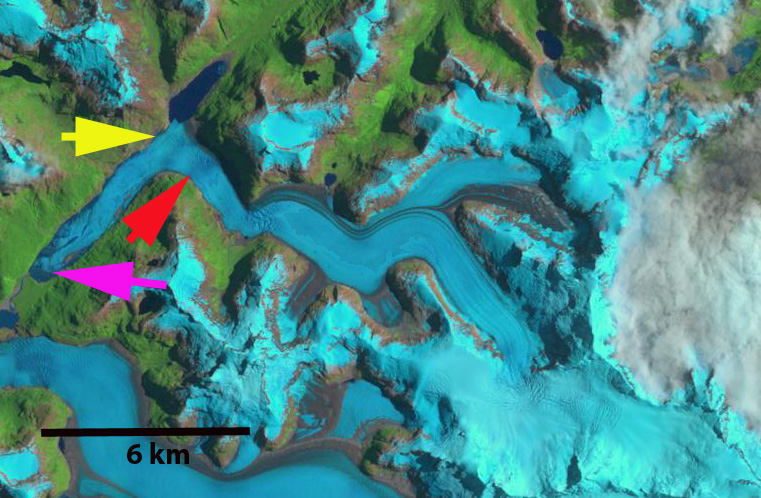
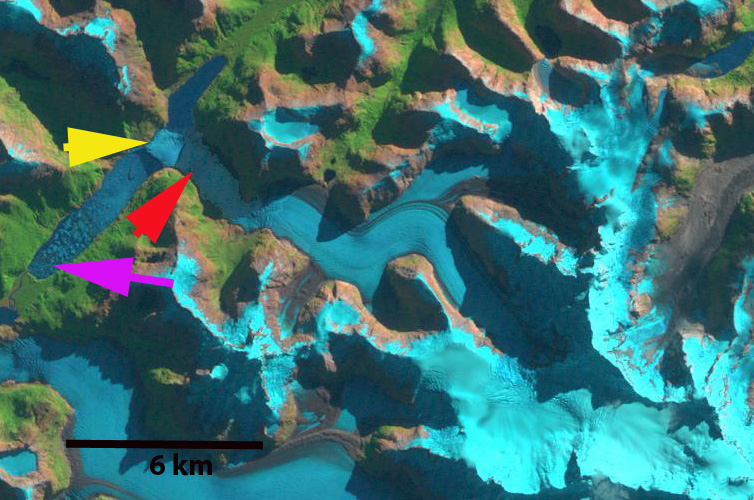
Here we examine Landsat imagery from 1986, 1997 and 2014 to document the changes. The pink arrow indicates the 1987, terminus, the yellow arrow the 1998 terminus and the red arrow the 2014 terminus. In 1987 the glacier terminates close to the southern end of Reicher Lake, pink arrow. By 1998 the glacier has retreated to the yellow arrow and is terminating on the west side of Reicher Lake across the lake from the main glacier valley. By 2014 the glacier has retreated into the main glacier valley and Reicher Lake extends 8.8 km from the northeast to southwest. A new lake has developed in 2014 above the first icefall, orange arrow. This lake indicates a potential second lake basin beginning to develop in the glacier reach above the first icefall. If this is the case another rapid retreat will ensue, though not in the immediate future. The glacier retreated 6.7 km from 1987 to 2014, with 90% of the retreat occuring by 2002. Area extent loss is 8-9 square kilometers. The lower icefall is 1.5 km from the current terminus, and indicates the maximum extent of Reicher lake and the retreat that can be enhanced by calving into that lake. This glacier has followed the pattern of the neighboring Gualas Glacier just to its south. WHOI-Oceanus recently published an interesting article on this glacier. The retreat is emblematic of the entire NPI as noted by both Rivera et al (2007) and Davies and Glasser (2012) work, the latter had an excellent Figure 8 indicating two periods of fastest recession since 1870, are 1975-1986 and 2001-2011 for NPI glaciers. This retreat includes that of Steffen Glacier, Nef Glacier, and Colonia Glacier.
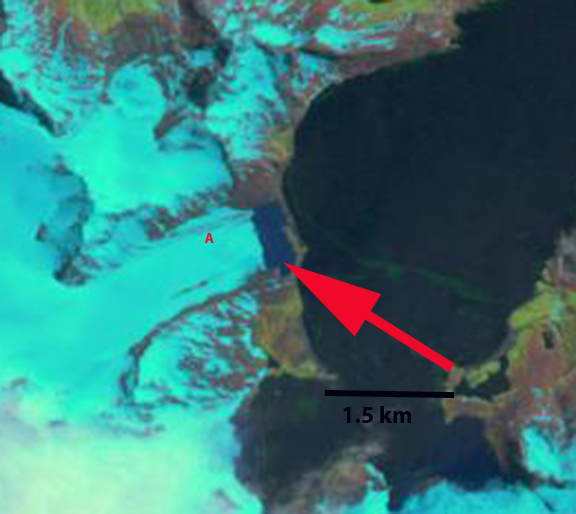
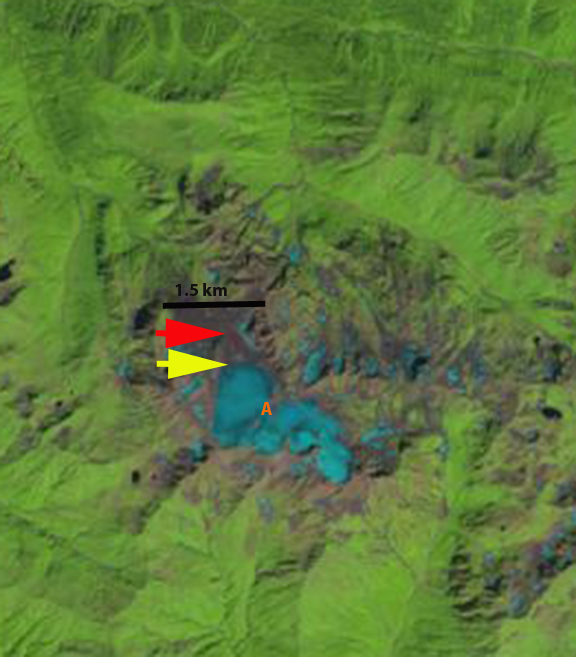
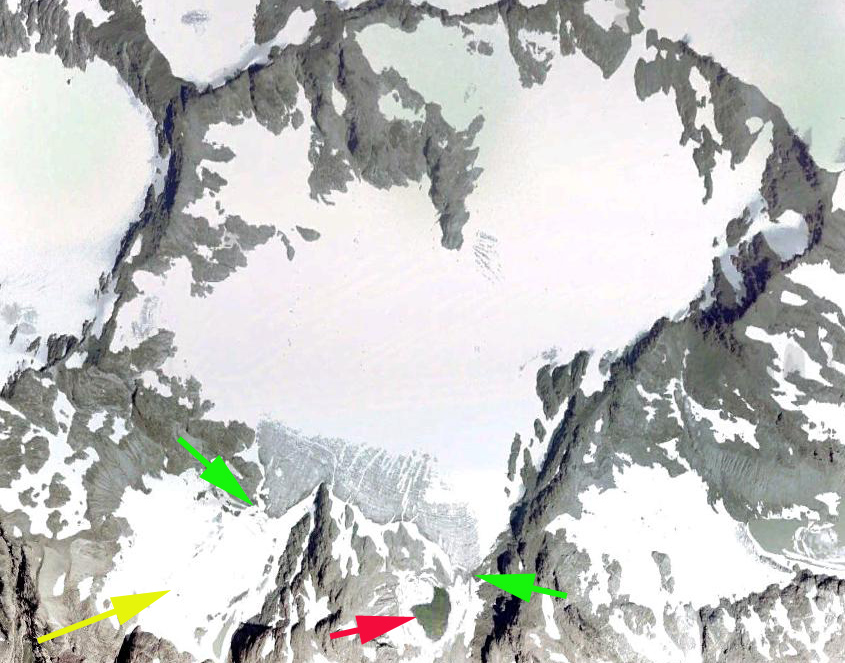
1987 Landsat image
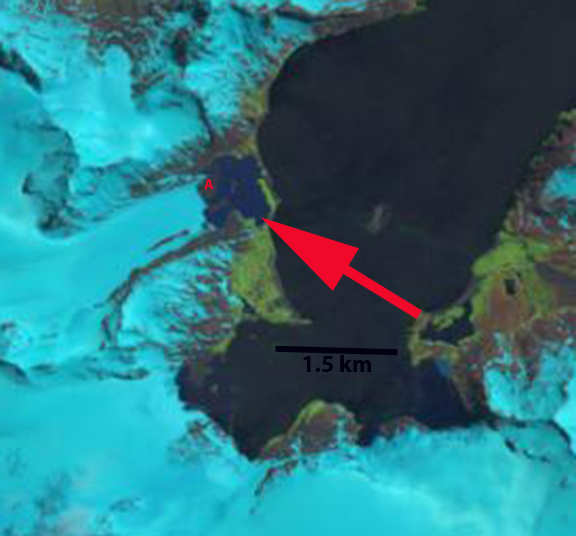
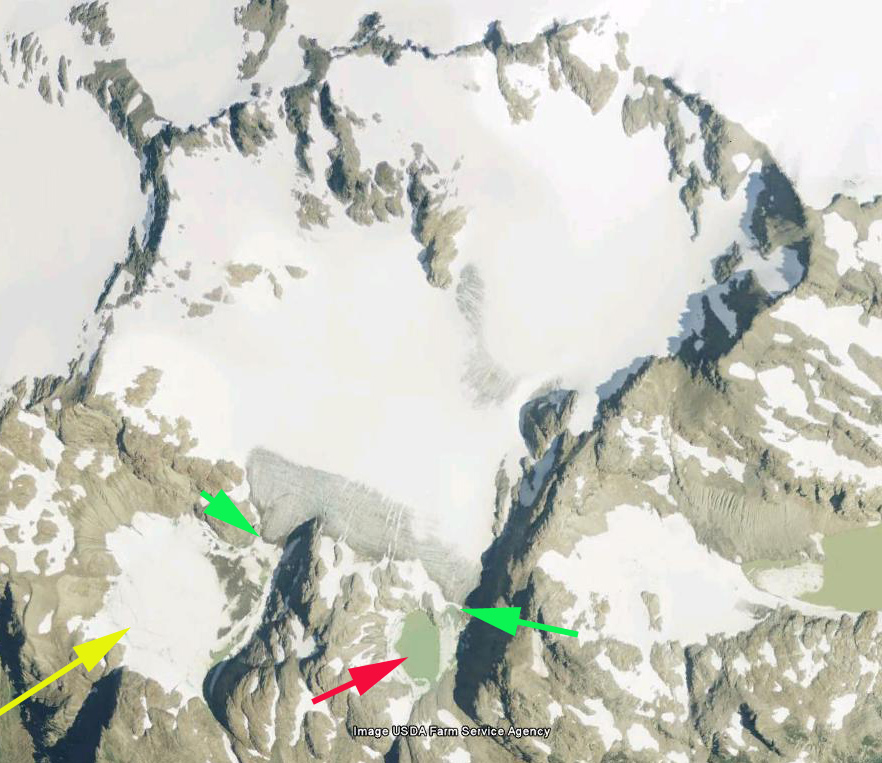
1998 Landsat image

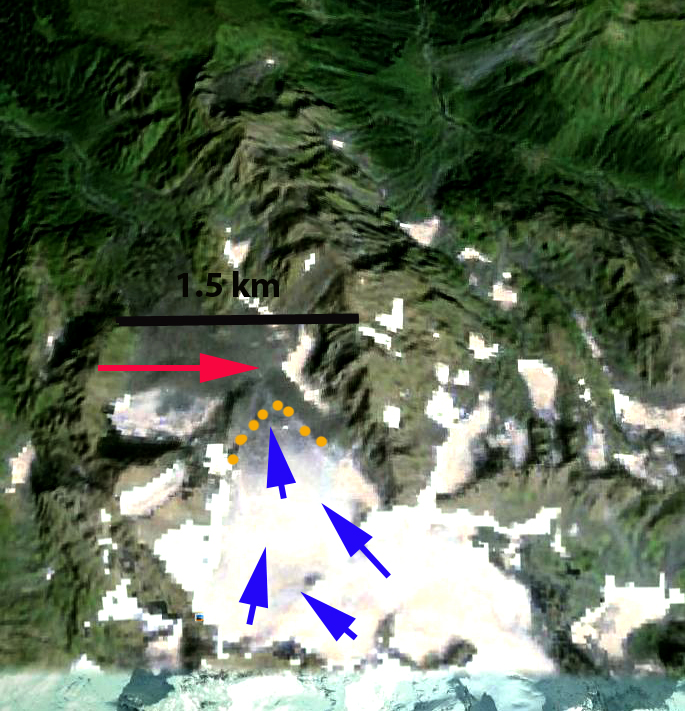
2014 Landsat image