Walker Glacier terminates adjacent to the Alsek River, a popular rafting river route. Many rafting trips visit Walker Glacier since it is close to river, has a low slope and few crevasses.

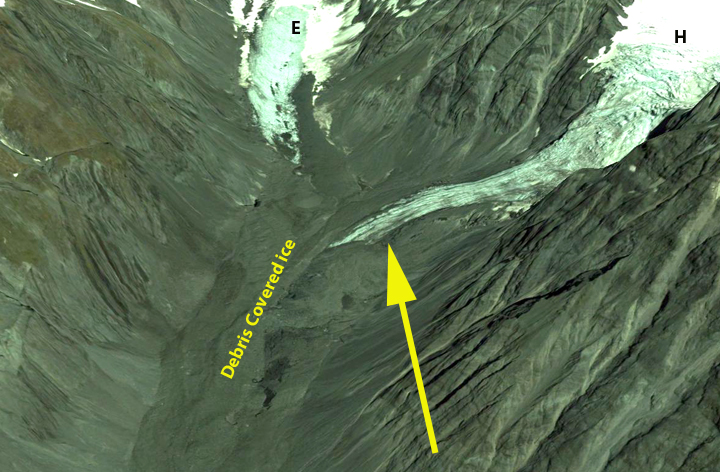
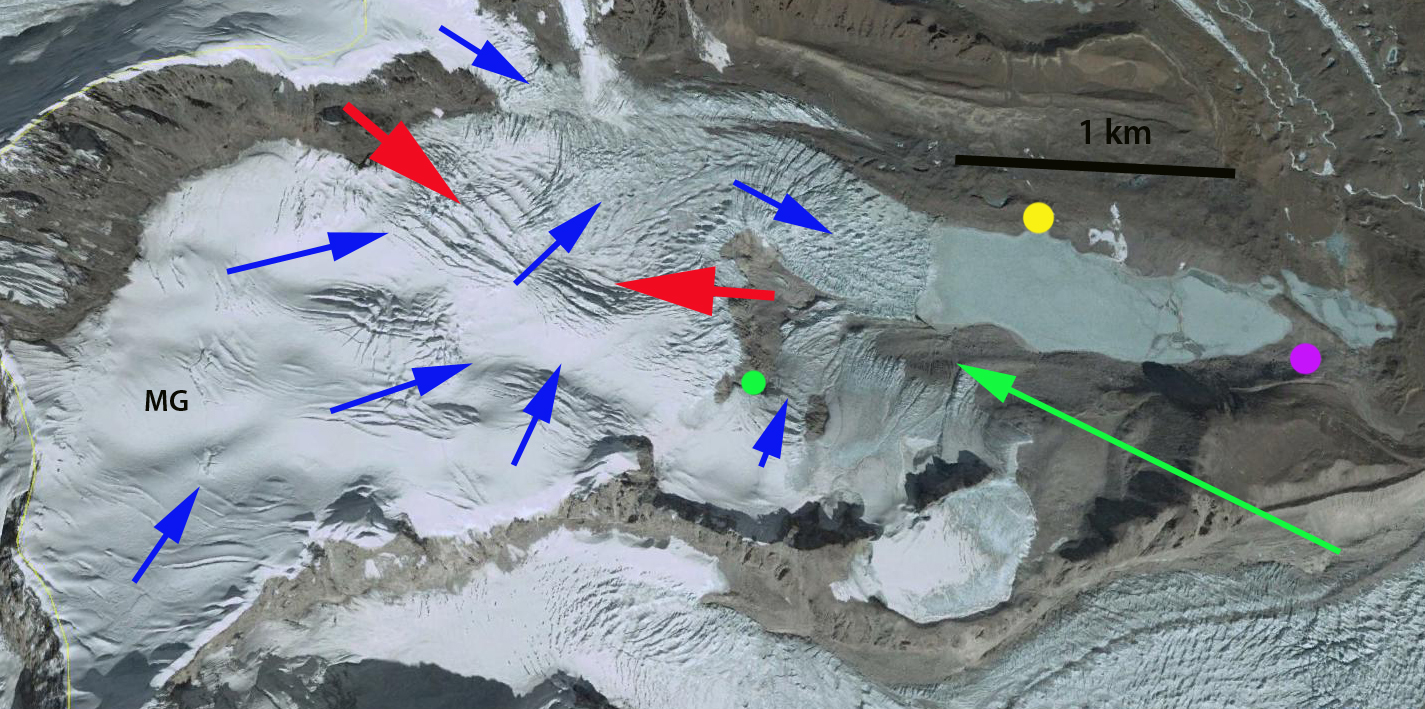
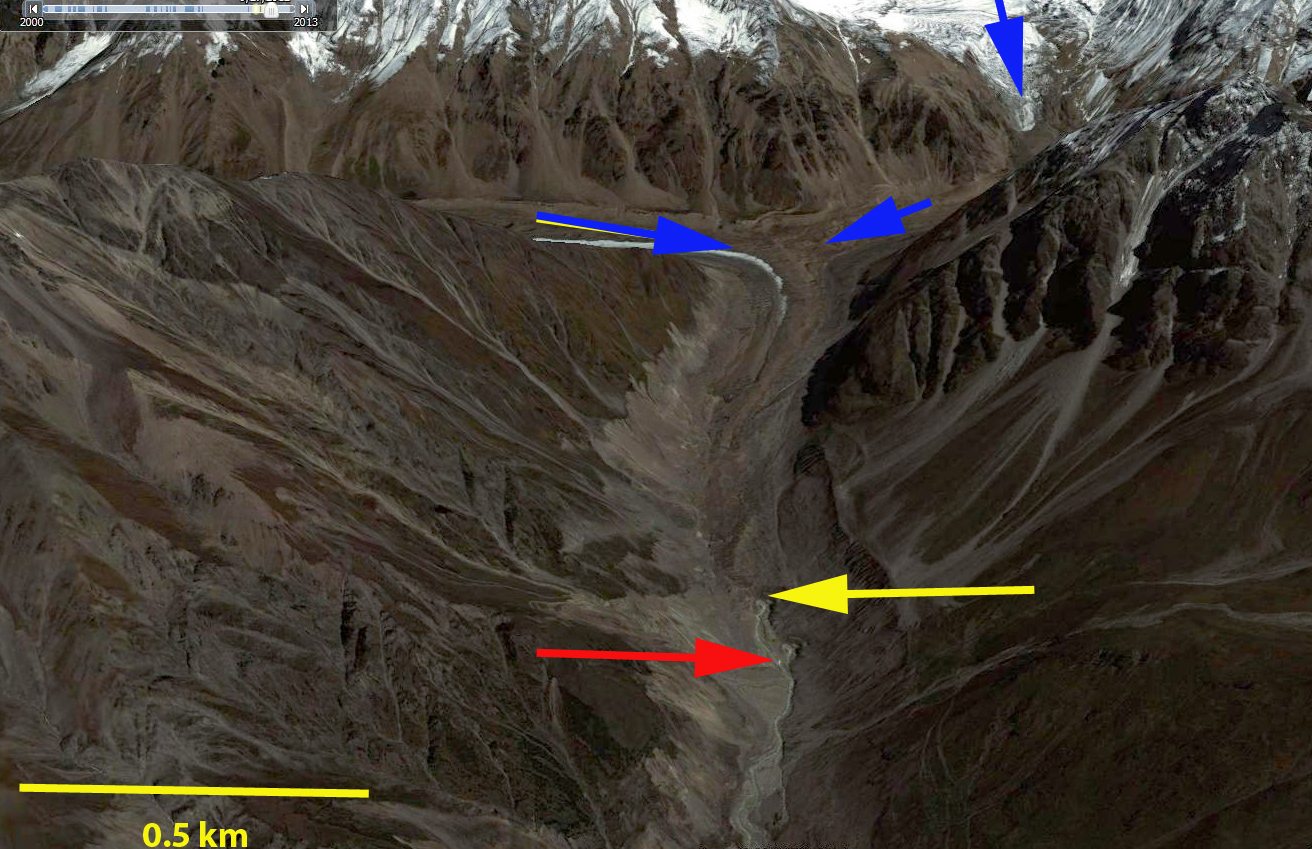
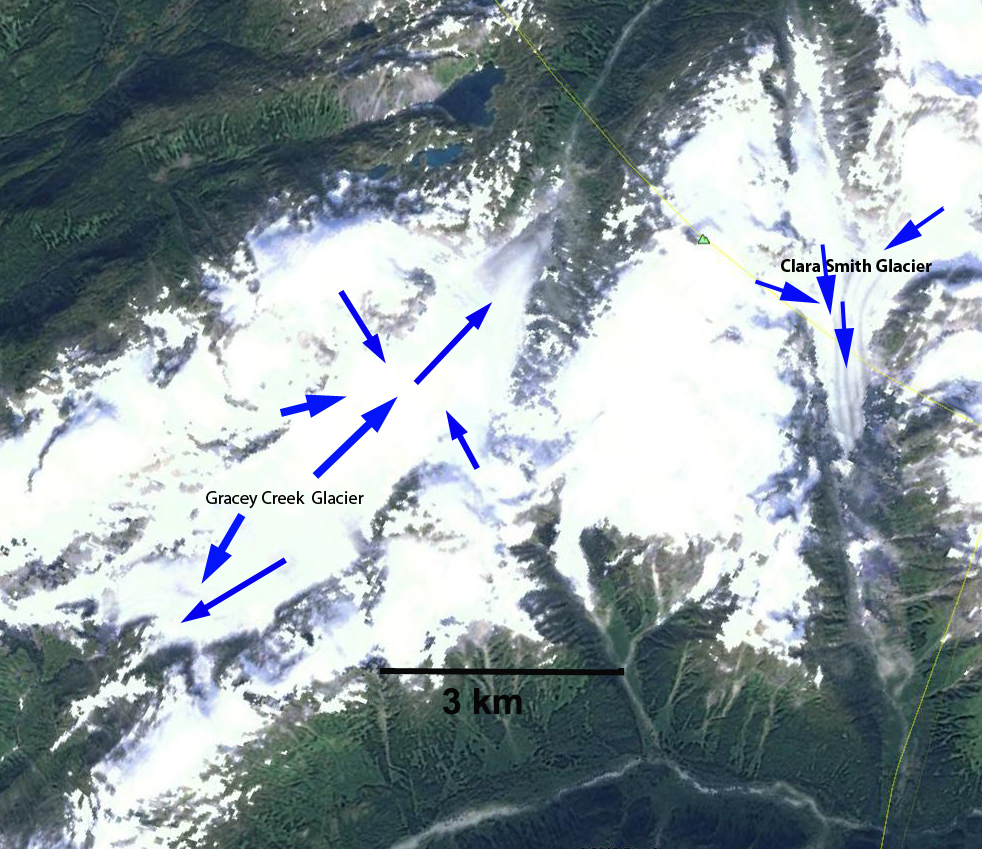
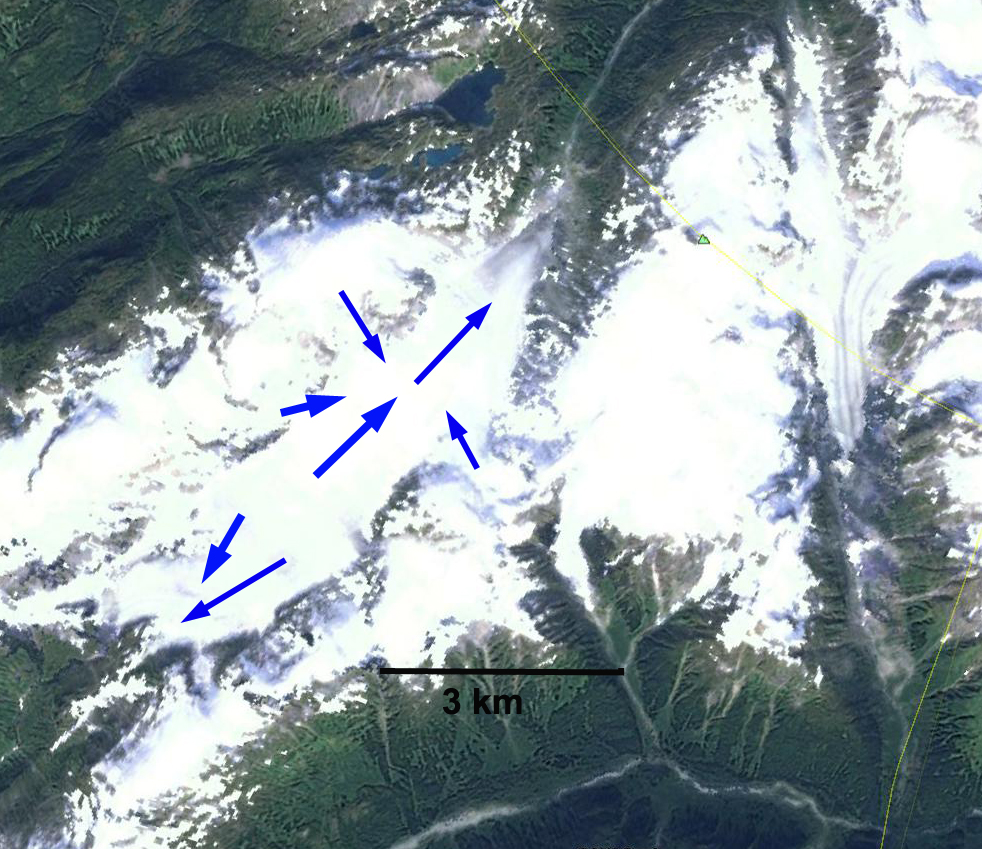
Google Earth Image
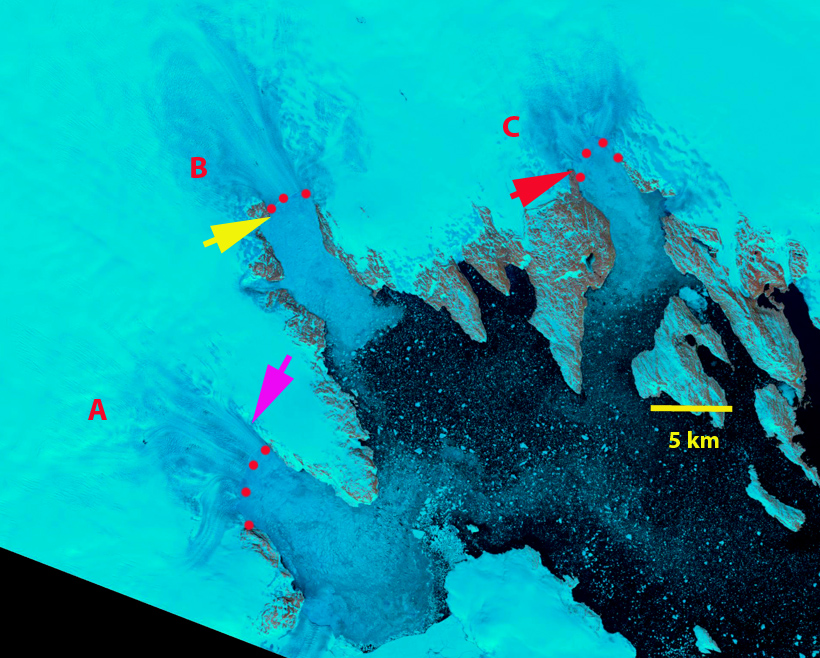
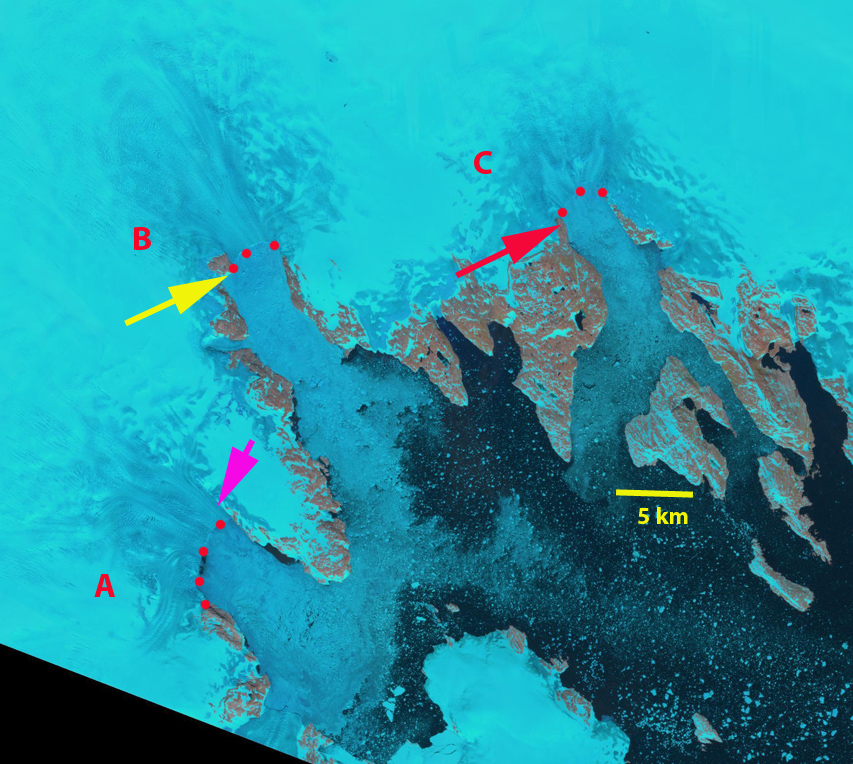
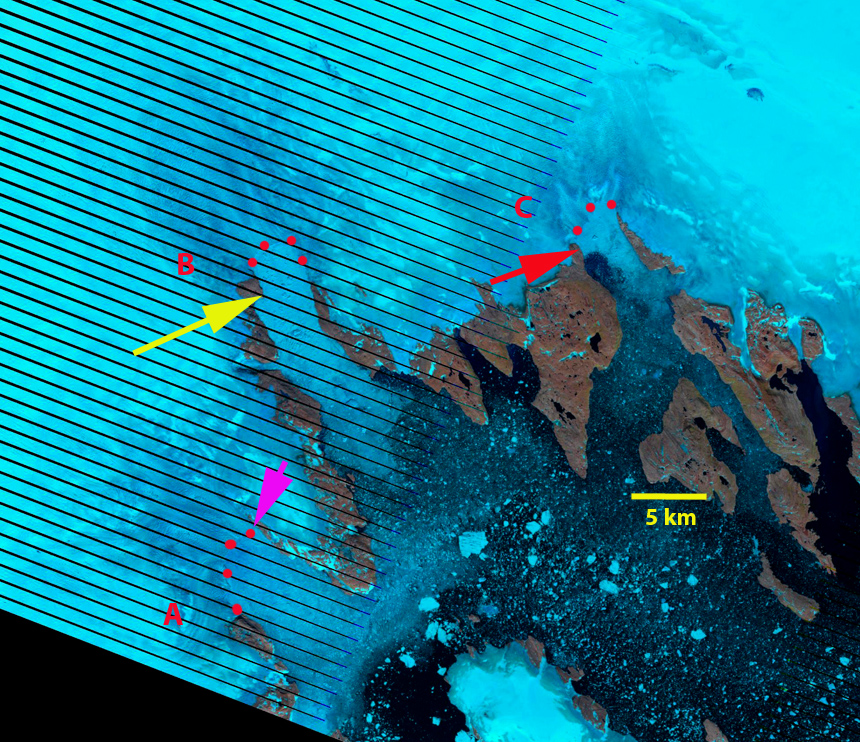
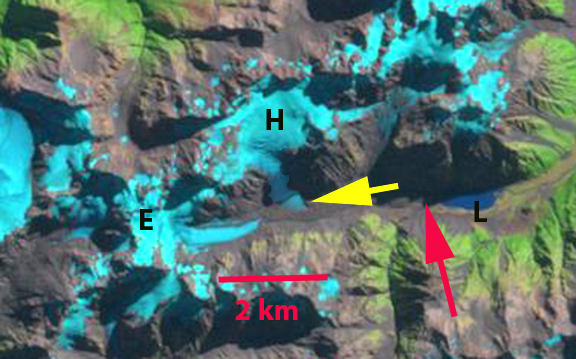
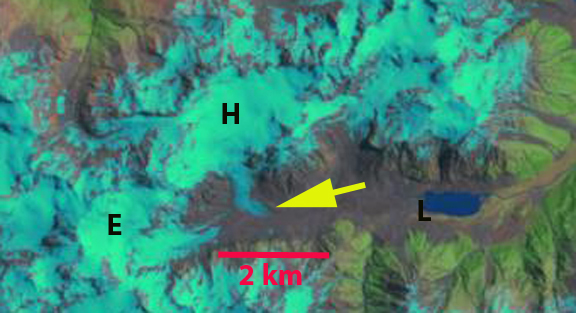
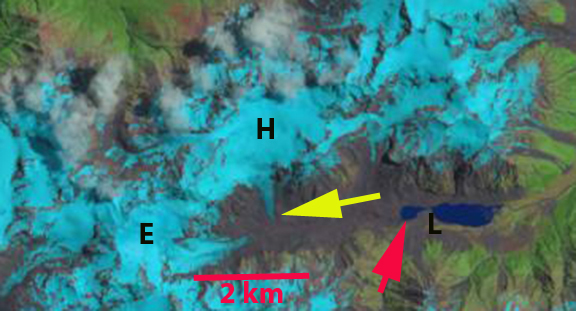
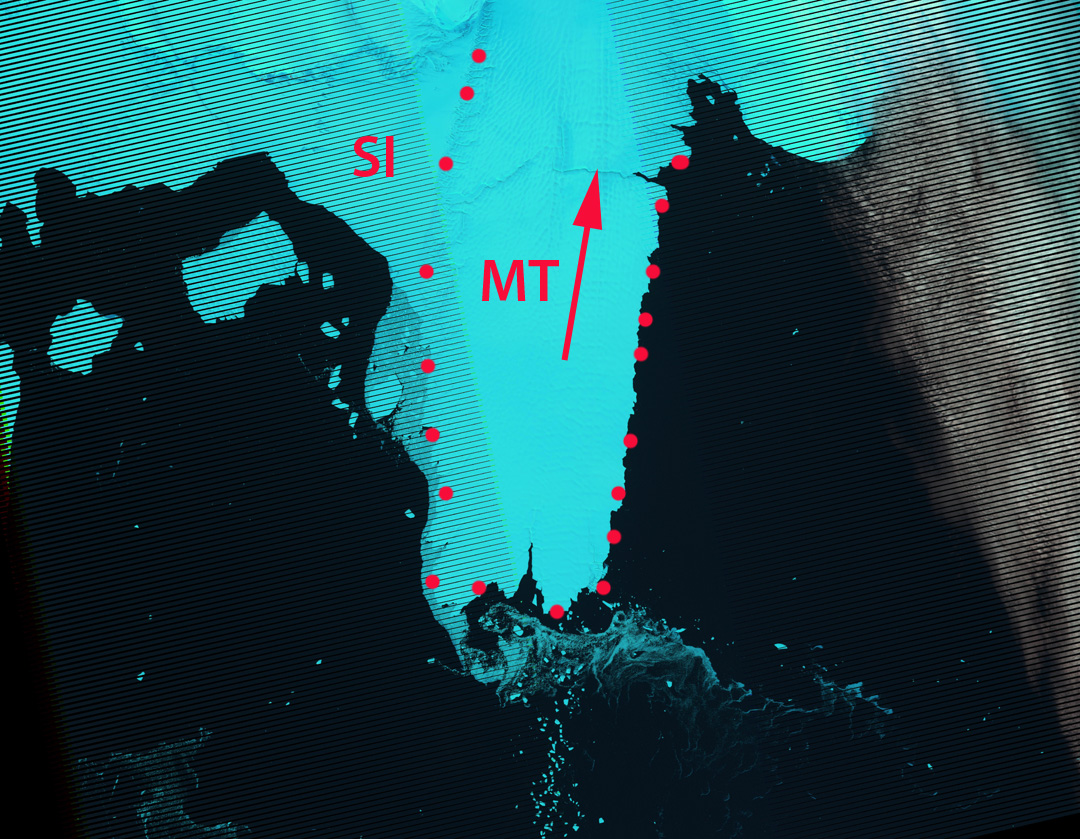
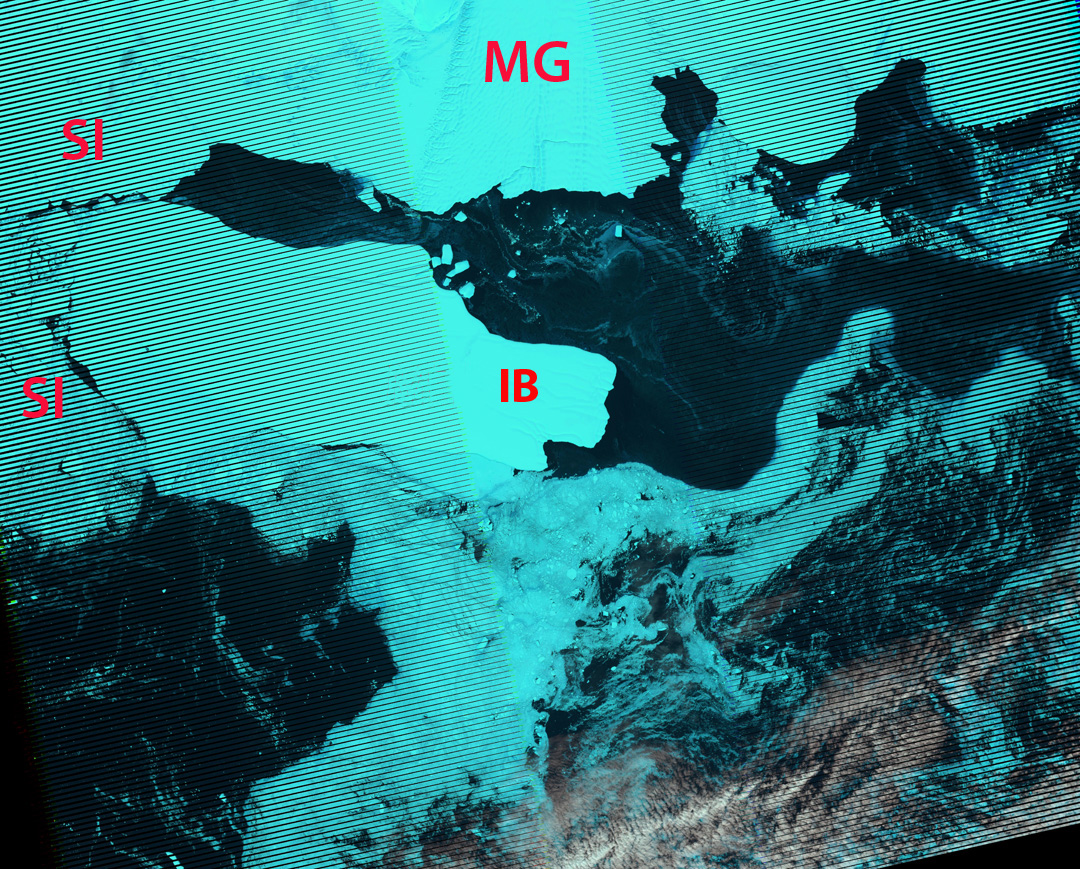
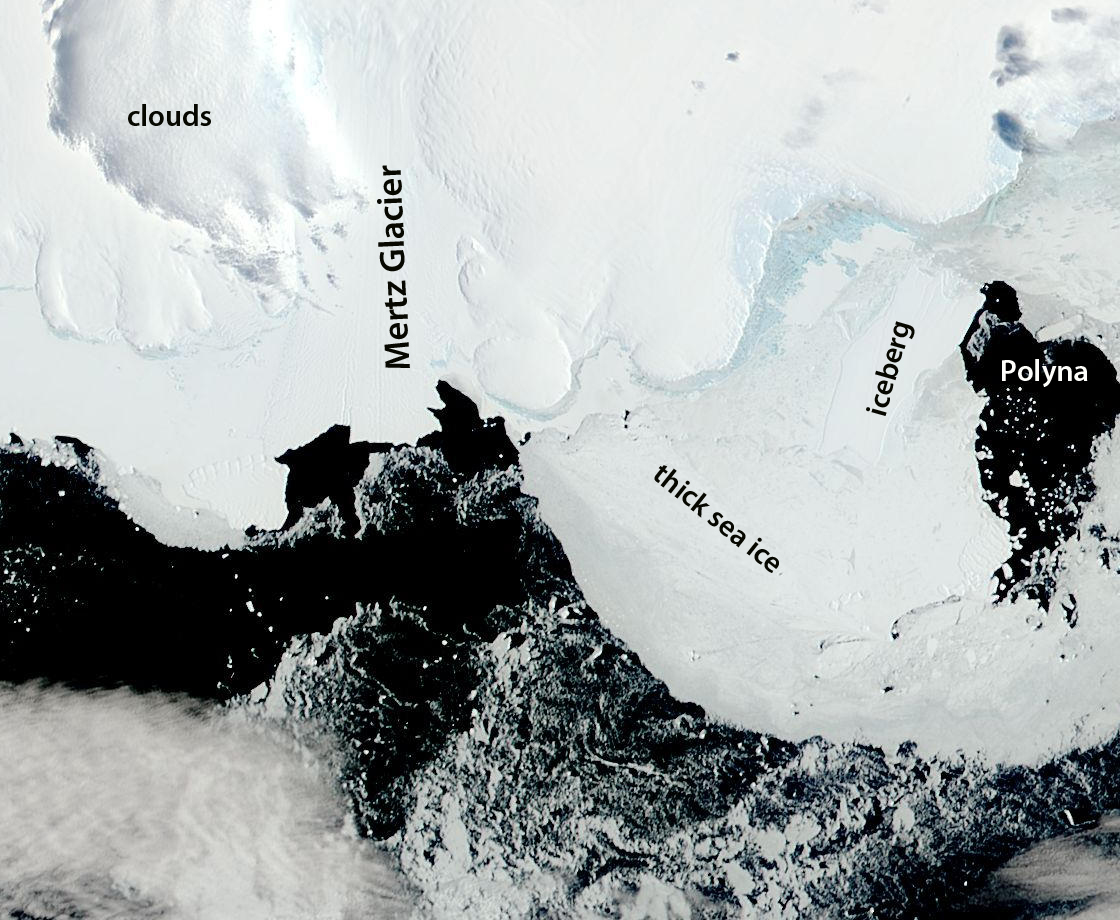
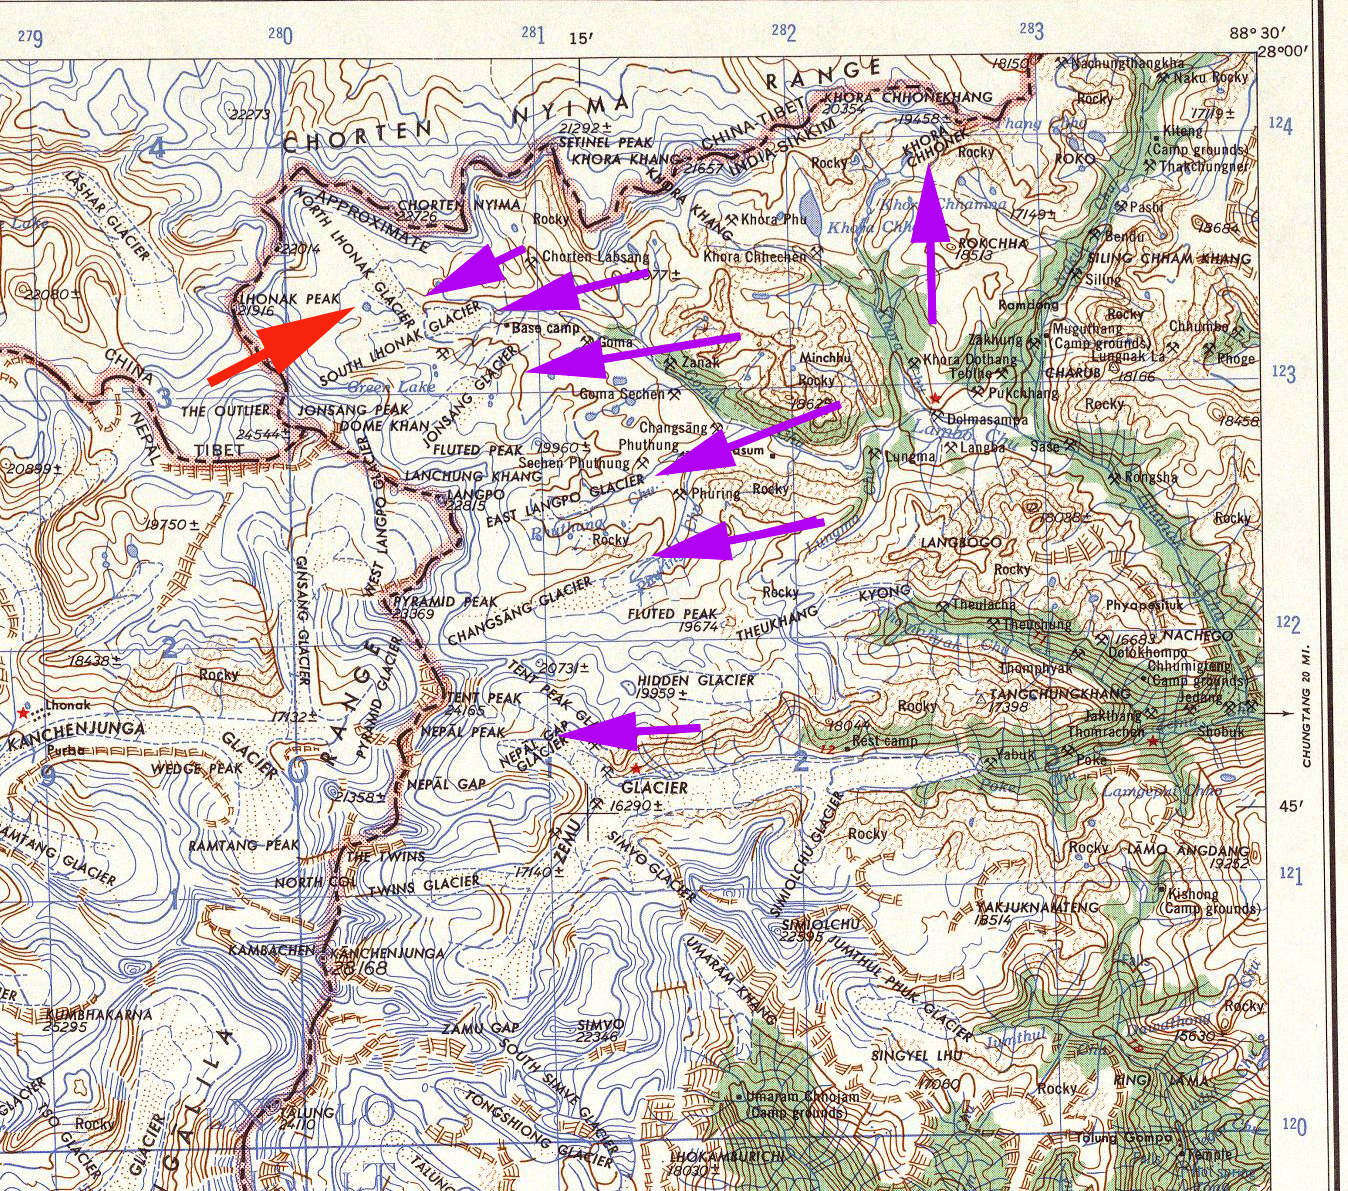
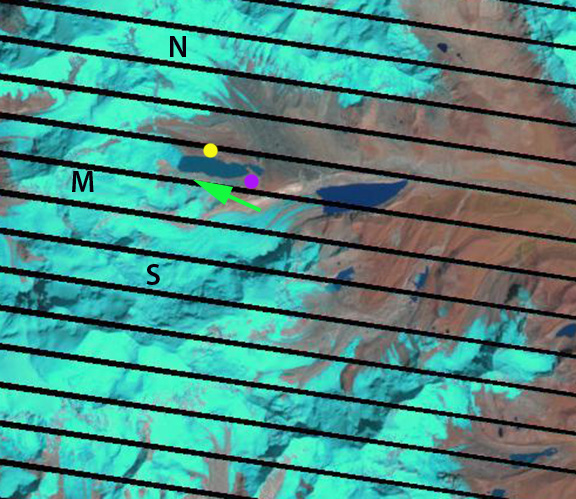
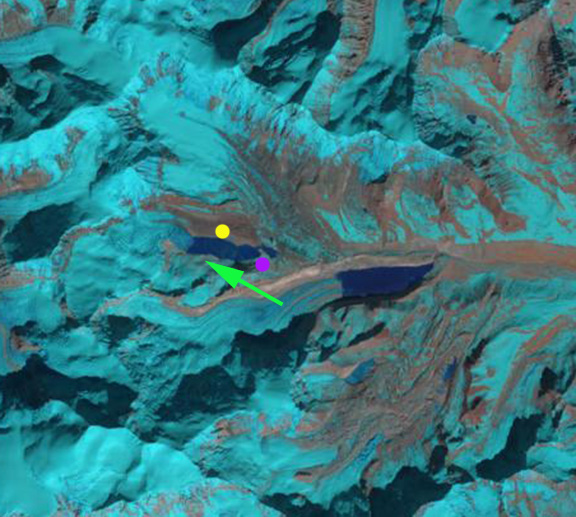
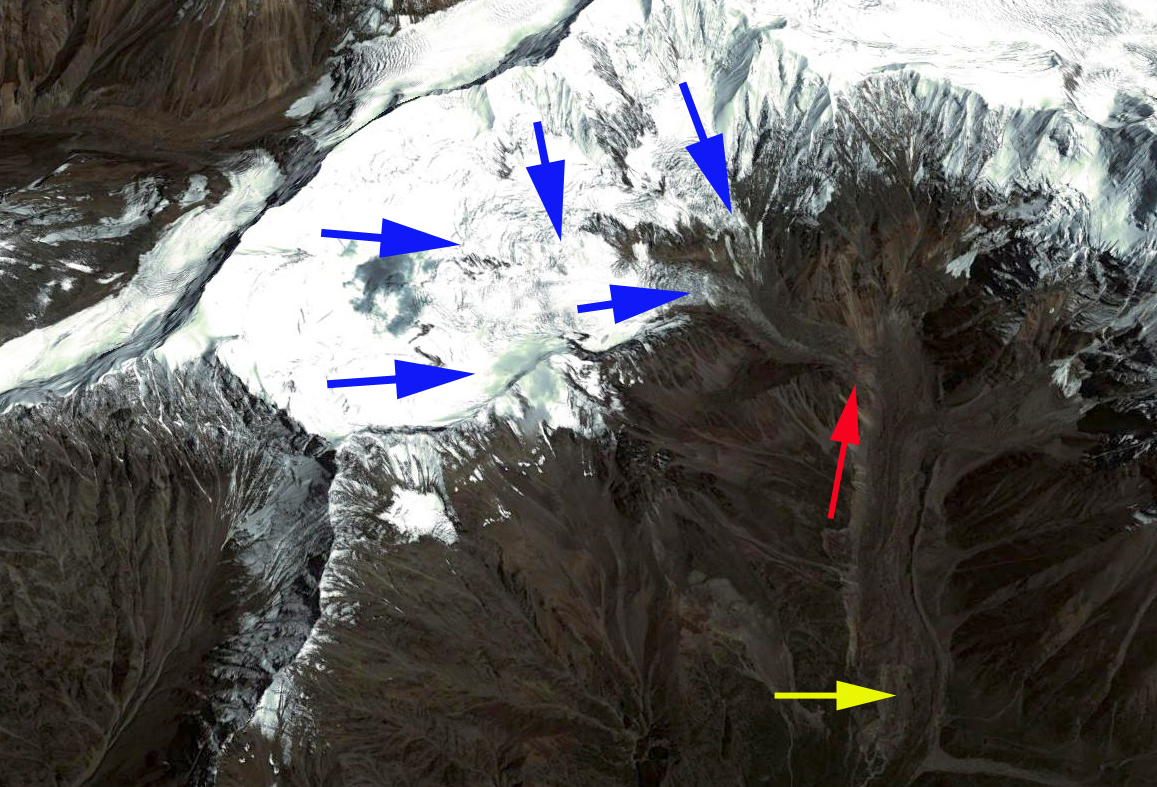
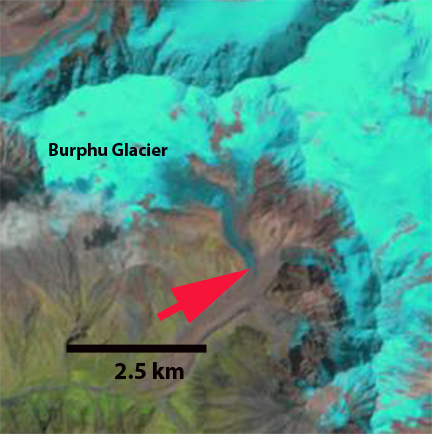
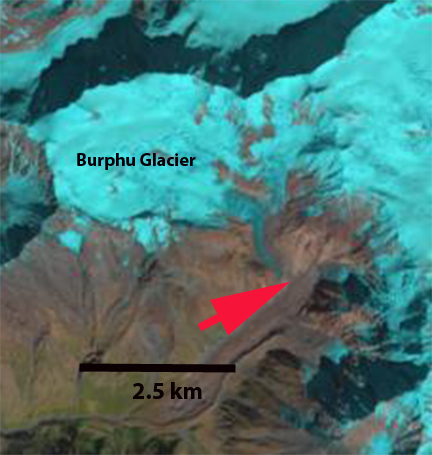
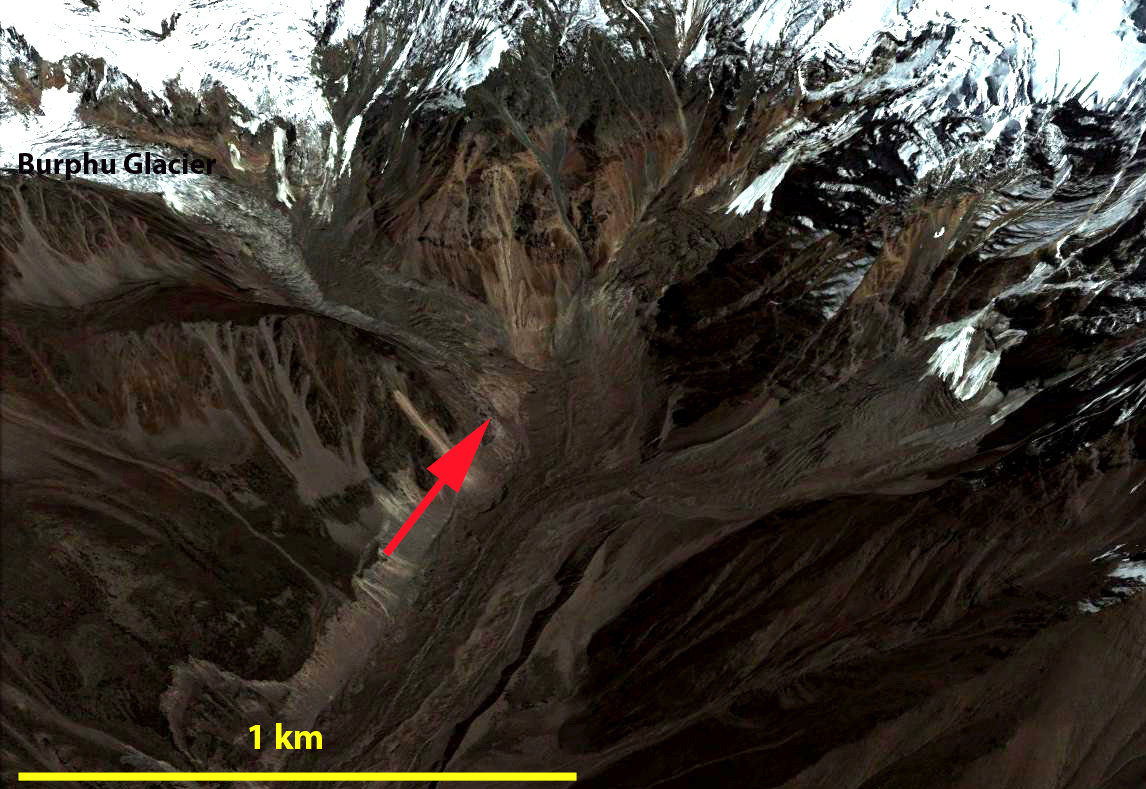
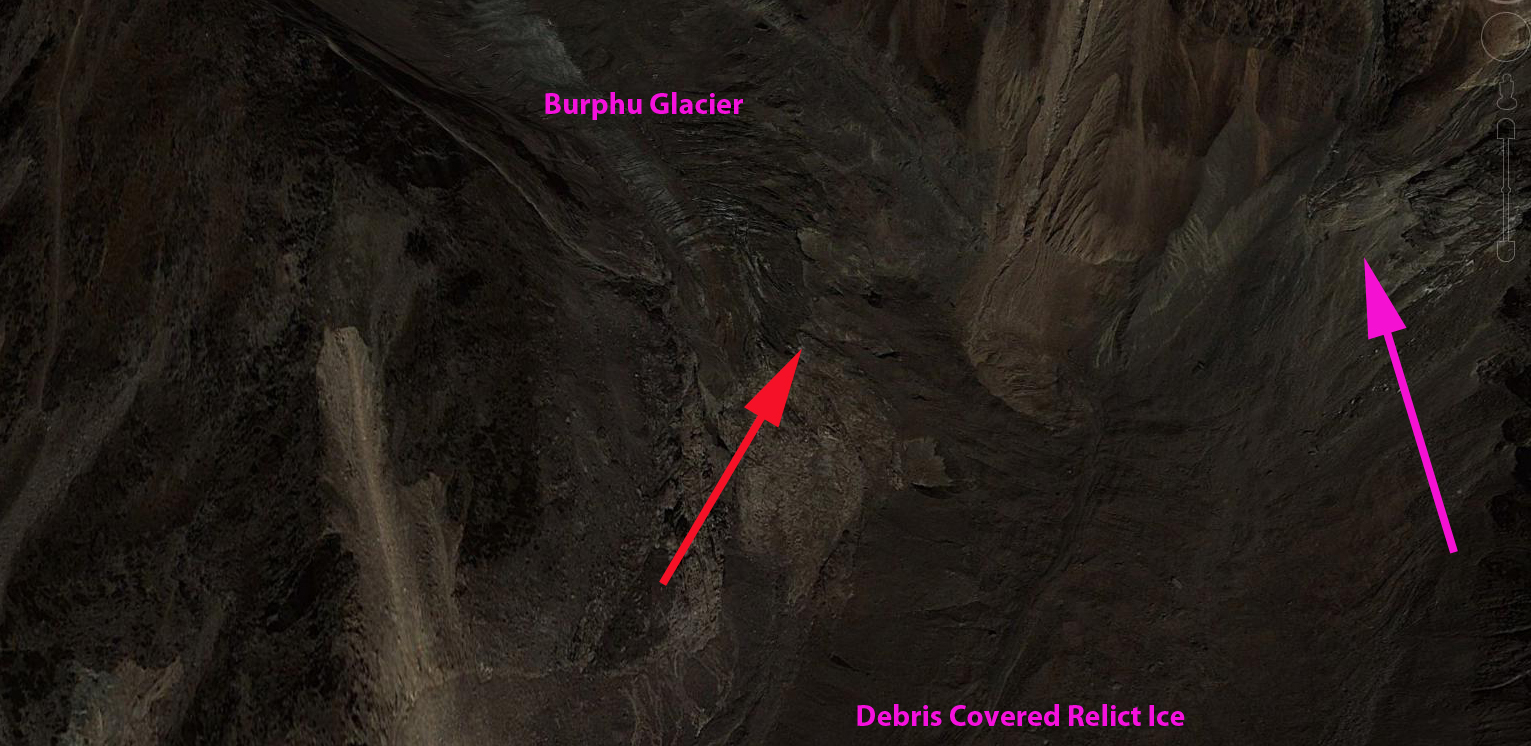
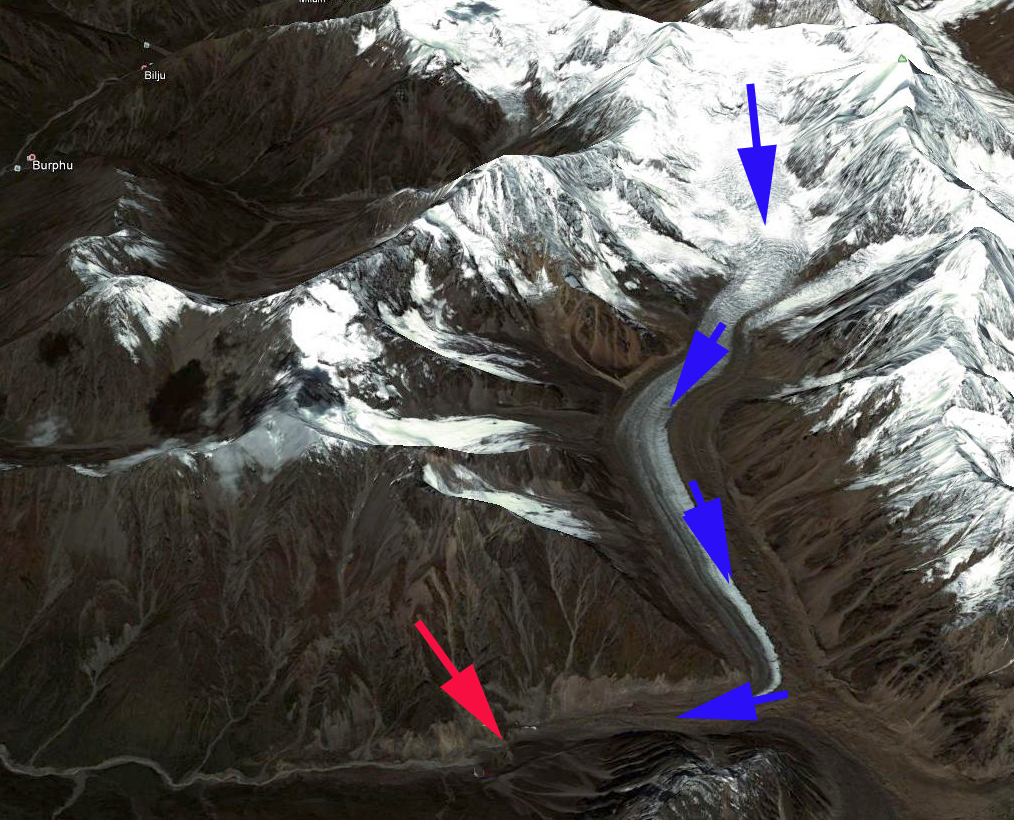
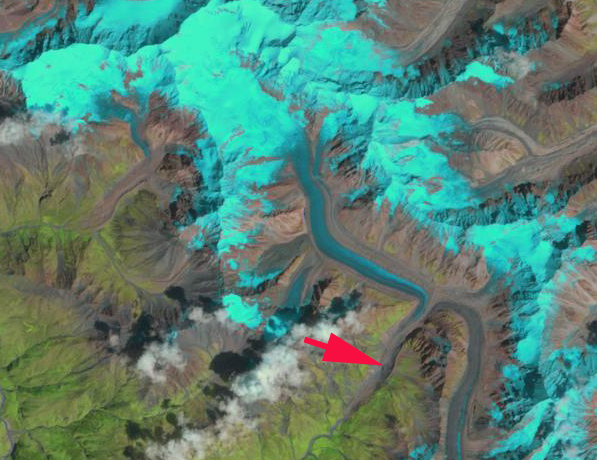
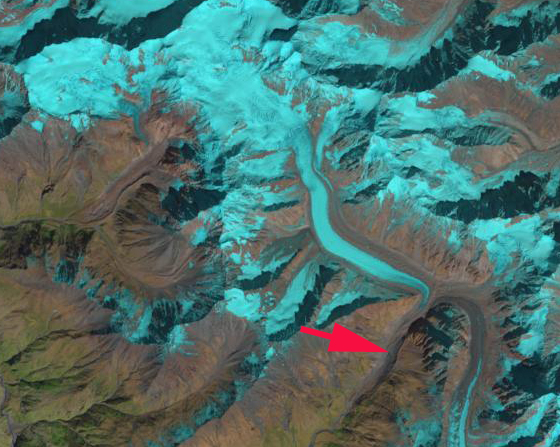
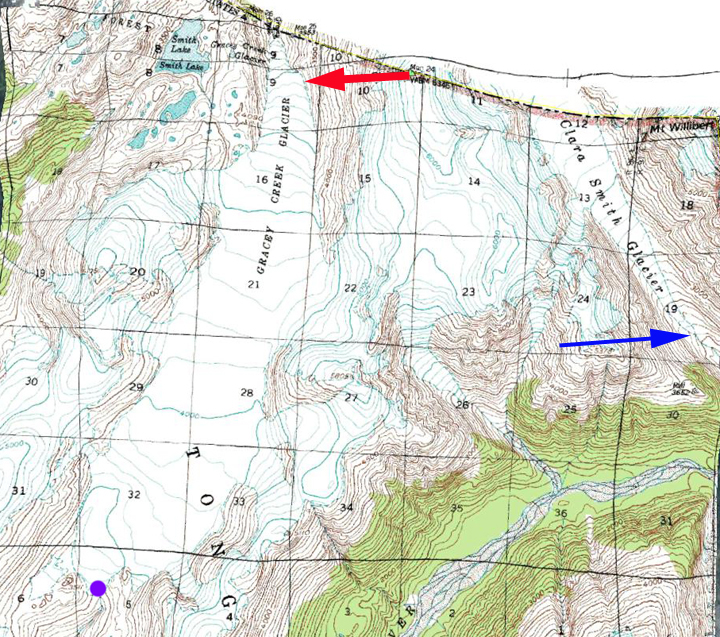
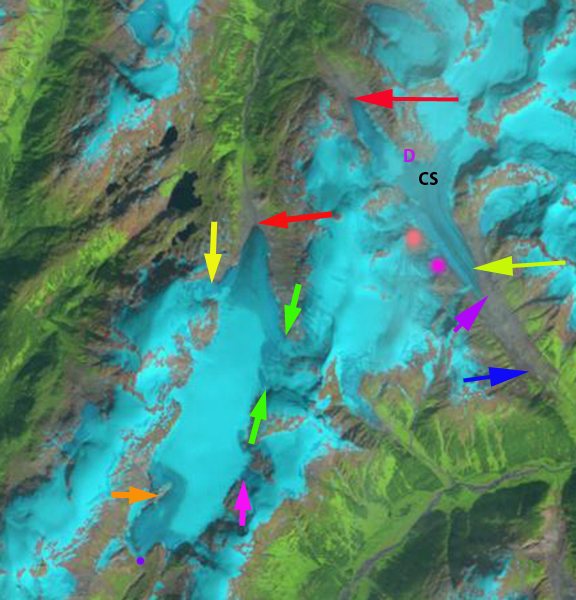
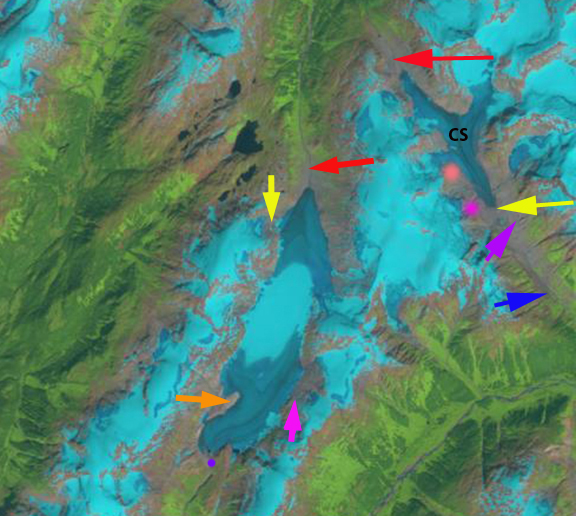
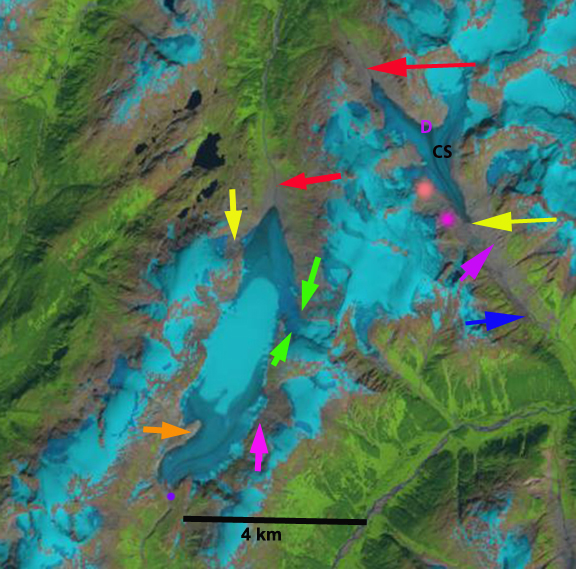
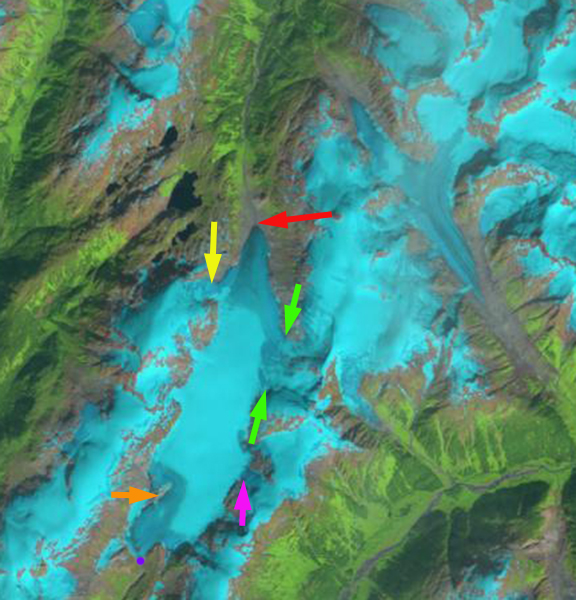
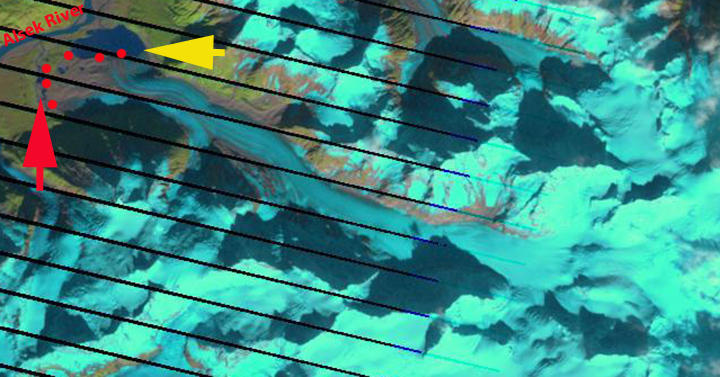
In 1984 the glacier ended as a piedmont lobe separated from the river by meters. Today the terminus has retreated into a lake basin at the terminus. Here we examine Landsat imagery from 1984, 2011 and 2013 to identify retreat and lake development. In 1984 there is no lake at the terminus, red dots indicate glacier margin. The terminus particularly on the northwest side is debris covered. The yellow and red arrows indicate locations where the terminus is in 2013 and where new lakes have developed. The pink arrow indicates the end of a tributary that has fed the Walker Glacier. By 2004 the Google Earth imagery indicates a lake that is 400 m wide and 1500 m long. By 2011 the lake on the north side of the terminus is well developed, yellow arrow, but on the west side of the terminus no lake exists, red arrow. By 2013 the new lake is 750 m wide and 1800 m long. The glacier has retreated 800 m since 1984 on the north side, yellow arrow. A narrow lake has now developed on the west side. The combination of lakes indicates that the entire terminus lobe in the lake basin will soon be lost. The terminus remains quite debris covered, has a gentle slope and is relatively uncrevassed; hence, it is stagnant and will collapse-melt away. The last image is from Colorado River & Trail Expeditions , that shows low glacier slope looking north across new lake. This is similar to the collapse of glacier termini in proglacial lakes such as nearby East Novatak Glacier, Grand Plateau Glacier and Yakutat Glacier. 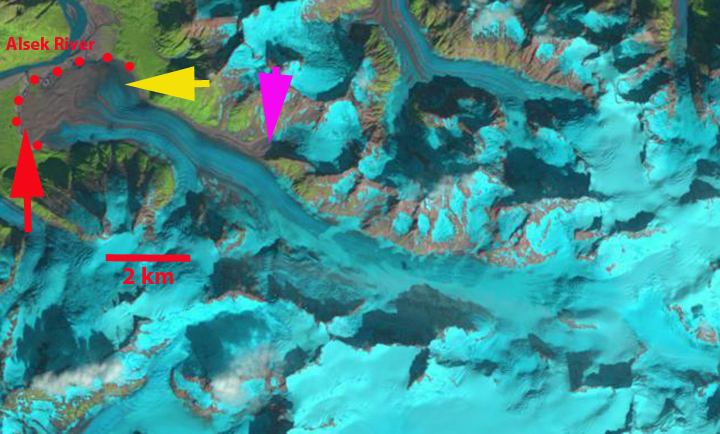
1984 Landsat image
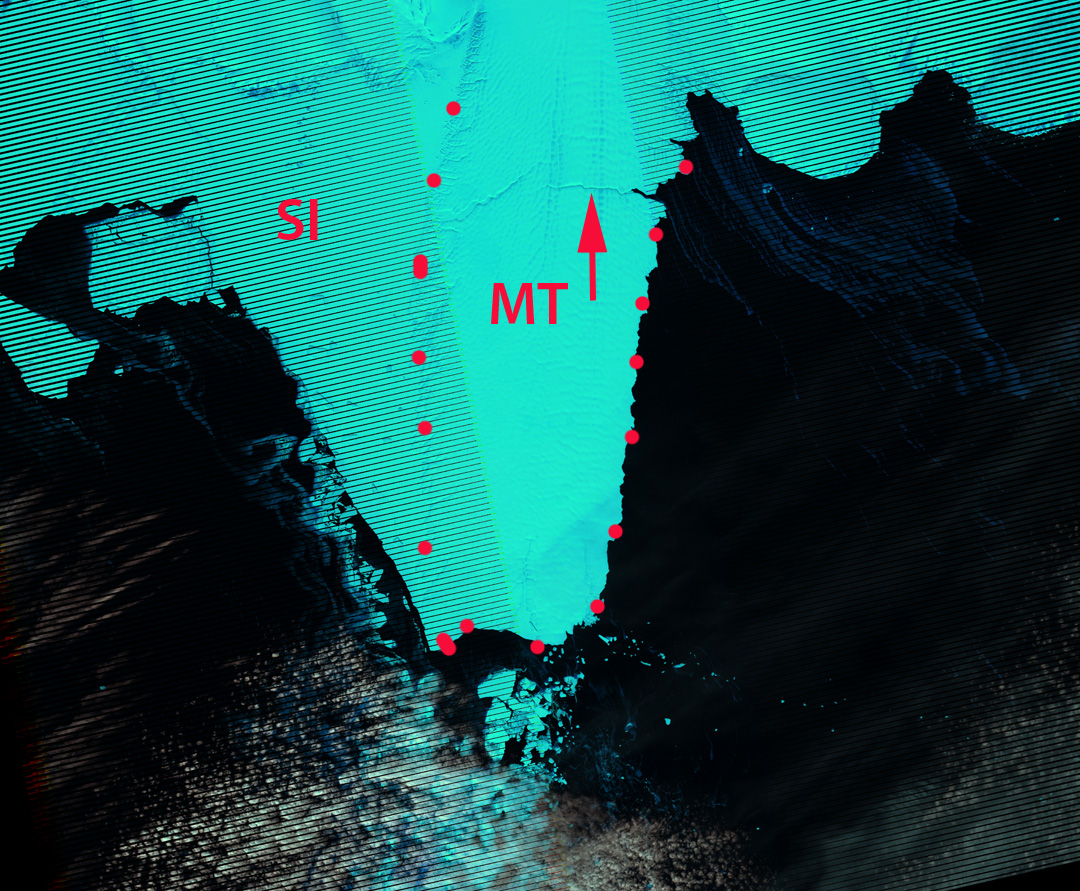
2011 Landsat image
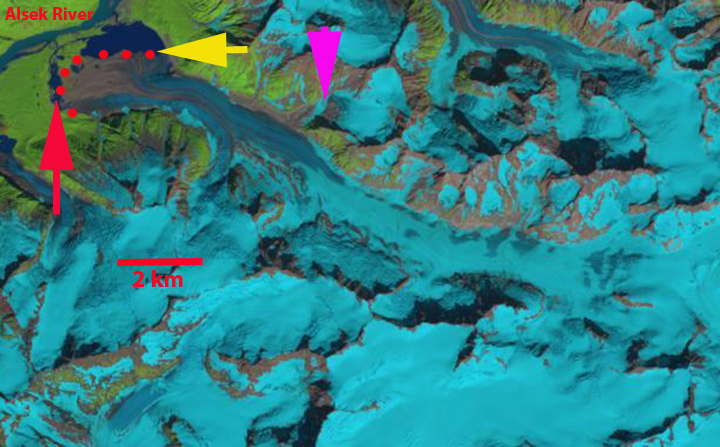
2013 Landsat image

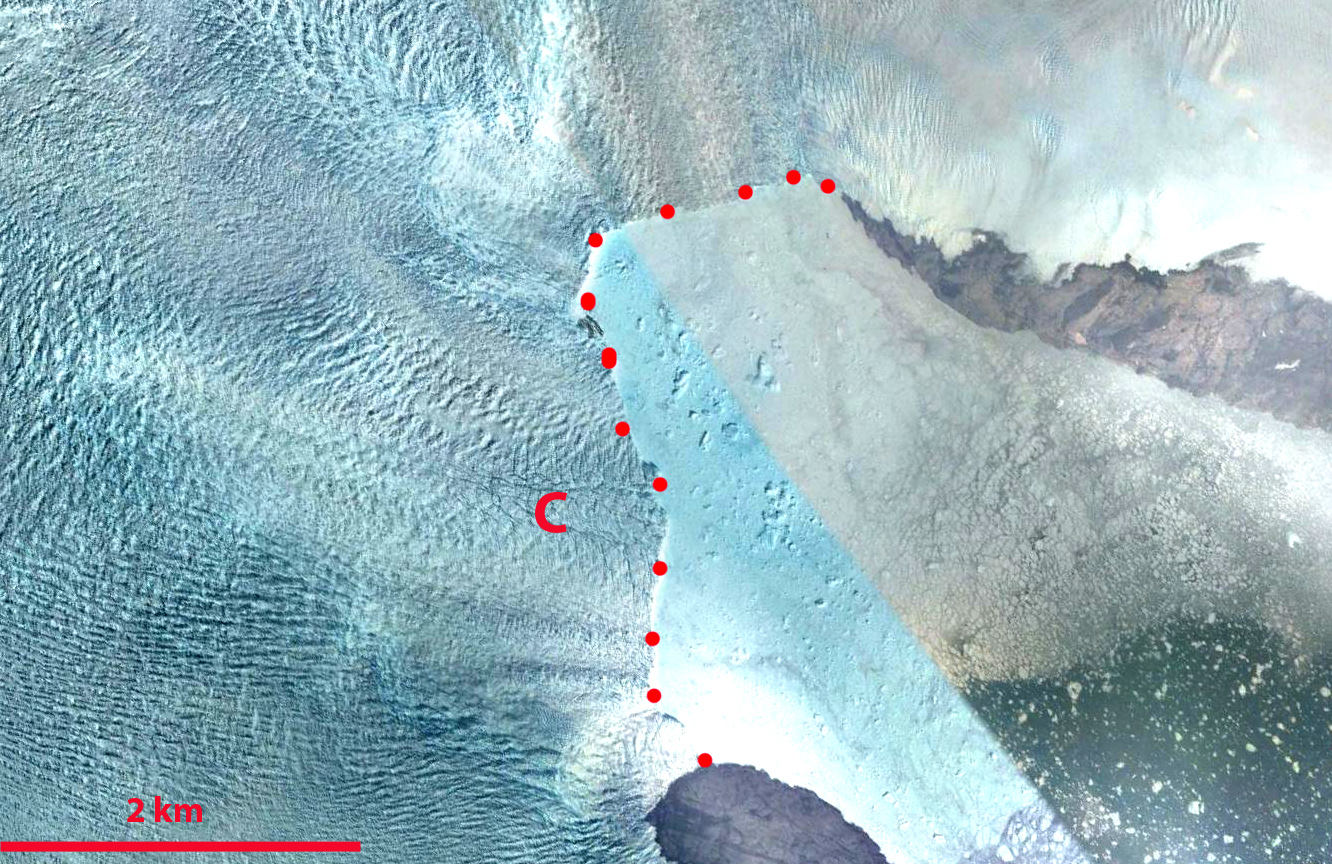
Google Earth image from 2004
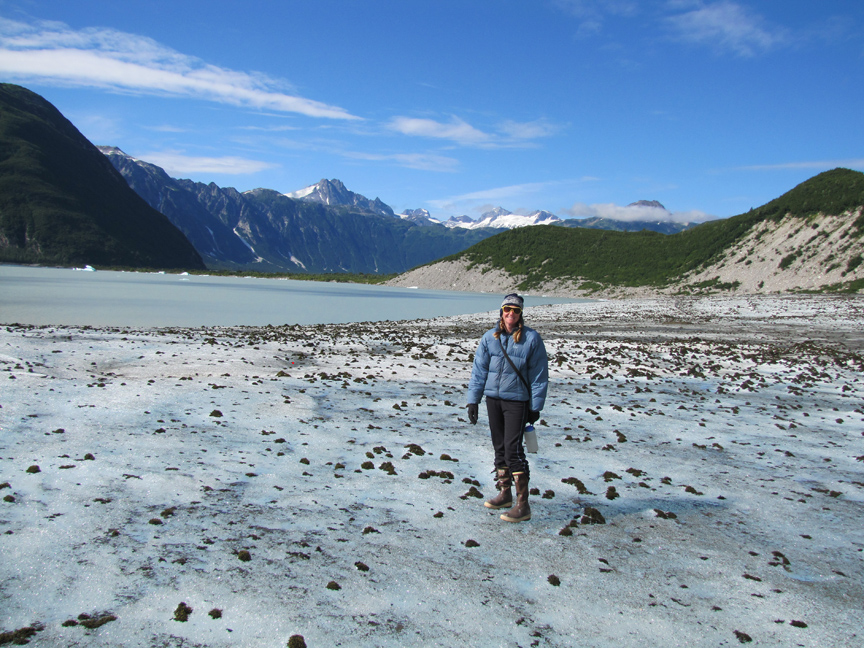
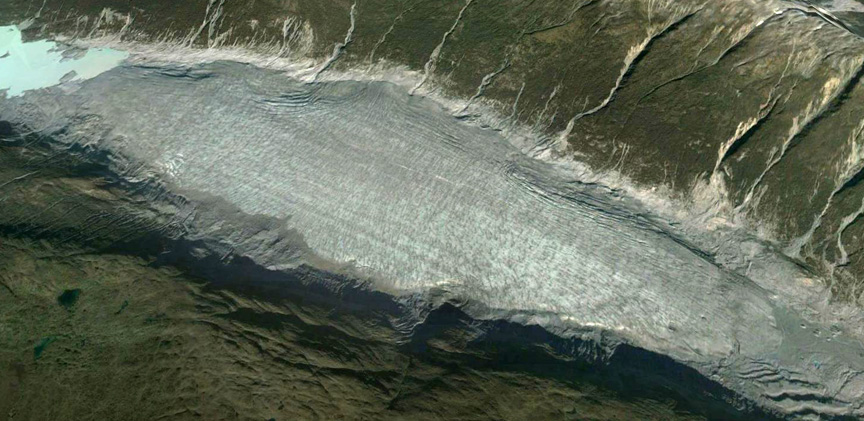
Colorado River & Trail Expeditions image-note low glacier slope looking north across new lake.