Blåmannsisen Outlet Glacier Retreat, northern Norway

Blåmannsisen is the fifth largest ice cap in Norway, just ahead of Hardanger in the Inventory of Norwegian Glaciers published by NVE in 2012. The ice cap is not tapped for hydropower and has not been the target of much research as a result from the NVE, second image is from NVE report. The ice cap outlet glaciers drain into a number of lakes. The NVE inventory indicates a reduction in area of the ice cap during the 20th century from 124 to 87 square kilometers. There is no change indicated for the 1961 to 1999 period. In the last 20 years retreat has become evident. blamannsisenblamannsisen terminusHere we examine the terminus change of two outlets one on the north side of the ice cap (yellow arrow) and one at the southwest corner (red arrow). For the northern outlet glacier three changes are emphasized. First at the terminus at the arrow point the expansion of the terminus lake from a small pond in 1994, 100 by 100 m, to a lake that is one kilometer long and 100 to 400 m wide in 2011. The progression of the lake development is steady with expansion evident in 1999 and 2006. The second noteworthy item is the ice connection of the outlet glacier to the main ice cap, yellow dots. This connection has narrowed from 1300 m in 1994 to 800 m in 2011. This in particular is apparent above Point A, which in 1994 is a bedrock knob surrounded by the glacier, a small nunatak. In 1999 Point A is still a nunatak. In 2006 the nunatak is just barely surrounded by ice, and in 2011 it is now just the extension of a ridge. The problem with the narrowing connection to the main ice cap, due to thinning ice, is less inflow, which will hasten the retreat. As is evident in 2006 and 2011 this glacier is becoming dynamically separated from the ice cap and has little retained snowcover of its own. Notice that as you cross onto the main ice cap there is no snowcover. This terminus has retreated 150 m on the west side and 400 m on the east side since 1994.

The second terminus is at the red arrow and has retreated from 1994 to 2011 exposing a new bedrock peninsula in the lake at the tip of the red arrow. This bedrock exposure at the tip of the red arrow was surrounded by glacier ice in 1994 and 1999. By 2006 the terminus had pulled back from this area, the bedrock exposure had expanded and ice no longer passed south of it either. By 2011 next to the letter B a small bedrock knob is being exposed at the terminus by continued retreat. The retreat of this outlet has been 500 m on the south side and 200 m on the north side since 1994. This glaciers retreat began later than at another northern Norwegian glacier Engabreen and more slowly and less dramatically than southern Norway glaciers such as Tunsbergdalsbreen, as noted by the annual frontal change studies of NVEblamannsisen 1994
1994 Landsat image
blamannsisen 1999
1999 Landsat image

blamannsisen 2006
2006 Landsat image
blamannsisen 2011
2011 Landsat image

Mittivakkat, Greenland and Lemon Creek Glacier, Alaska transient snowline paper

Mernild et al (2013) is a new paper that has authors from several countries that I am co-author on with Knudsen, Malmros in Denmark, Hanna from UK, Yde currently in Norway and Mernild in Chile. The key items here are using the snow line observed on any particular melt season day (transient snowline=TSL) as input for mass balance assessment. This paper examines how similar the migration of the TSL is from year to year, and how ablation rate can be determined using it, when field data can be used for validation. The first two images are figures from the paper of Lemon Creek Glacier and Mittivakkat Glacier illustrating the TSL at various dates. A second key is that if the progression is relatively repeatable towards the end of the melt season, than the equilibrium line altitude (ELA) can be determined, snowline at the end of the melt season, which is a key mass balance variable. Clouds often obscure the ELA from satellite image assessment, and this allows appropriate extrapolation. The figure below needs more data to determine the consistency and nature of the TSL variation at the end of the melt season, the ELA is the top of the parabola. lemon creek base map4
Base map of Lemon Creek Glacier in 2003 with colored lines indicating various dates of the TSL.

fig 3 aw
Base map of Miitivakkat Glacier in 2012 with colored lines indicating various dates of the TSL.

tsl-ela
Progression of the TSL approximated with a second order Polynomial, to help derive the ELA.

A good example of the utility is an examination of the Landsat 8 imagery from this summer. Alaska had a warm and relatively clear weather period that provided a rare chance to examine the TSL in three consecutive satellite passes on June 14, June 21 and June 30. This period began with the glacier almost completely snow covered, red dots indicate TSL, red arrow indicates the 6/30 TSL. On June 14 the TSL was at 775 m within a couple of hundred meters of the terminus. By 6/21 the TSl had moved up the northwest side of the glacier 1.5 km to an altitude of 900m. On June 30th the TSL was at 975m two kilometers from the terminus. This progression up the northwest side of the glacier is typical. At the start of July the glacier is still 90% snowcovered. The Juneau Icefield Research Program is on this glacier in early July and field work will be critical to identifying snow depths above the TSL, that the TSL will transect later in the summer identifying ablation. The yellow arrow indicates the formation of Lake Linda, a meltwater lake that forms on the glacier, the expansion from June 14 to June 30 is evident. Pictures of the lake from JIRP during self arrest practice are gorgeous. More detailed examination of the longer term change of Lemon Creek Glacier and Mittivakkat Glacier has been completed.lemon creek 165-2013
June 14 2013 Landsat image

lemon creek 172-2013
June 21 2013 Landsat image

lemon creek 181-2013
June 30 2013 Landsat image

Juneau Icefield Glacier Terminus Change from Landsat 5 1984 to Landsat 8 2013

The Juneau Icefield Research Program (JIRP) has been examining the glaciers of the Juneau Icefield since 1946. Until the NASA Landsat program began field measurements and aerial observations were the only means to observe the glaciers of the icefield. For more than 40 years it was Maynard Miller, U of Idaho, who led this expedition that has trained so many of today’s glaciologists, today it is Jeff Kavanaugh, U of Alberta. Given the difficult weather conditions that produce the 4000+ square kilometers of glaciers, this was not a task that could be done comprehensively. Here we examine the changes from the August 17, 1984 Landsat 5 image to the June 21, 2013 image from newly launched Landsat 8. Landsat 5 was launched in 1984, Landsat 8 launched in 2013. The Landsat images have become a key resource in the examination of the mass balance of these glaciers (Pelto, 2011). The August 17th 1984 image is the oldest Landsat image that I consider of top quality. I was on the Llewellyn Glacier with JIRP on the east side of the icefield the day this image was taken. On June 21, 2013 JIRP’s annual program had not begun, but the field season is now underway once again observing fin and reporting from the field across this icefield.
Post reblogged at NASA

First we have the two reference images of the entire icefield that indicate the location of the 12 main glaciers we focus on here. Followed by a chart indicating the amount of terminus change, 14 glaciers have retreated and one has advanced.
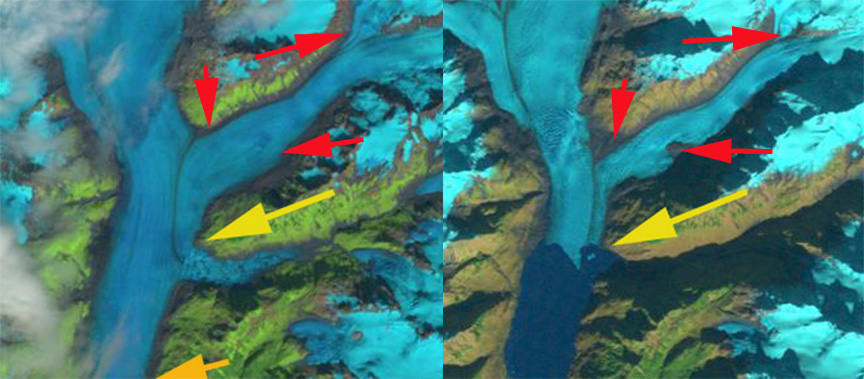
This is followed by 12 closeup glacier by glacier comparisons of the terminus, with the 1984 image always on the left and 2013 on the right, the 1984 margin is marked with red dots and the 2013 with yellow dots. This is an update to an examination of the Juneau Icefield terminus changes from 1948 to 2005. There are also links to more detailed discussions for each glacier, as the focus here is on the 1984 to 2013 changes visible in the images here. The images were first overlain in ArcGIS and the terminus change based on three measurements one at the glacier terminus midpoint, one each halfway to the margin from the mid-point. The exception is the Taku Glacier which is based on the JIRP field measurement mean and the Llewellyn where three measurements are made on each of the two termini, the average is then rounded to the nearest 100 m. The ongoing retreats reflects the long term negative mass balance of the glaciers with the exception of the Taku Glacier. The ongoing warming of our globe will continue to lead to retreat. The glaciers are all fed from the central portion of the icefield that always has a large snow covered area even at the end of recent warm summers.
juneau icefield 1984
August 17, 1984 Landsat 5 image: N=Norris, L=Lemon Creek, M=Mendenall, H=Herbert, E=Eagle, G=Gilkey, A=Antler, F=Field, LL=Llewellyn, Tu=Tulsequah, TW=Twin and T=Taku.

Juneau icefield 2013
June 21, 2013 Landsat 8 image

JIF terminus
1984-2013 chart of terminus change of individual glaciers from 1984 to 2013, see individual images below for the observed changes.

norris glacier change
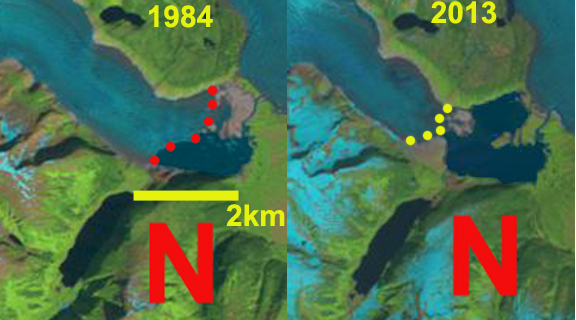
From 1984 to 2011 Norris Glacier has retreated 1100 m. The glacier terminus that has been ending in a proglacial lake for the last 40 years is now mostly grounded. Since 1984 the northern half of this lake has formed and the long term lake development is discussed in a more detailed discussion on Norris Glacier.

lemon glacier change
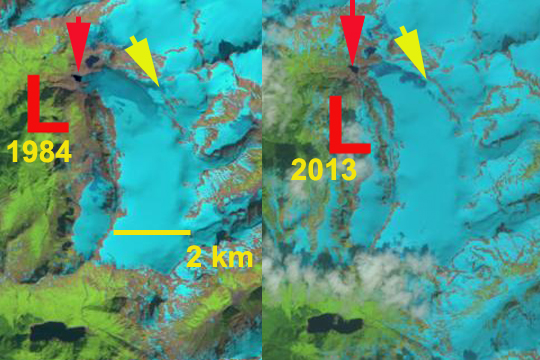
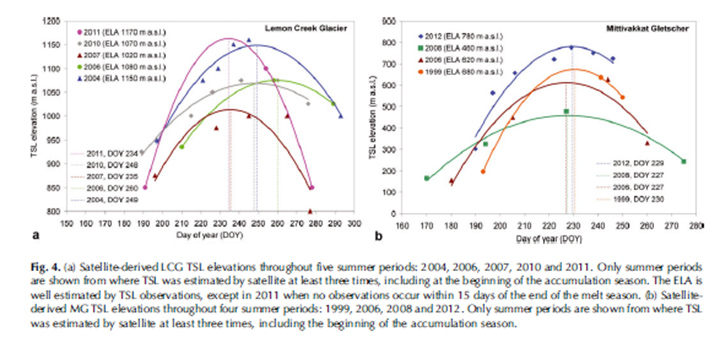
In 1984 Lemon Creek Glacier (L) has pulled back 300 m from a small lake it reached in 1984. Lemon Creek Glacier has a long term mass balance record that indicates more than 15 m of thinning from 1984 to 2012. This thinning is more dramatic than the 300 m retreat that has occurred. The yellow arrow indicates a tributary that no longer connects to the glacier.

mendenhall glacier change Mendenhall Glacier is the most visited and photographed terminus in the region. The glacier in 1984 ended at the tip of a prominent peninsula in Mendenhall Lake. By 2013 the terminus has retreated 1200 m, with an equal expansion of the lake. The red arrows indicate a tributary that decreased dramatically in width and contribution to the main glacier. This is the location of Suicide Basin, where a lake has formed the last two summers and then rapidly drained. A nice set of images of the glacier are provided by Matt Beedle.

herbert glacier change
Herbert Glacier has retreated 600 m since 1984. The width of the terminus has also declined. The red arrow indicates a tributary that no longer feeds the main glacier.

eagle glacier change 
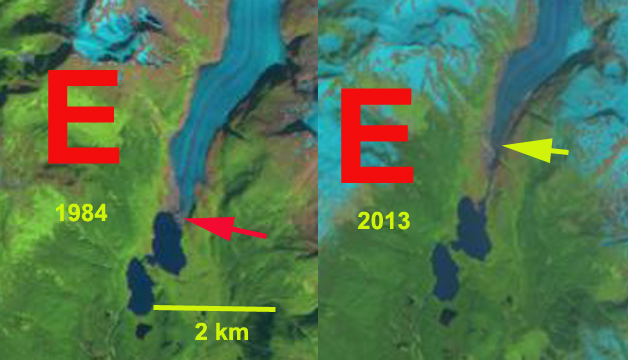
Eagle Glacier has retreated from the edge of a lake in 1984. The retreat of 1100 m is rivaled by the width reduction of the glacier in the lower 3 km. Eagle Glacier‘s ongoing retreat is examined in more detail.

gilkey glacier change 
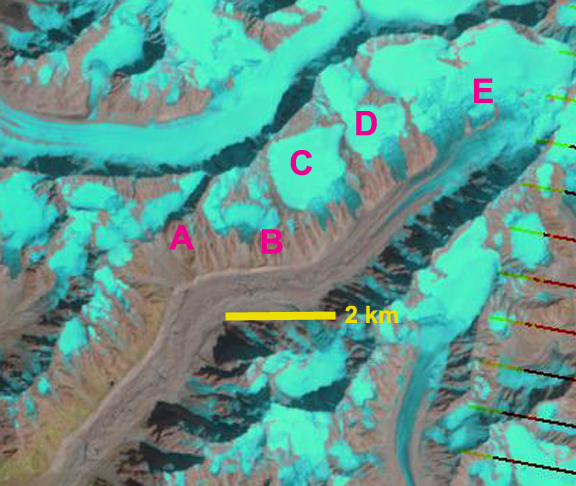
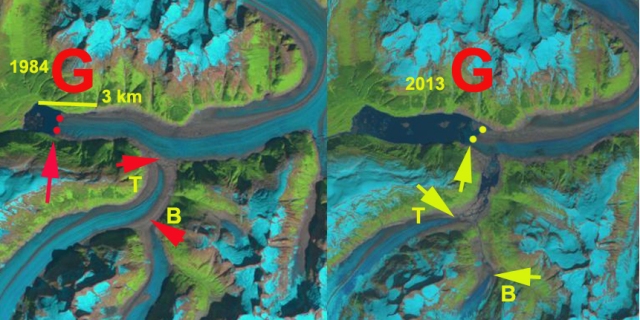
Gilkey Glacier had begun to retreat into a proglacial lake by 1984, the lake was still just 1 km long. A short distance above the terminus the Gilkey was joined by the sizable tributaries of the Thiel and Battle Glacier. By 2013 the glacier has retreated 3200 m, the lake is now 4 km long. Thiel and Battle Glacier have separated from the Gilkey Glacier and from each other. Thiel Glacier retreated 2600 m from its junction with Gilkey Glacier from 1984-2013 and Battle Glacier 1400 m from its junction with Thiel Glacier

antler glacier 2013 
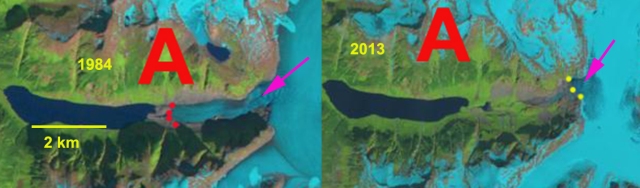
Antler Glacier is actually a distributary glacier of the Bucher Glacier, which in turns joins the Gilkey Glacier. As this glacier has thinned, less ice has overtopped the lip of the valley that Antler occupies. In 1984 Antler Glacier was 3 km long descending the valley to end near a proglacial lake, that it had recently occupied. By 2013 the glacier was just 400 m long, having lost 2600 m of its length.

field glacier change 
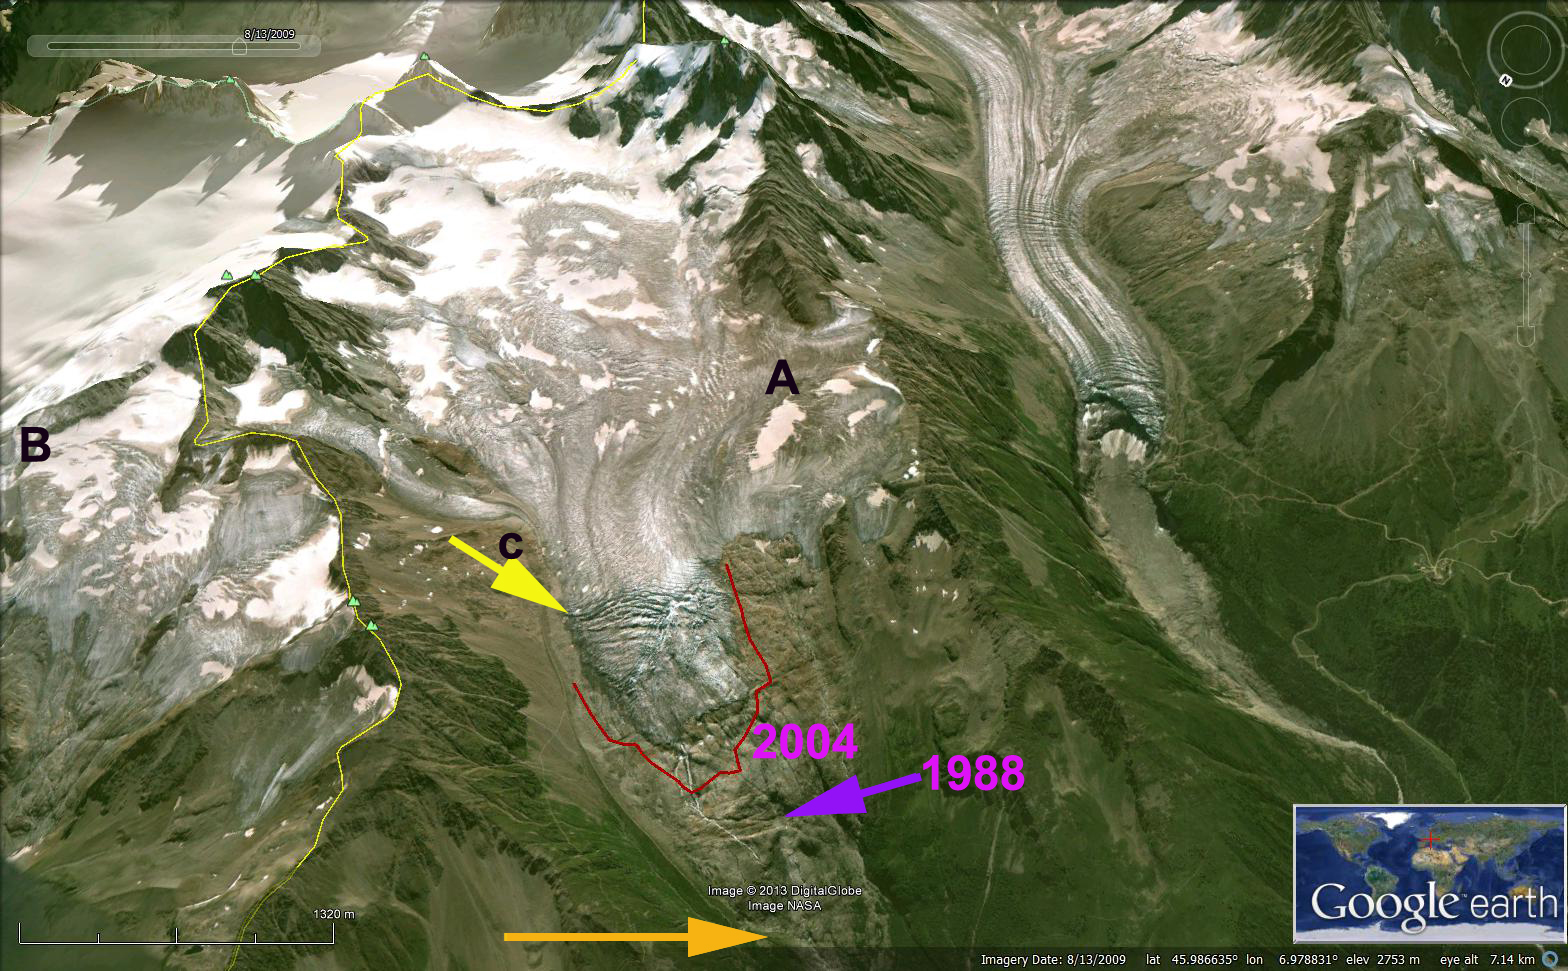
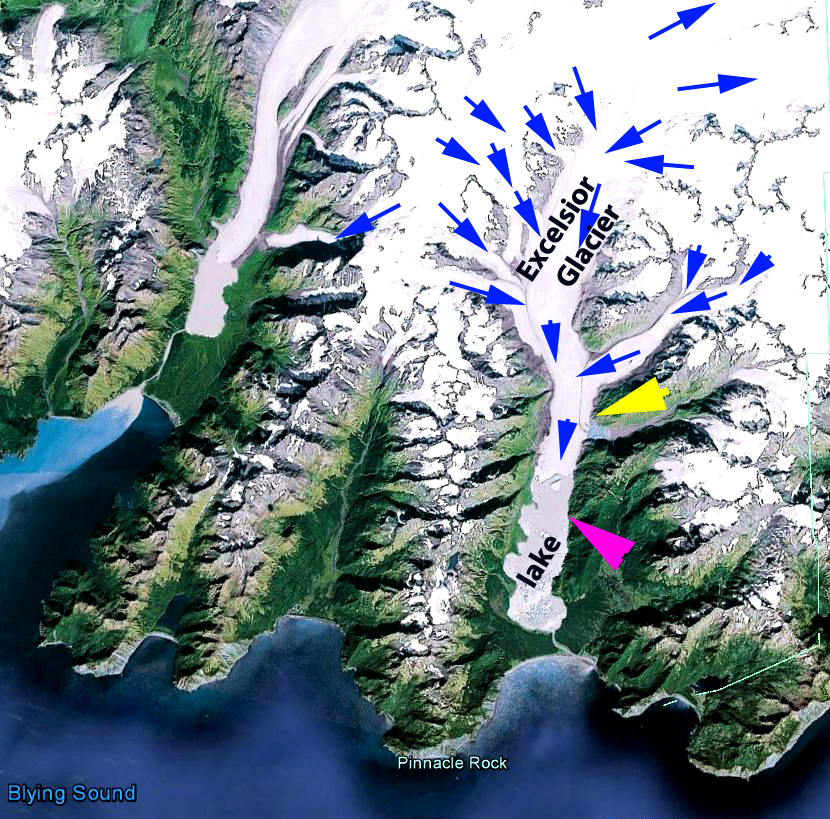
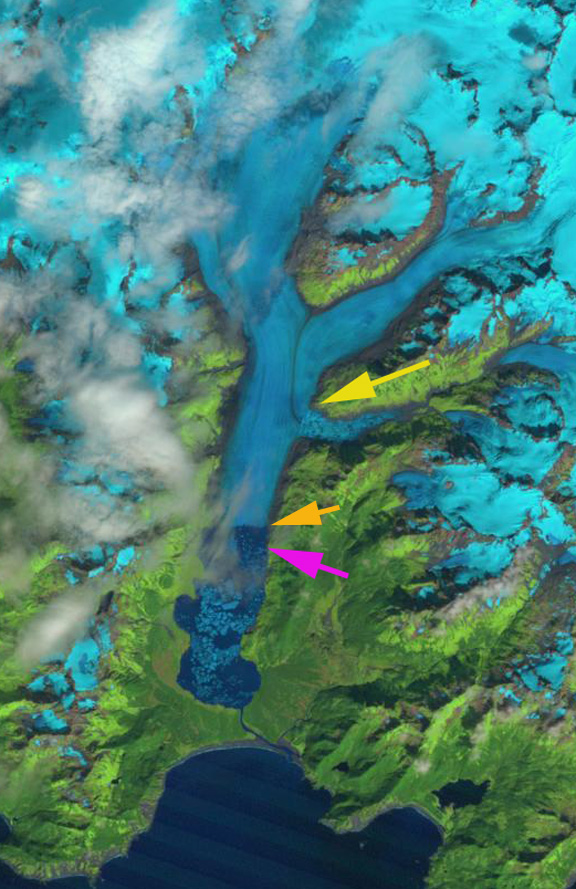
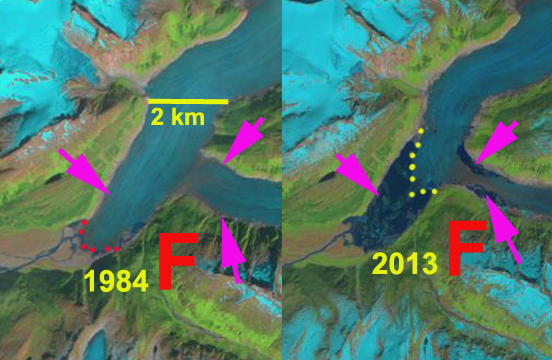
Field Glacier in 1984 ended at the edge of an outwash plain with a few glimpses of a lake developing near its margin. By 2013 a substantial lake has formed at the terminus and the glacier has retreated 2300 m. A lake has also developed at the first terminus joining from the east, most of the width of this glacier has been lost. It is clear that the two lakes will merge as the retreat continues.

lewellyn glacier change The second largest glacier of the icefield is the Llewellyn Glacier which is in British Columbia. The glacier has several termini, here we examine two of them that have retreated 900 m from 1984-2013. Hoboe Glacier is another terminus that has been examined, but not in this post. This has led to formation of new lakes, and water level changes in existing lakes. Matt Beedle has examined the recent changes at the terminus.

tulsequah glacier change 
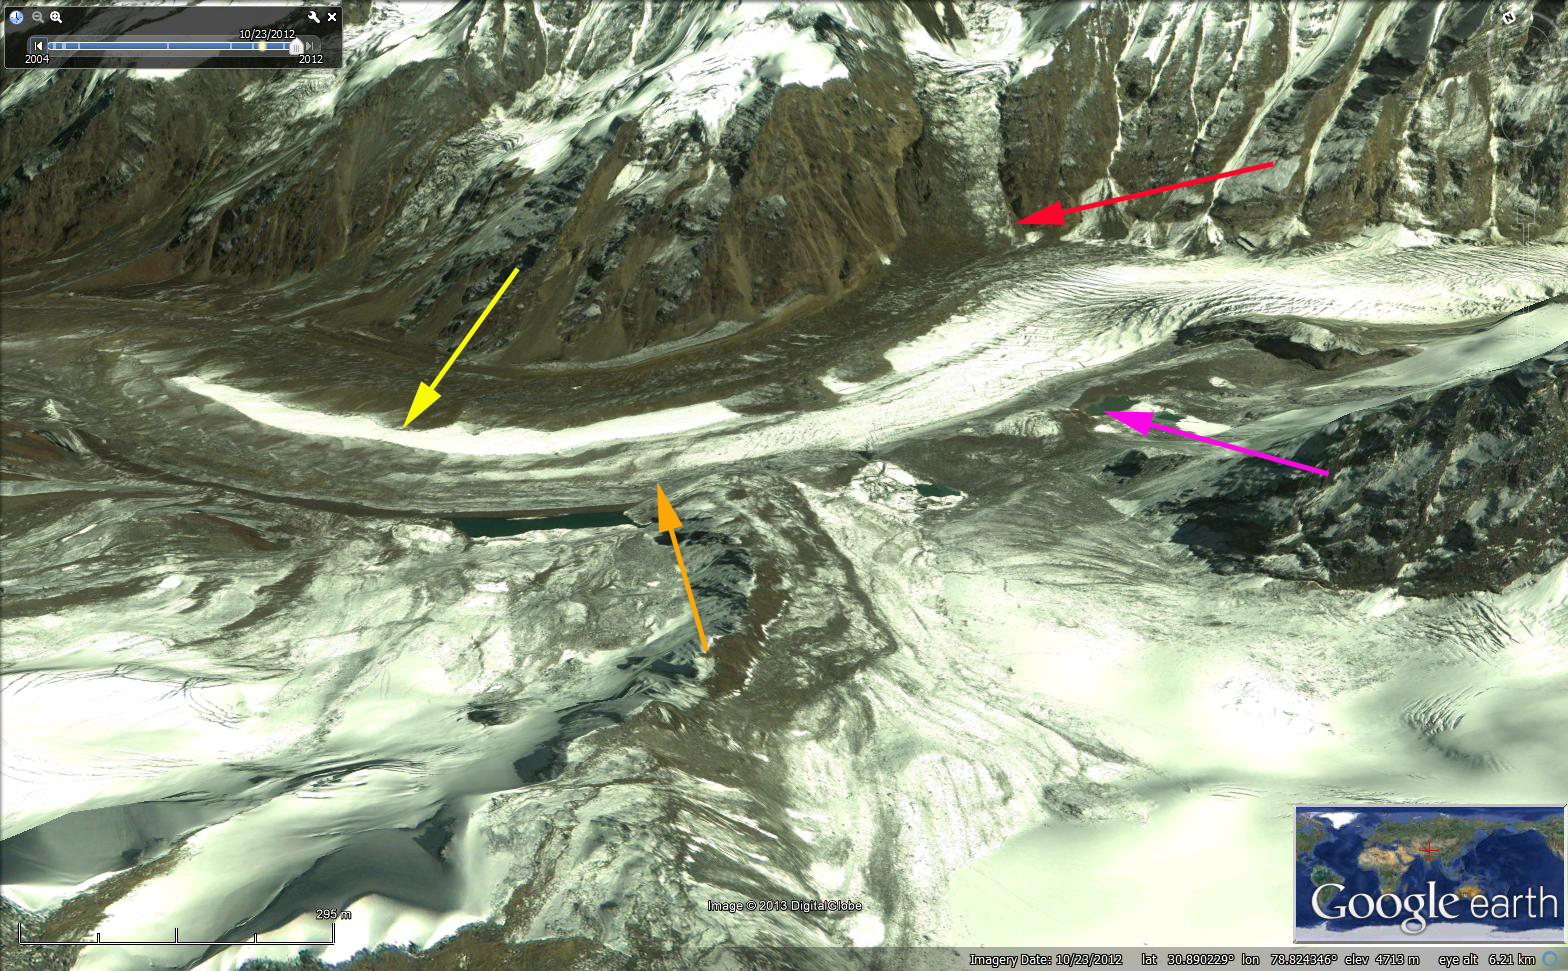
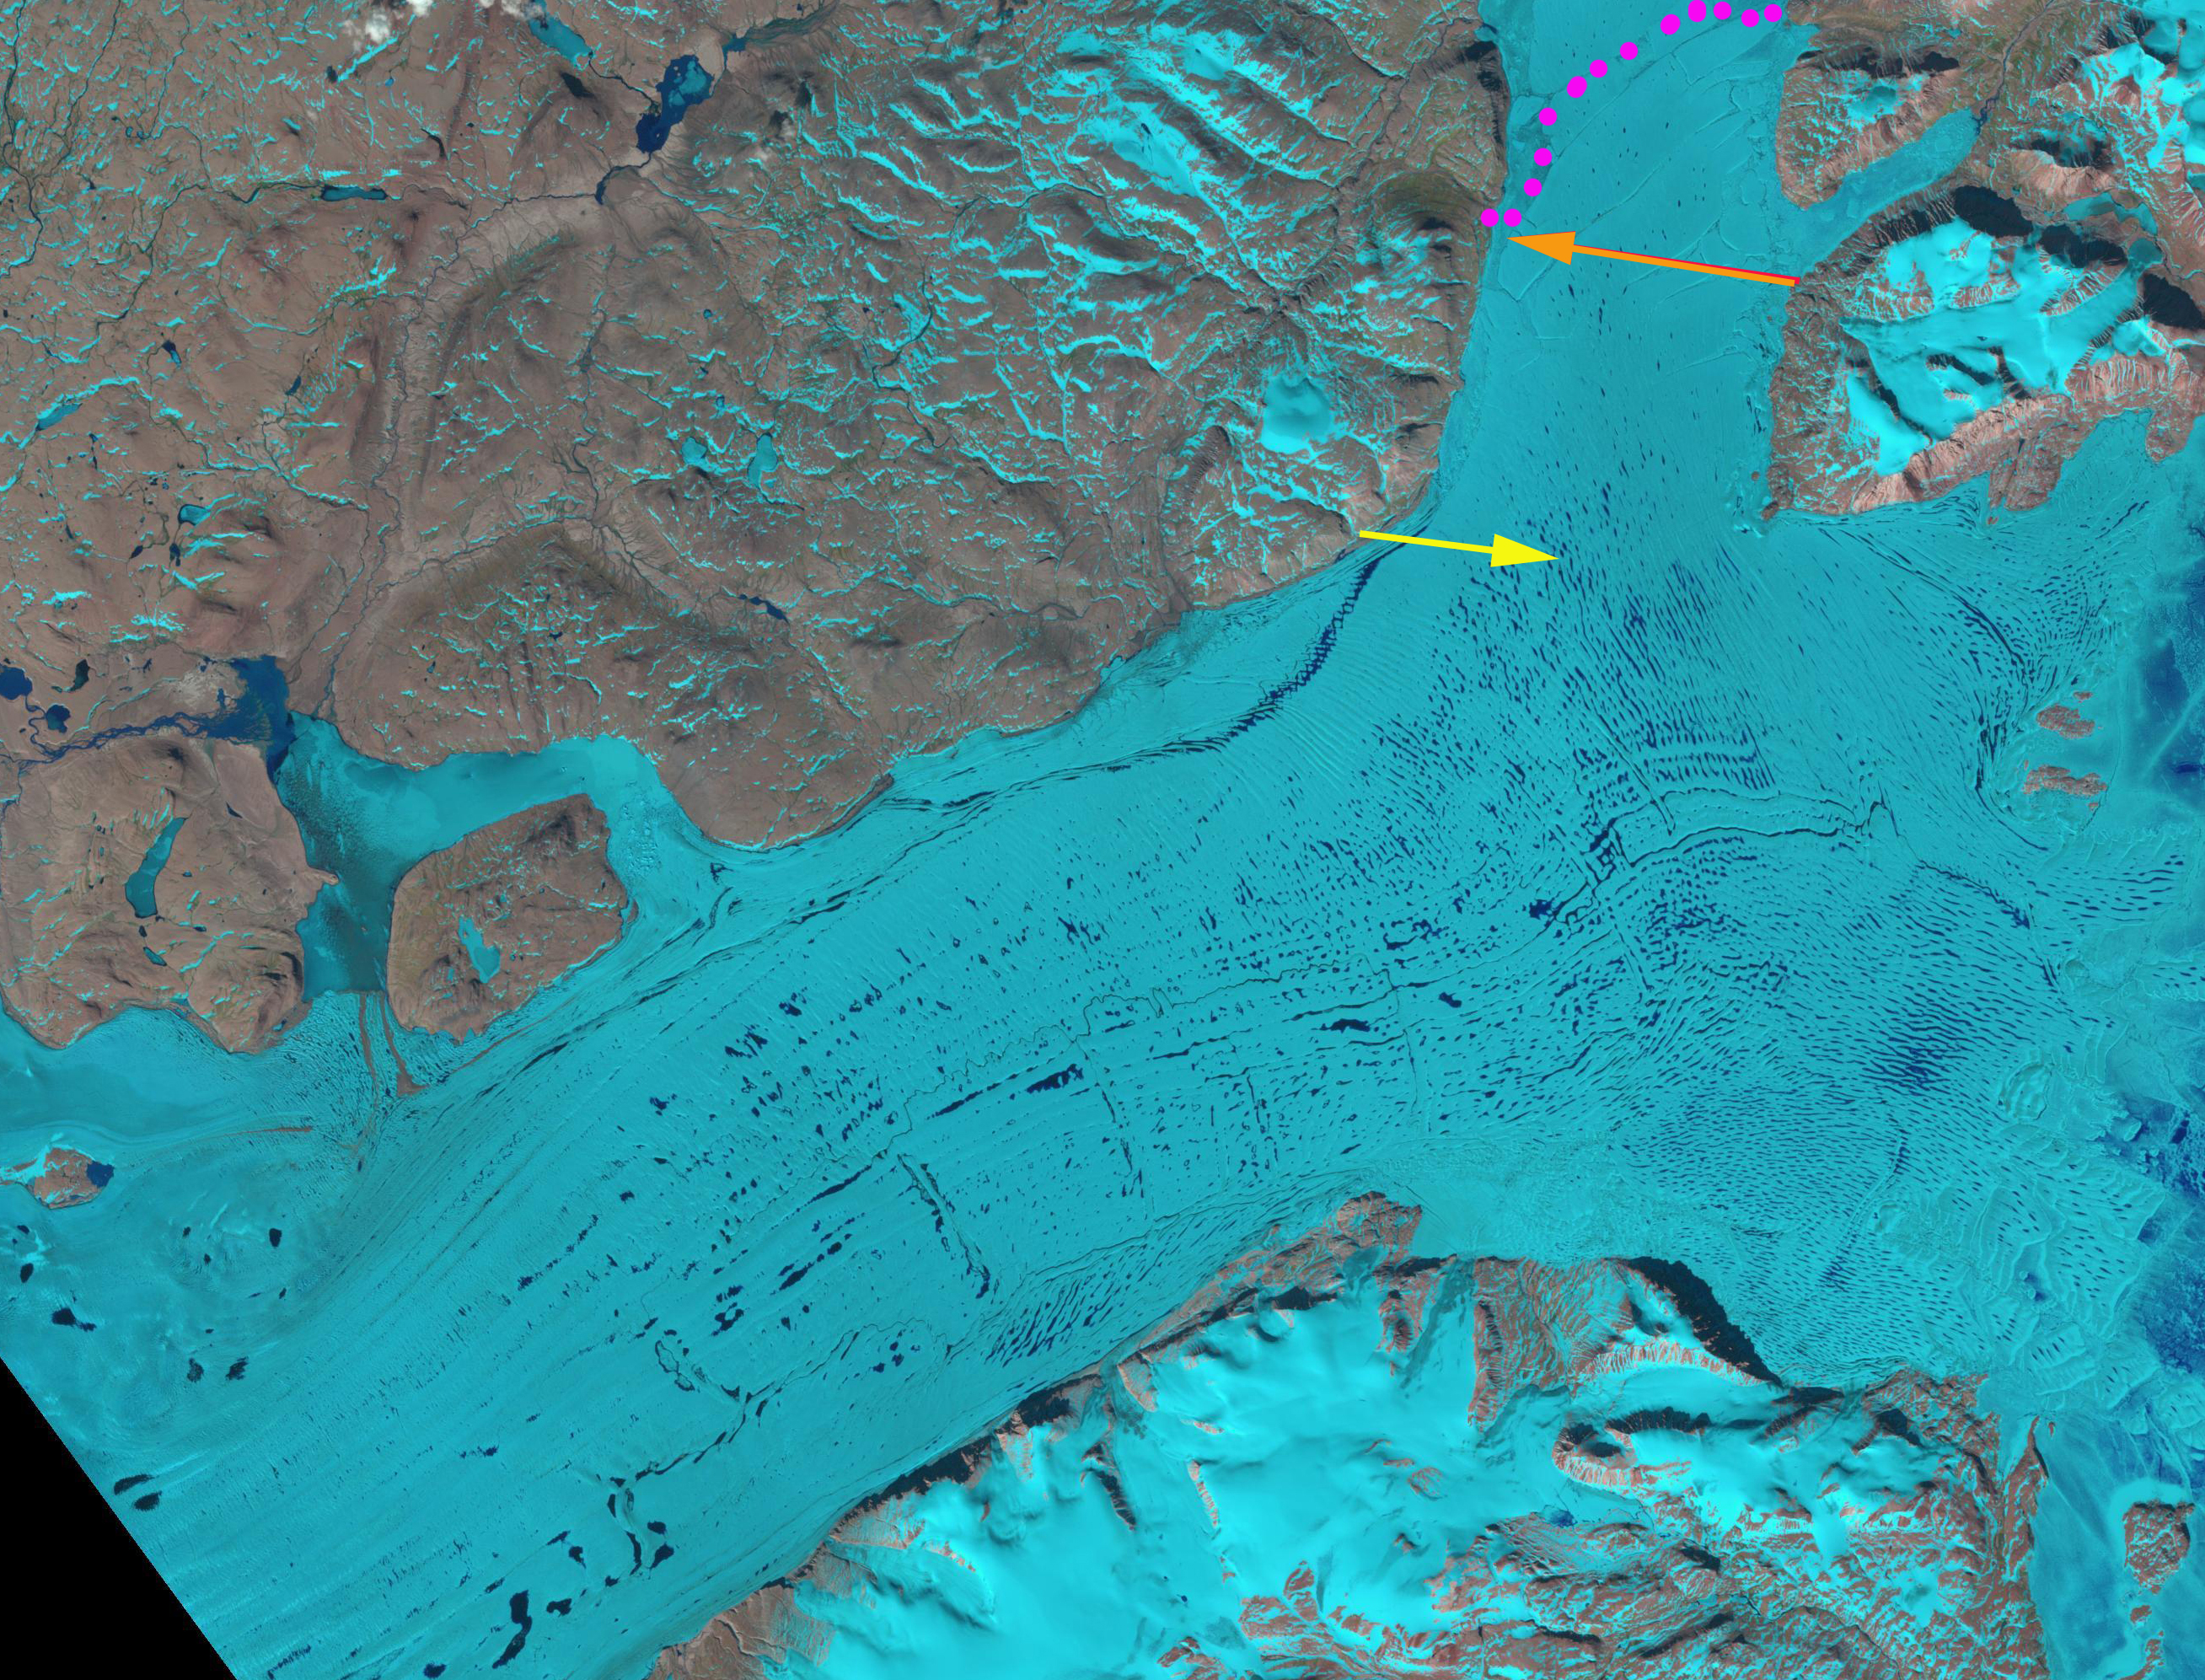
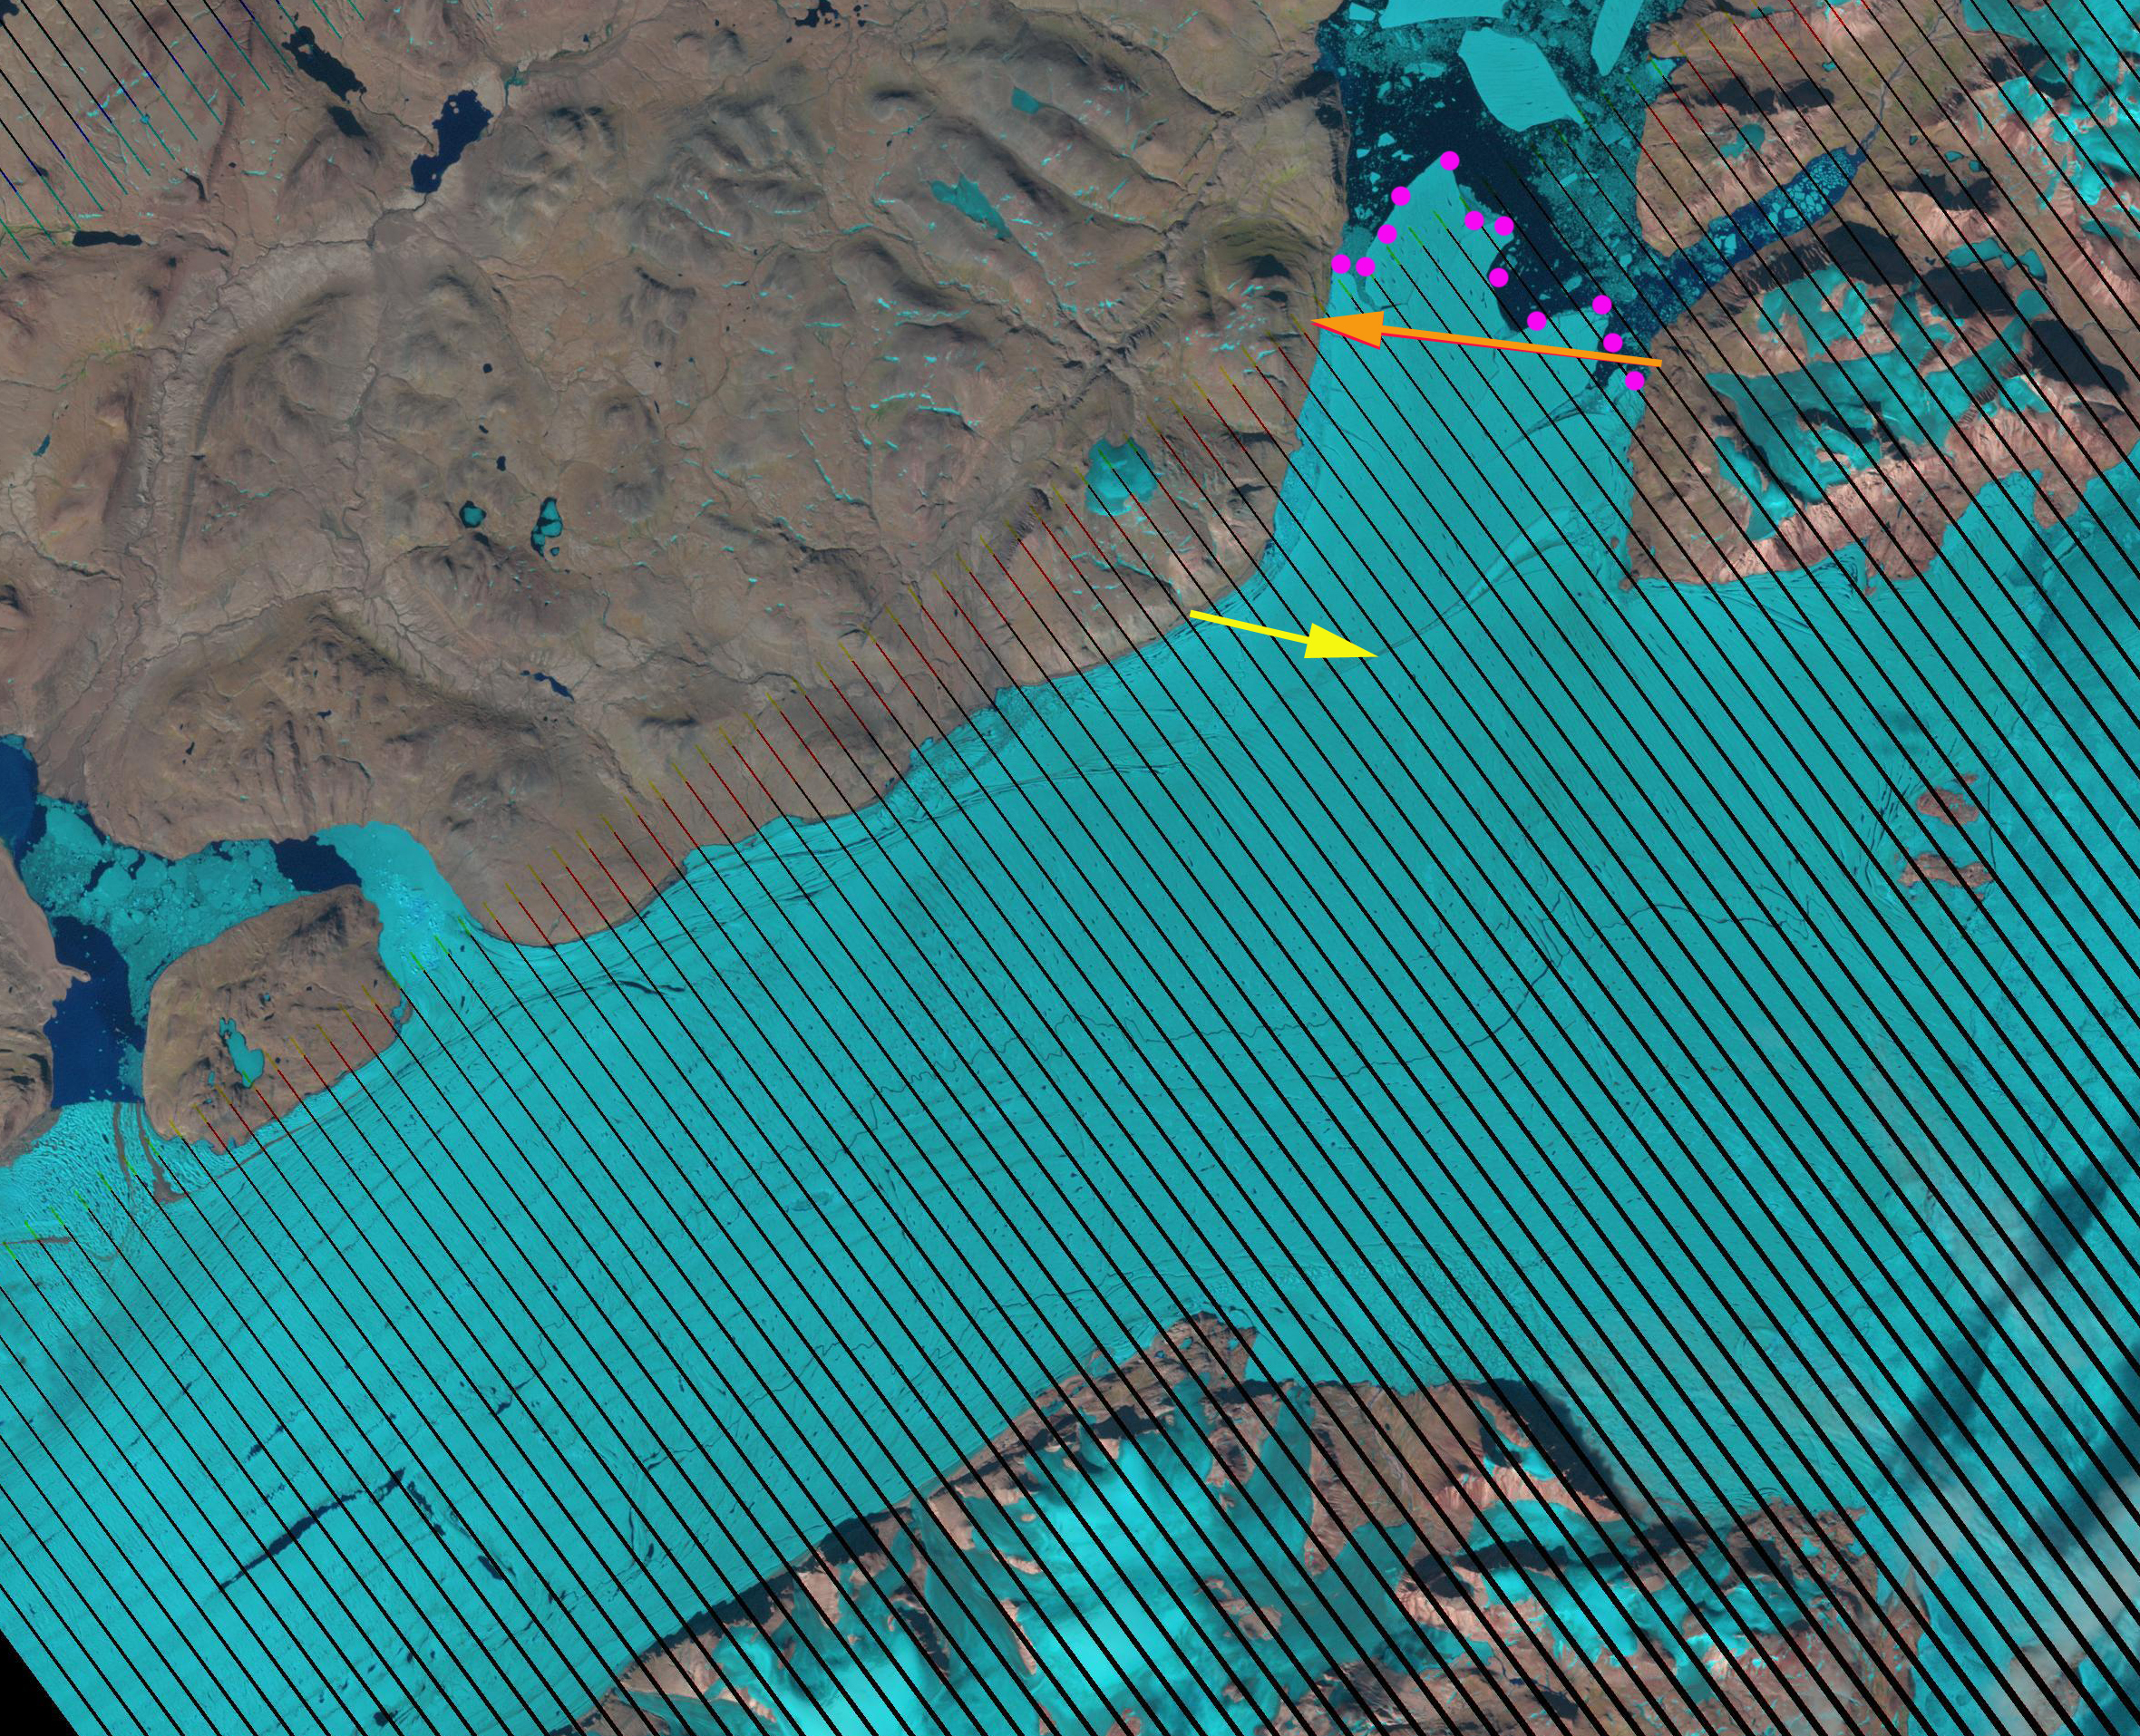
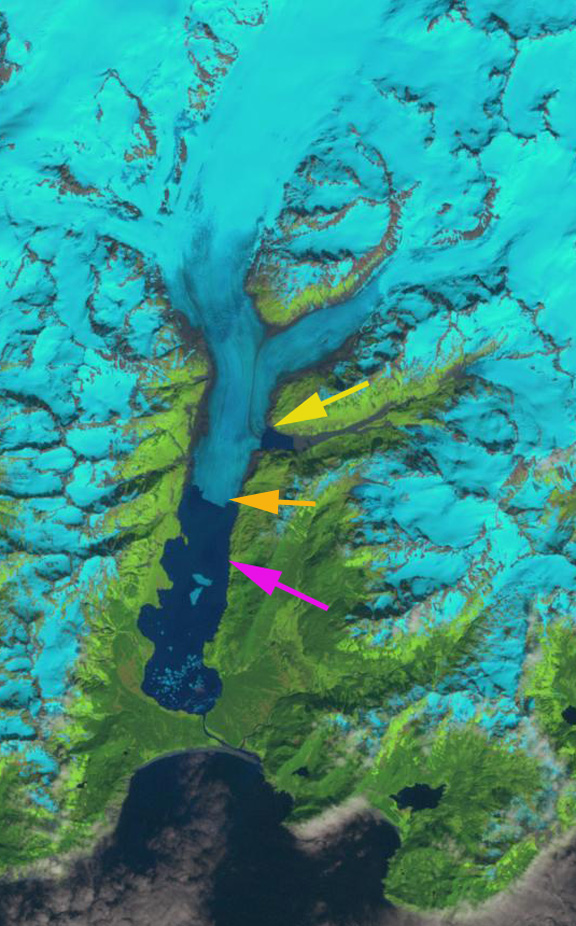
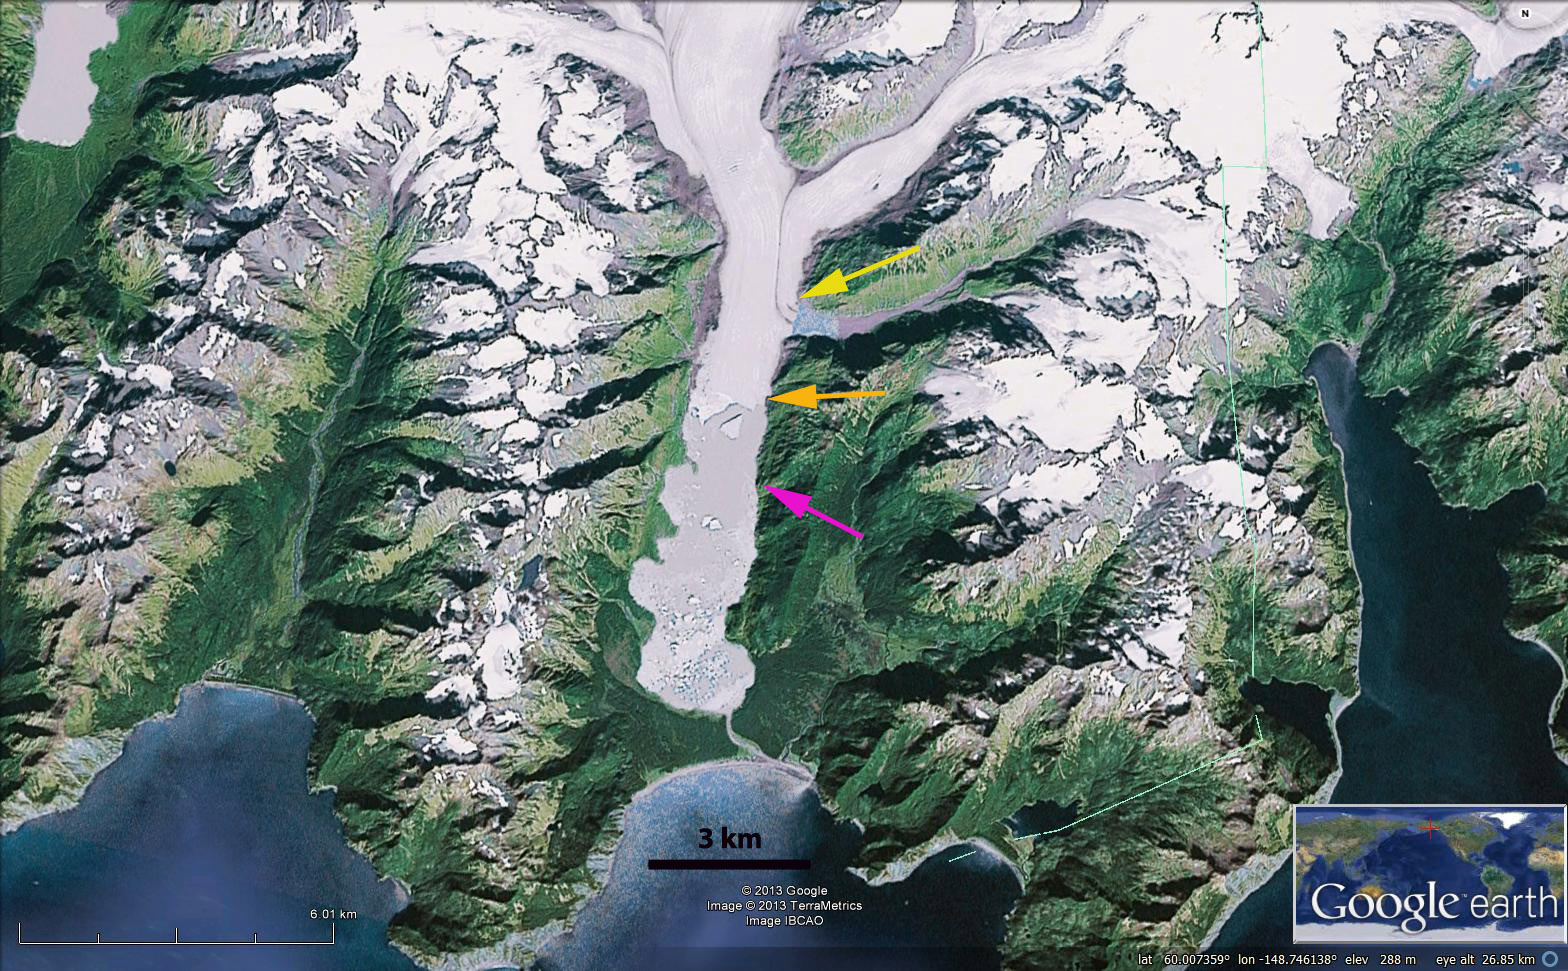
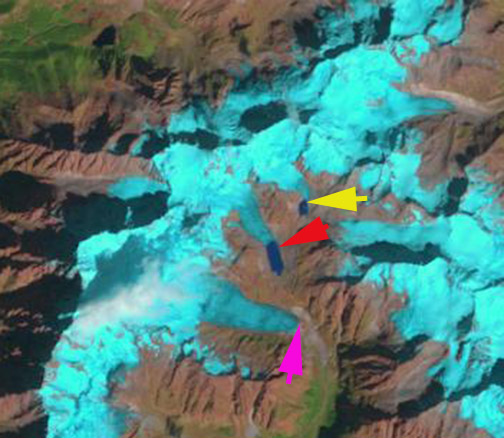
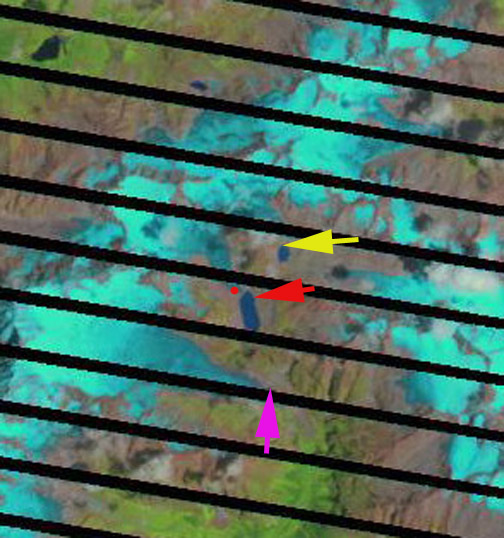
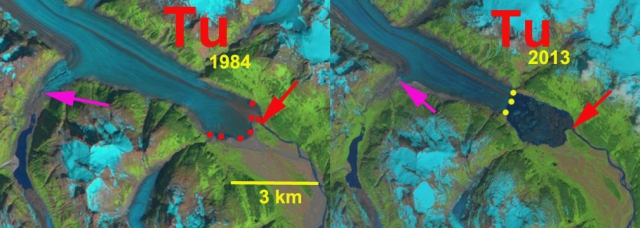
Tulsequah Glacier in 1984 ended at an outwash plain with a small marginal lake beginning to develop, red arrow. By 2013 a large proglacial lake has developed due to the 2500 m retreat. A side valley down which a distributary tongue of the glacier flowed in 1984 has retreated out of the valley by 2013, pink arrow.

twin glacier change The East and West Twin Glacier are receding up separate fjords, though they are fed from a joint accumulation zone. The East Twin is a narrower glacier and has retreated 900 m. The West Twin has retreated 600 m, at an elbow in the fjord. Elbows like this are often good pinning points that are a more stable setting, once the glacier retreats out of the Elbow retreat should speed up.

taku Glacier change Taku Glacier is the largest glacier of the icefield and unlike all the others it has been advancing non-stop over the last century. The sustained positive mass balance from 1946-2012 has driven this advance (Pelto, 2011), this led to the glacier thickenning along its entire length. Since 1950 observations of velocity near the snowline of the glacier by JIRP indicates that the glacier has had a remarkably steady flow over the past 50 years (Pelto et al, 2008). Since 1988 the glacier has not been thickening near the snowline as mass balance has declined. We have been able to observe the snowline movement in satellite images to help determine the mass balance. The changes at the glacier front are quite variable as the glacier advances. JIRP measurements of the terminus indicate this from 2001-2008 with an interactive map from Scott McGee, indicating advances in some area, minor retreat in others and back and forth in others. In 2012 JIRP was back at the terminus creating the map below. There is no change at the east and west side of the margin since 2008 and 55 to 115 m of advance closer to the center.
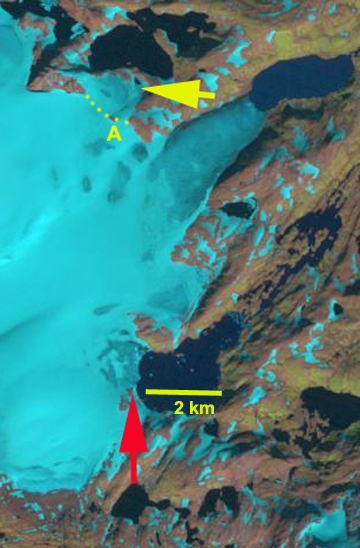
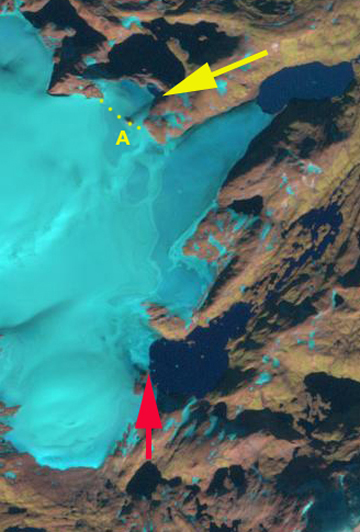
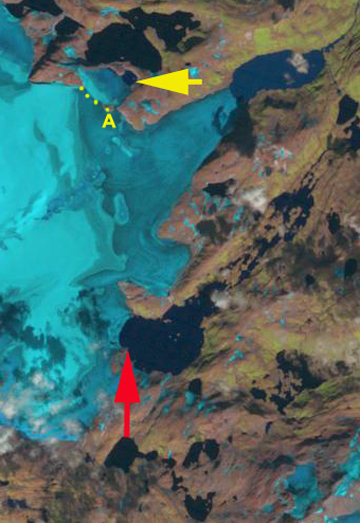
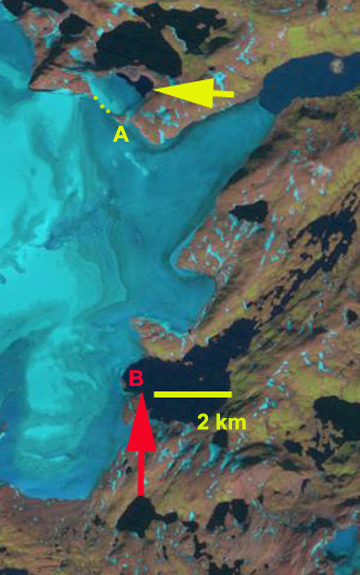
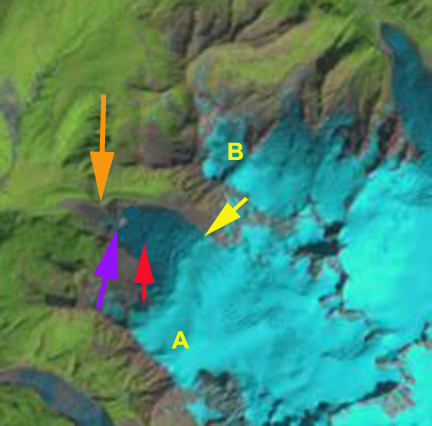
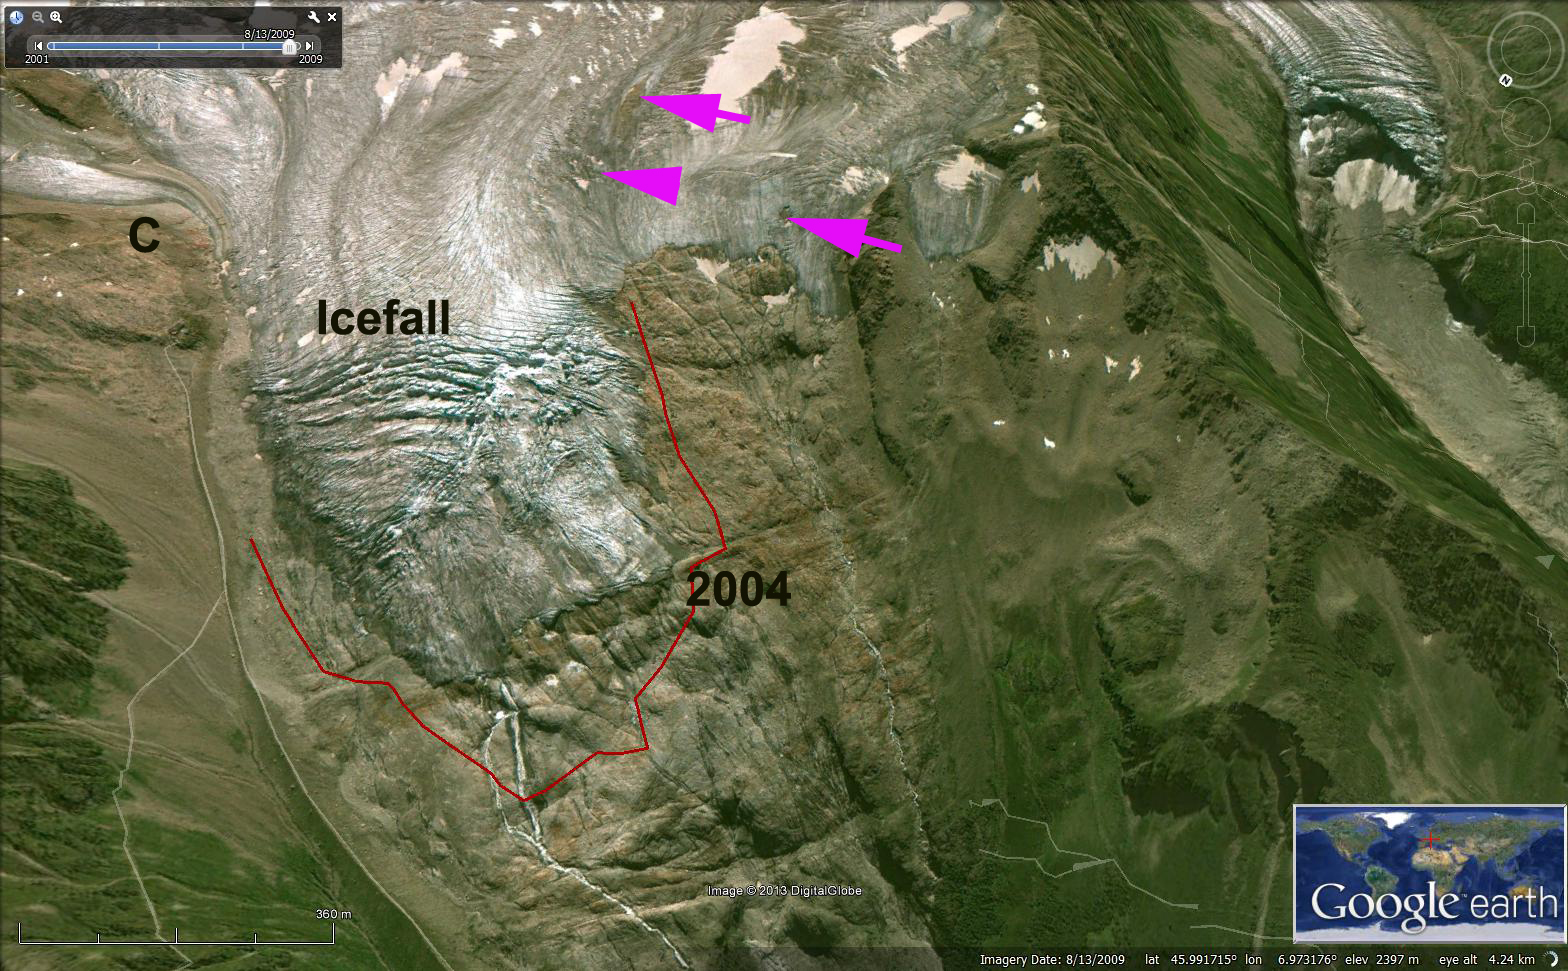
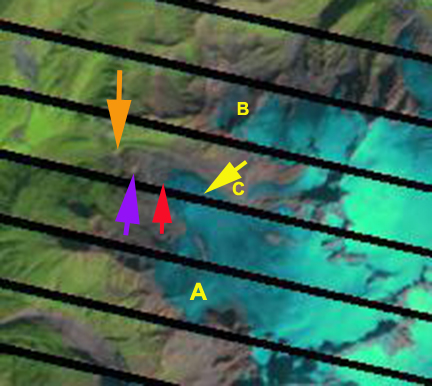
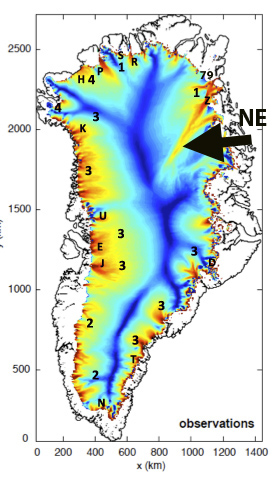
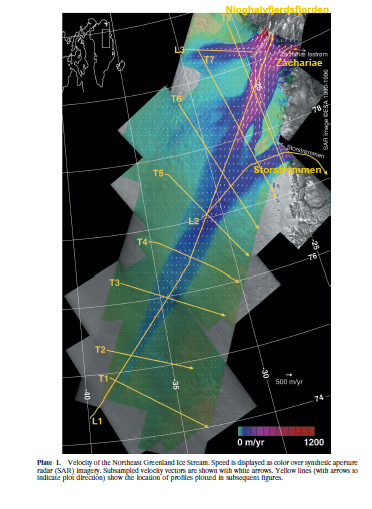
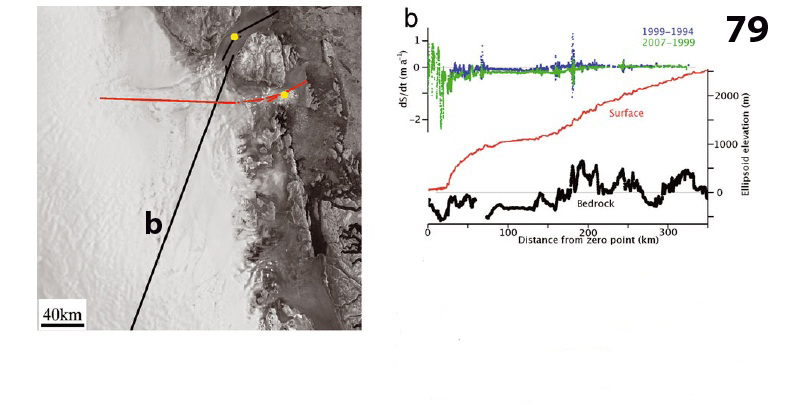
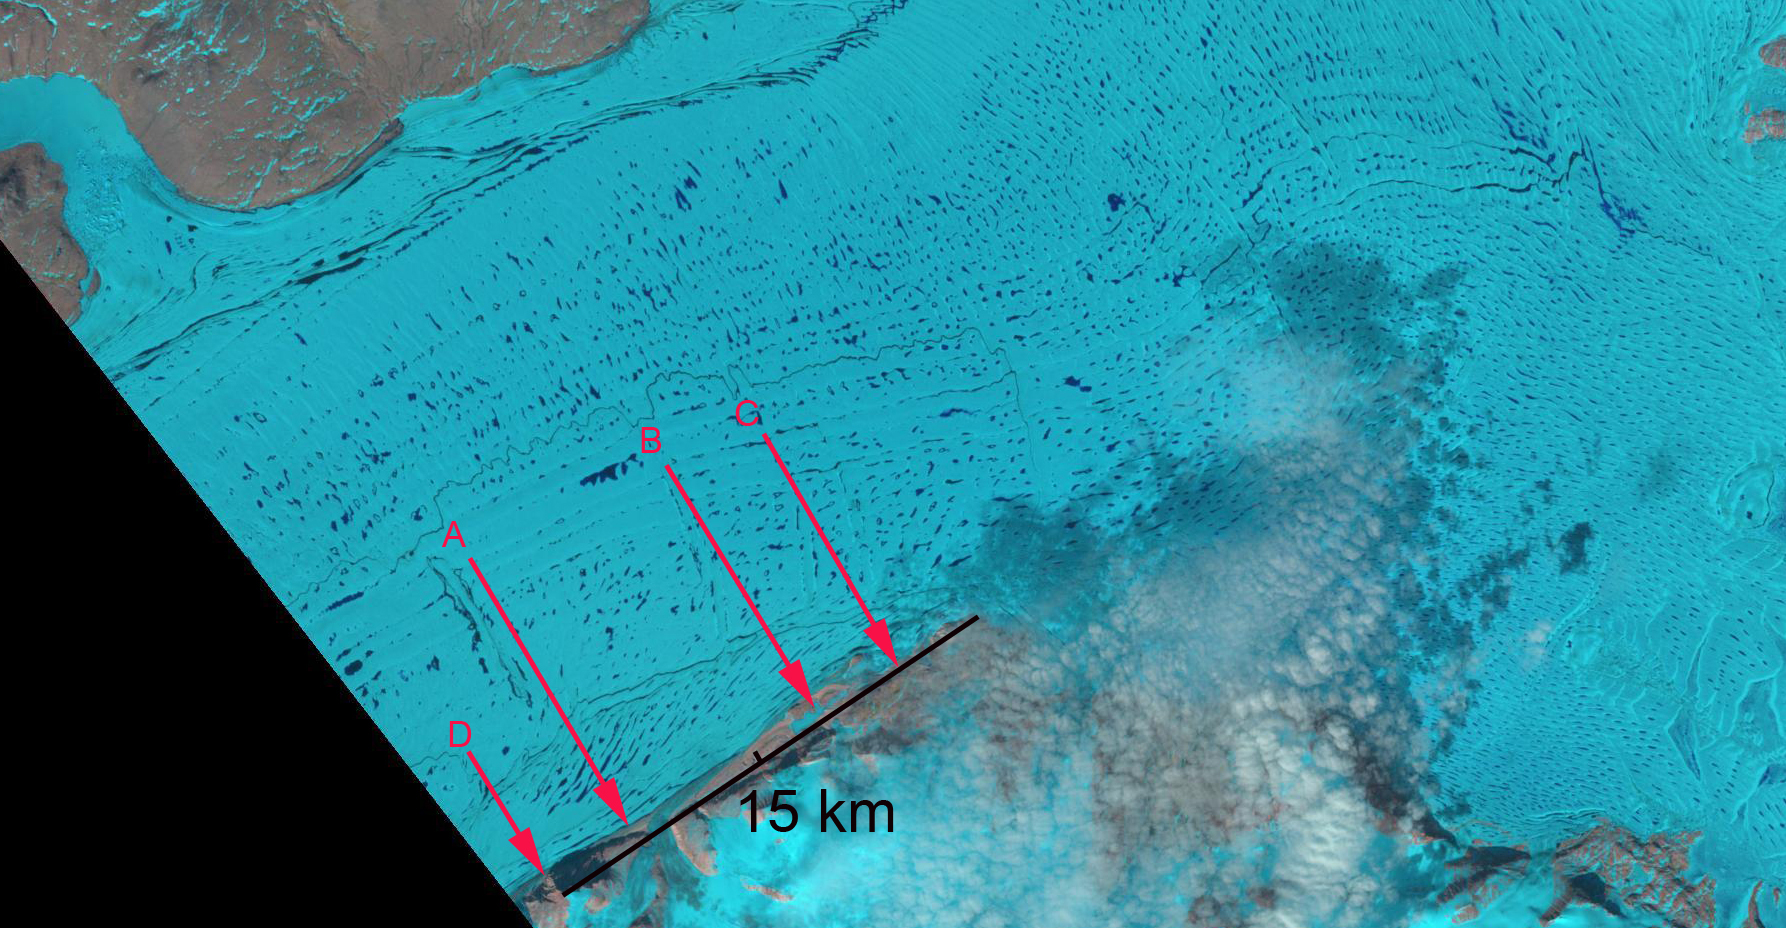
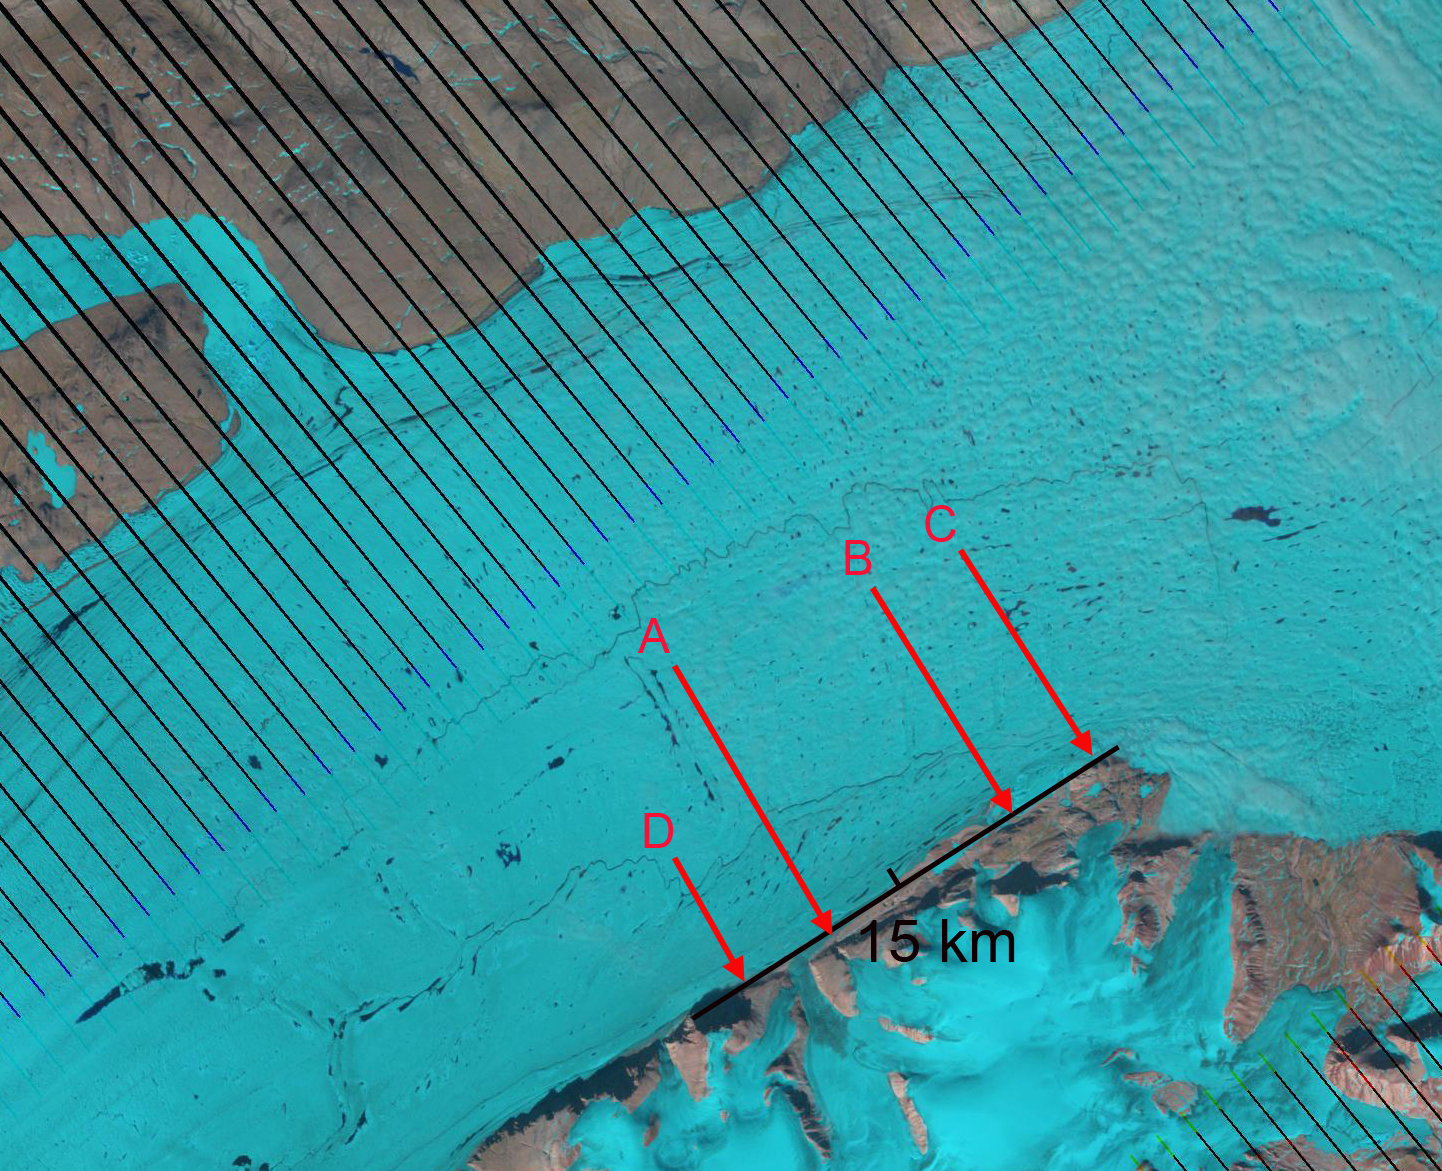
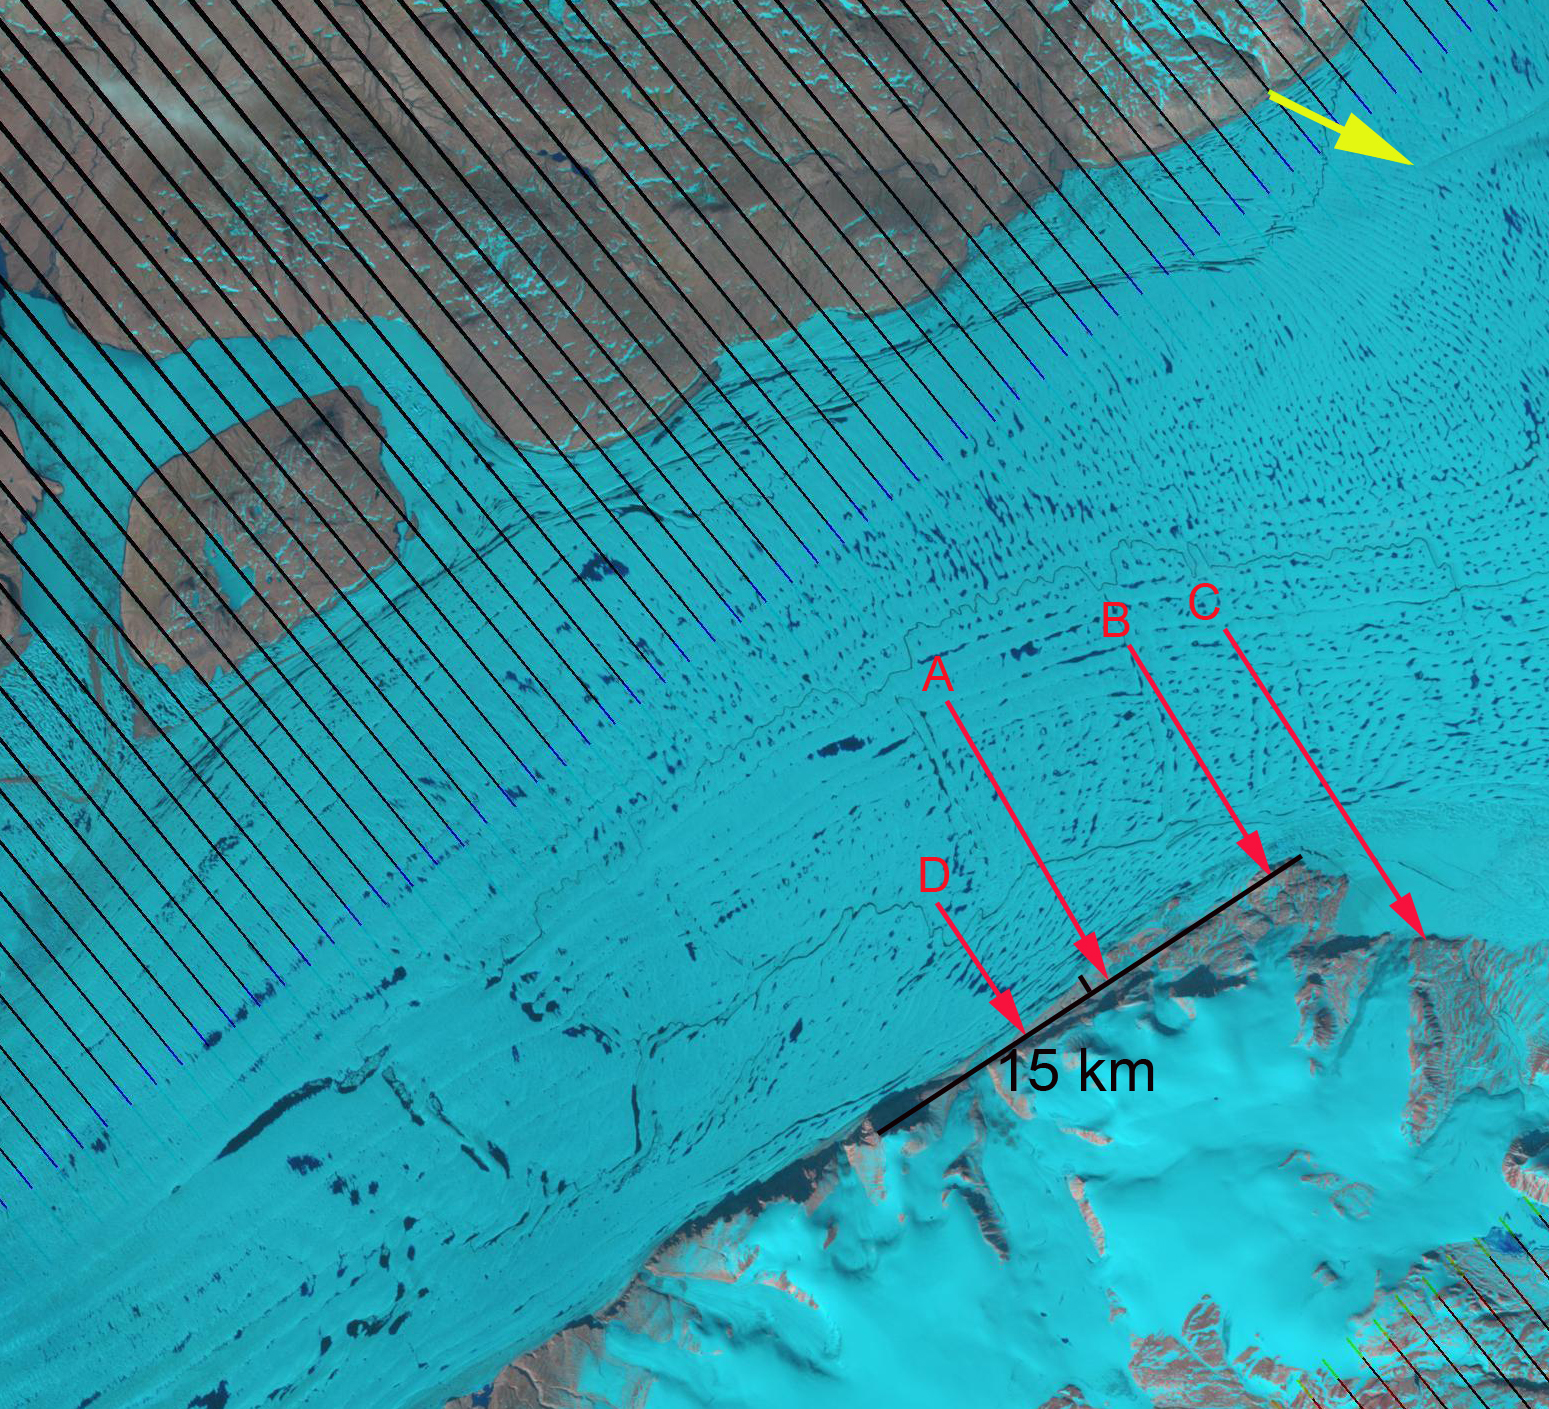
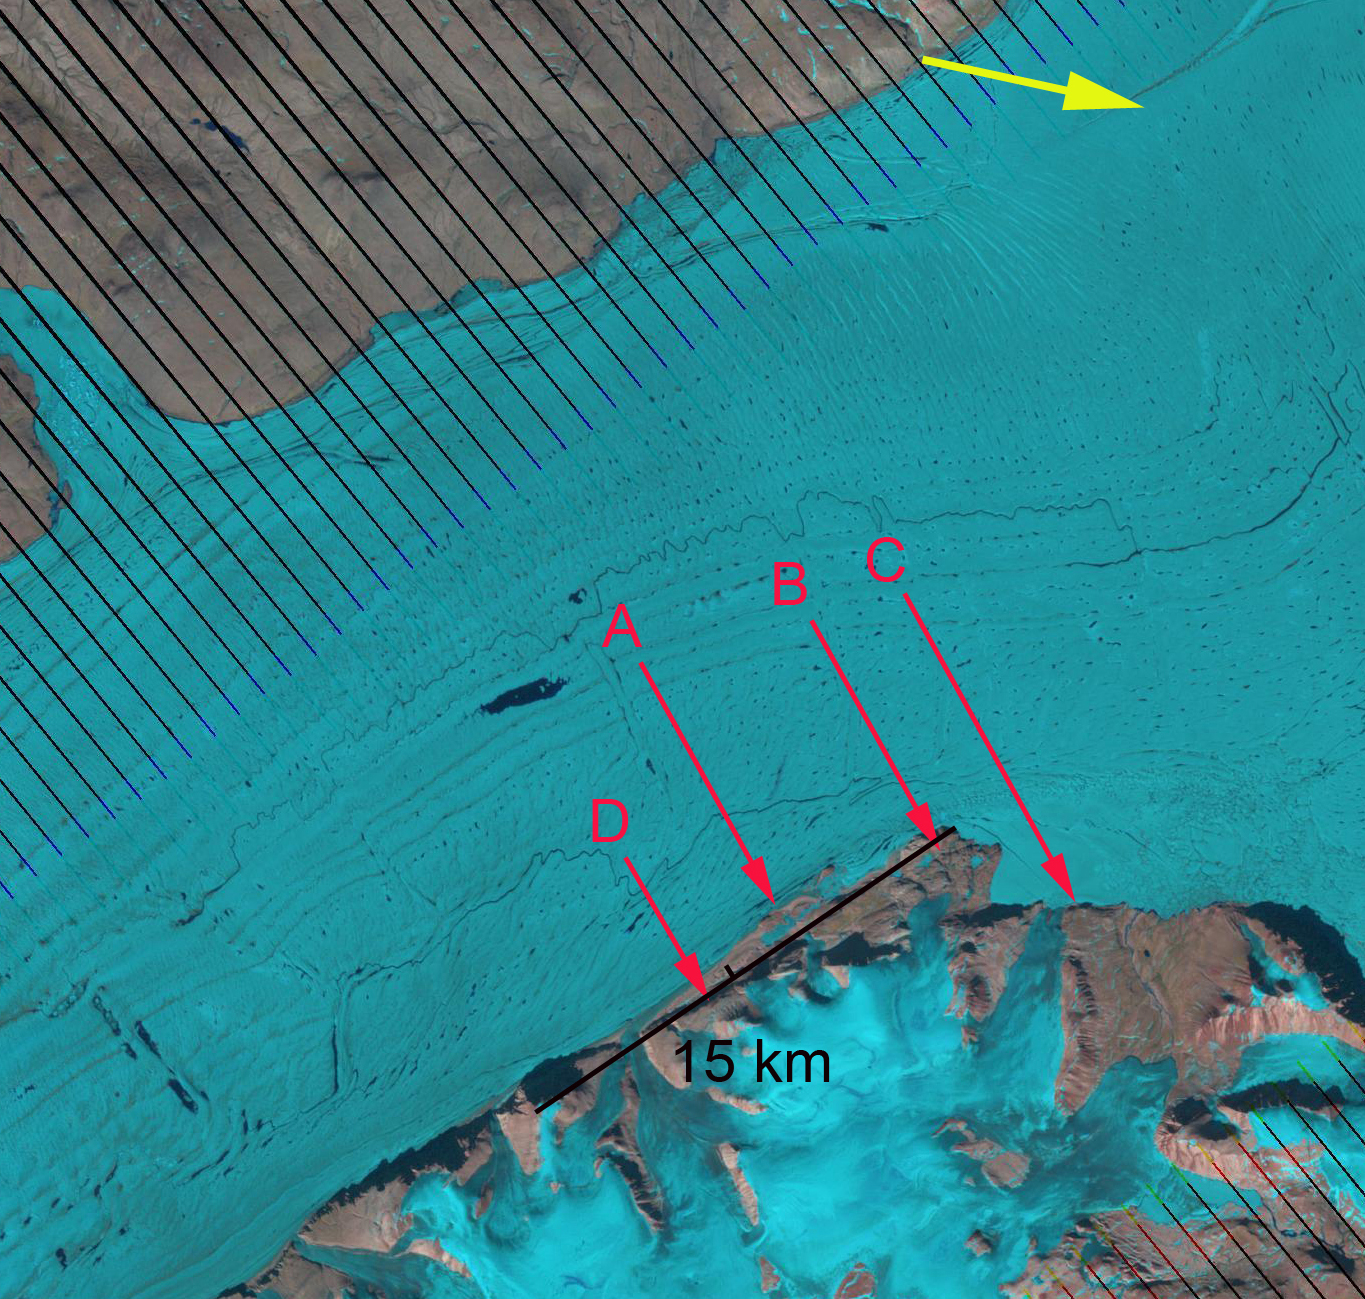
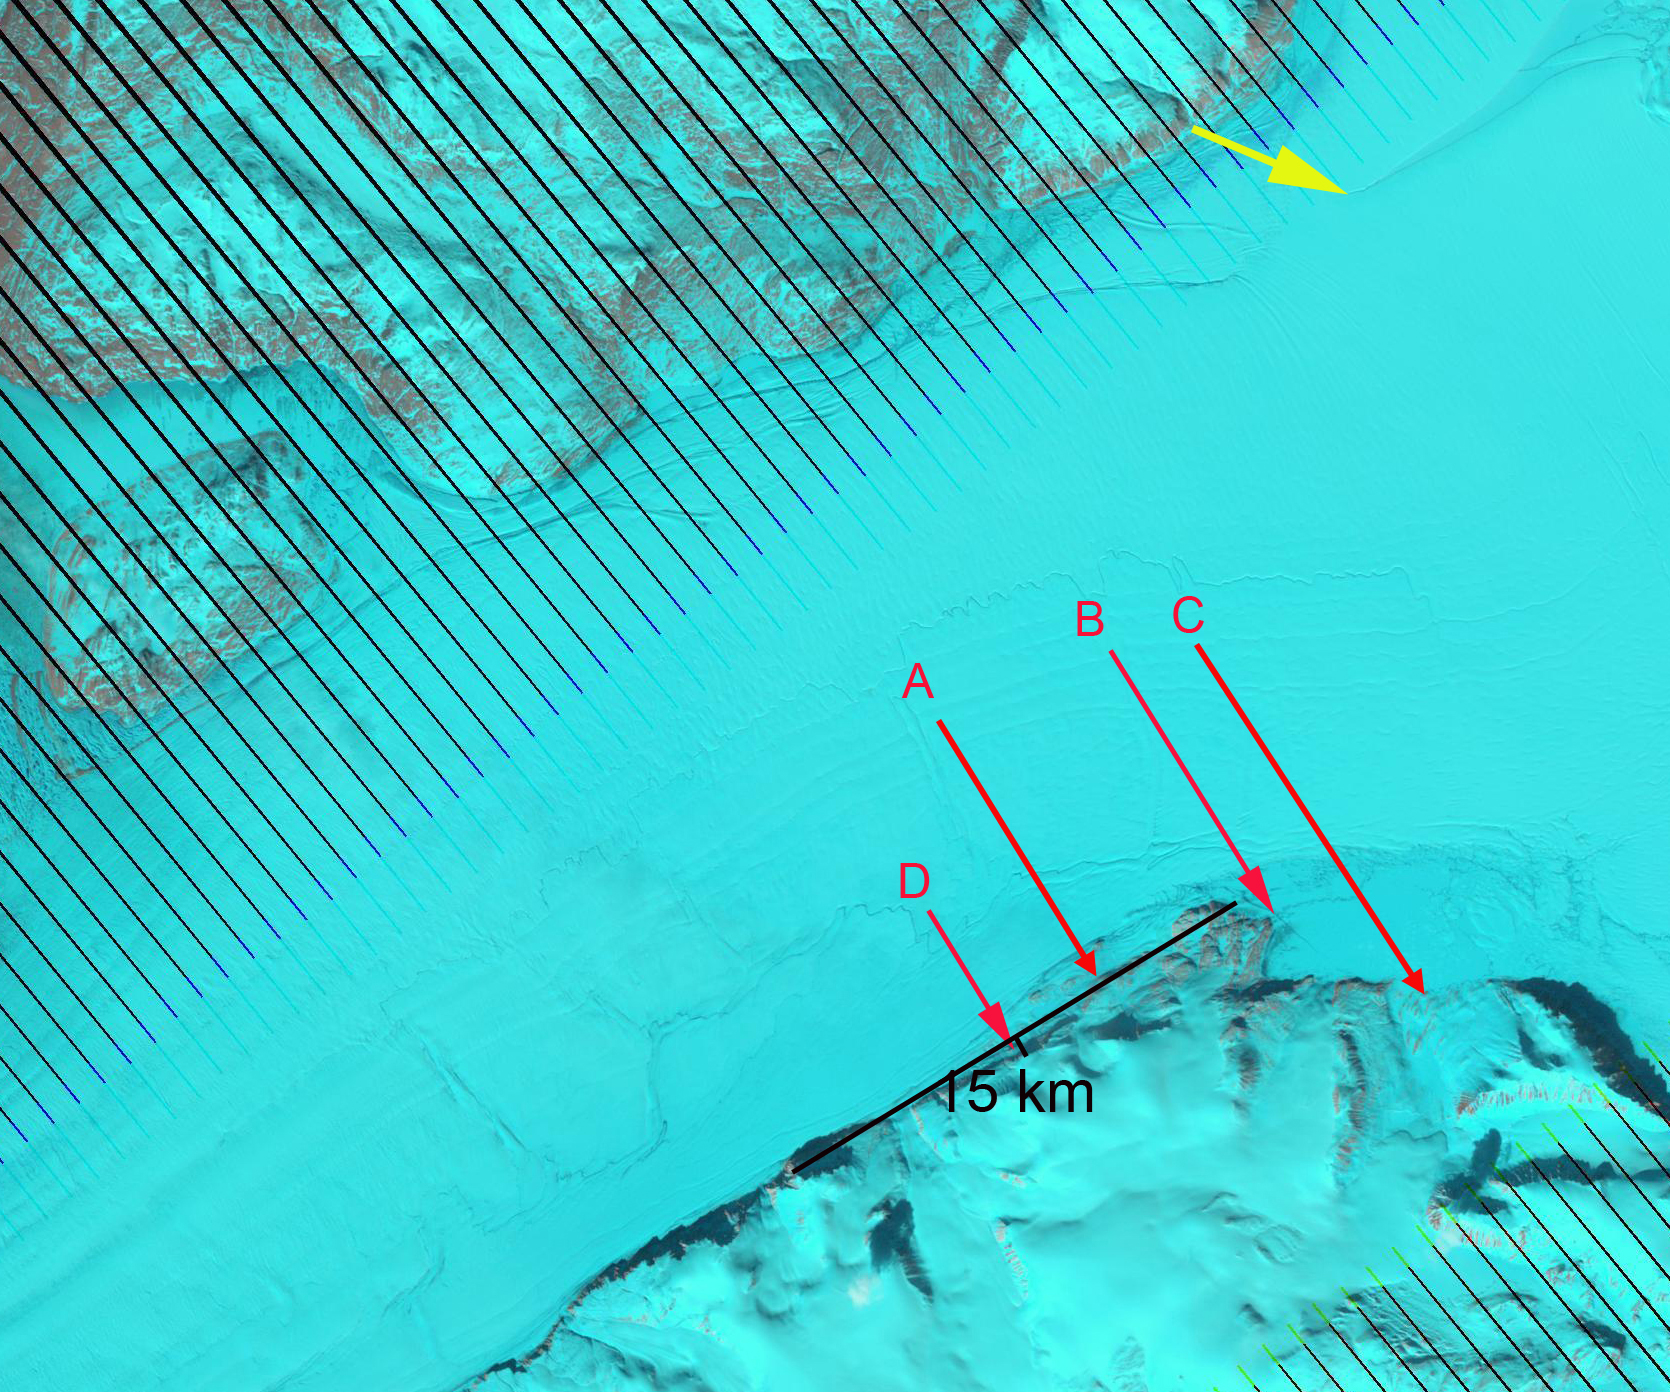
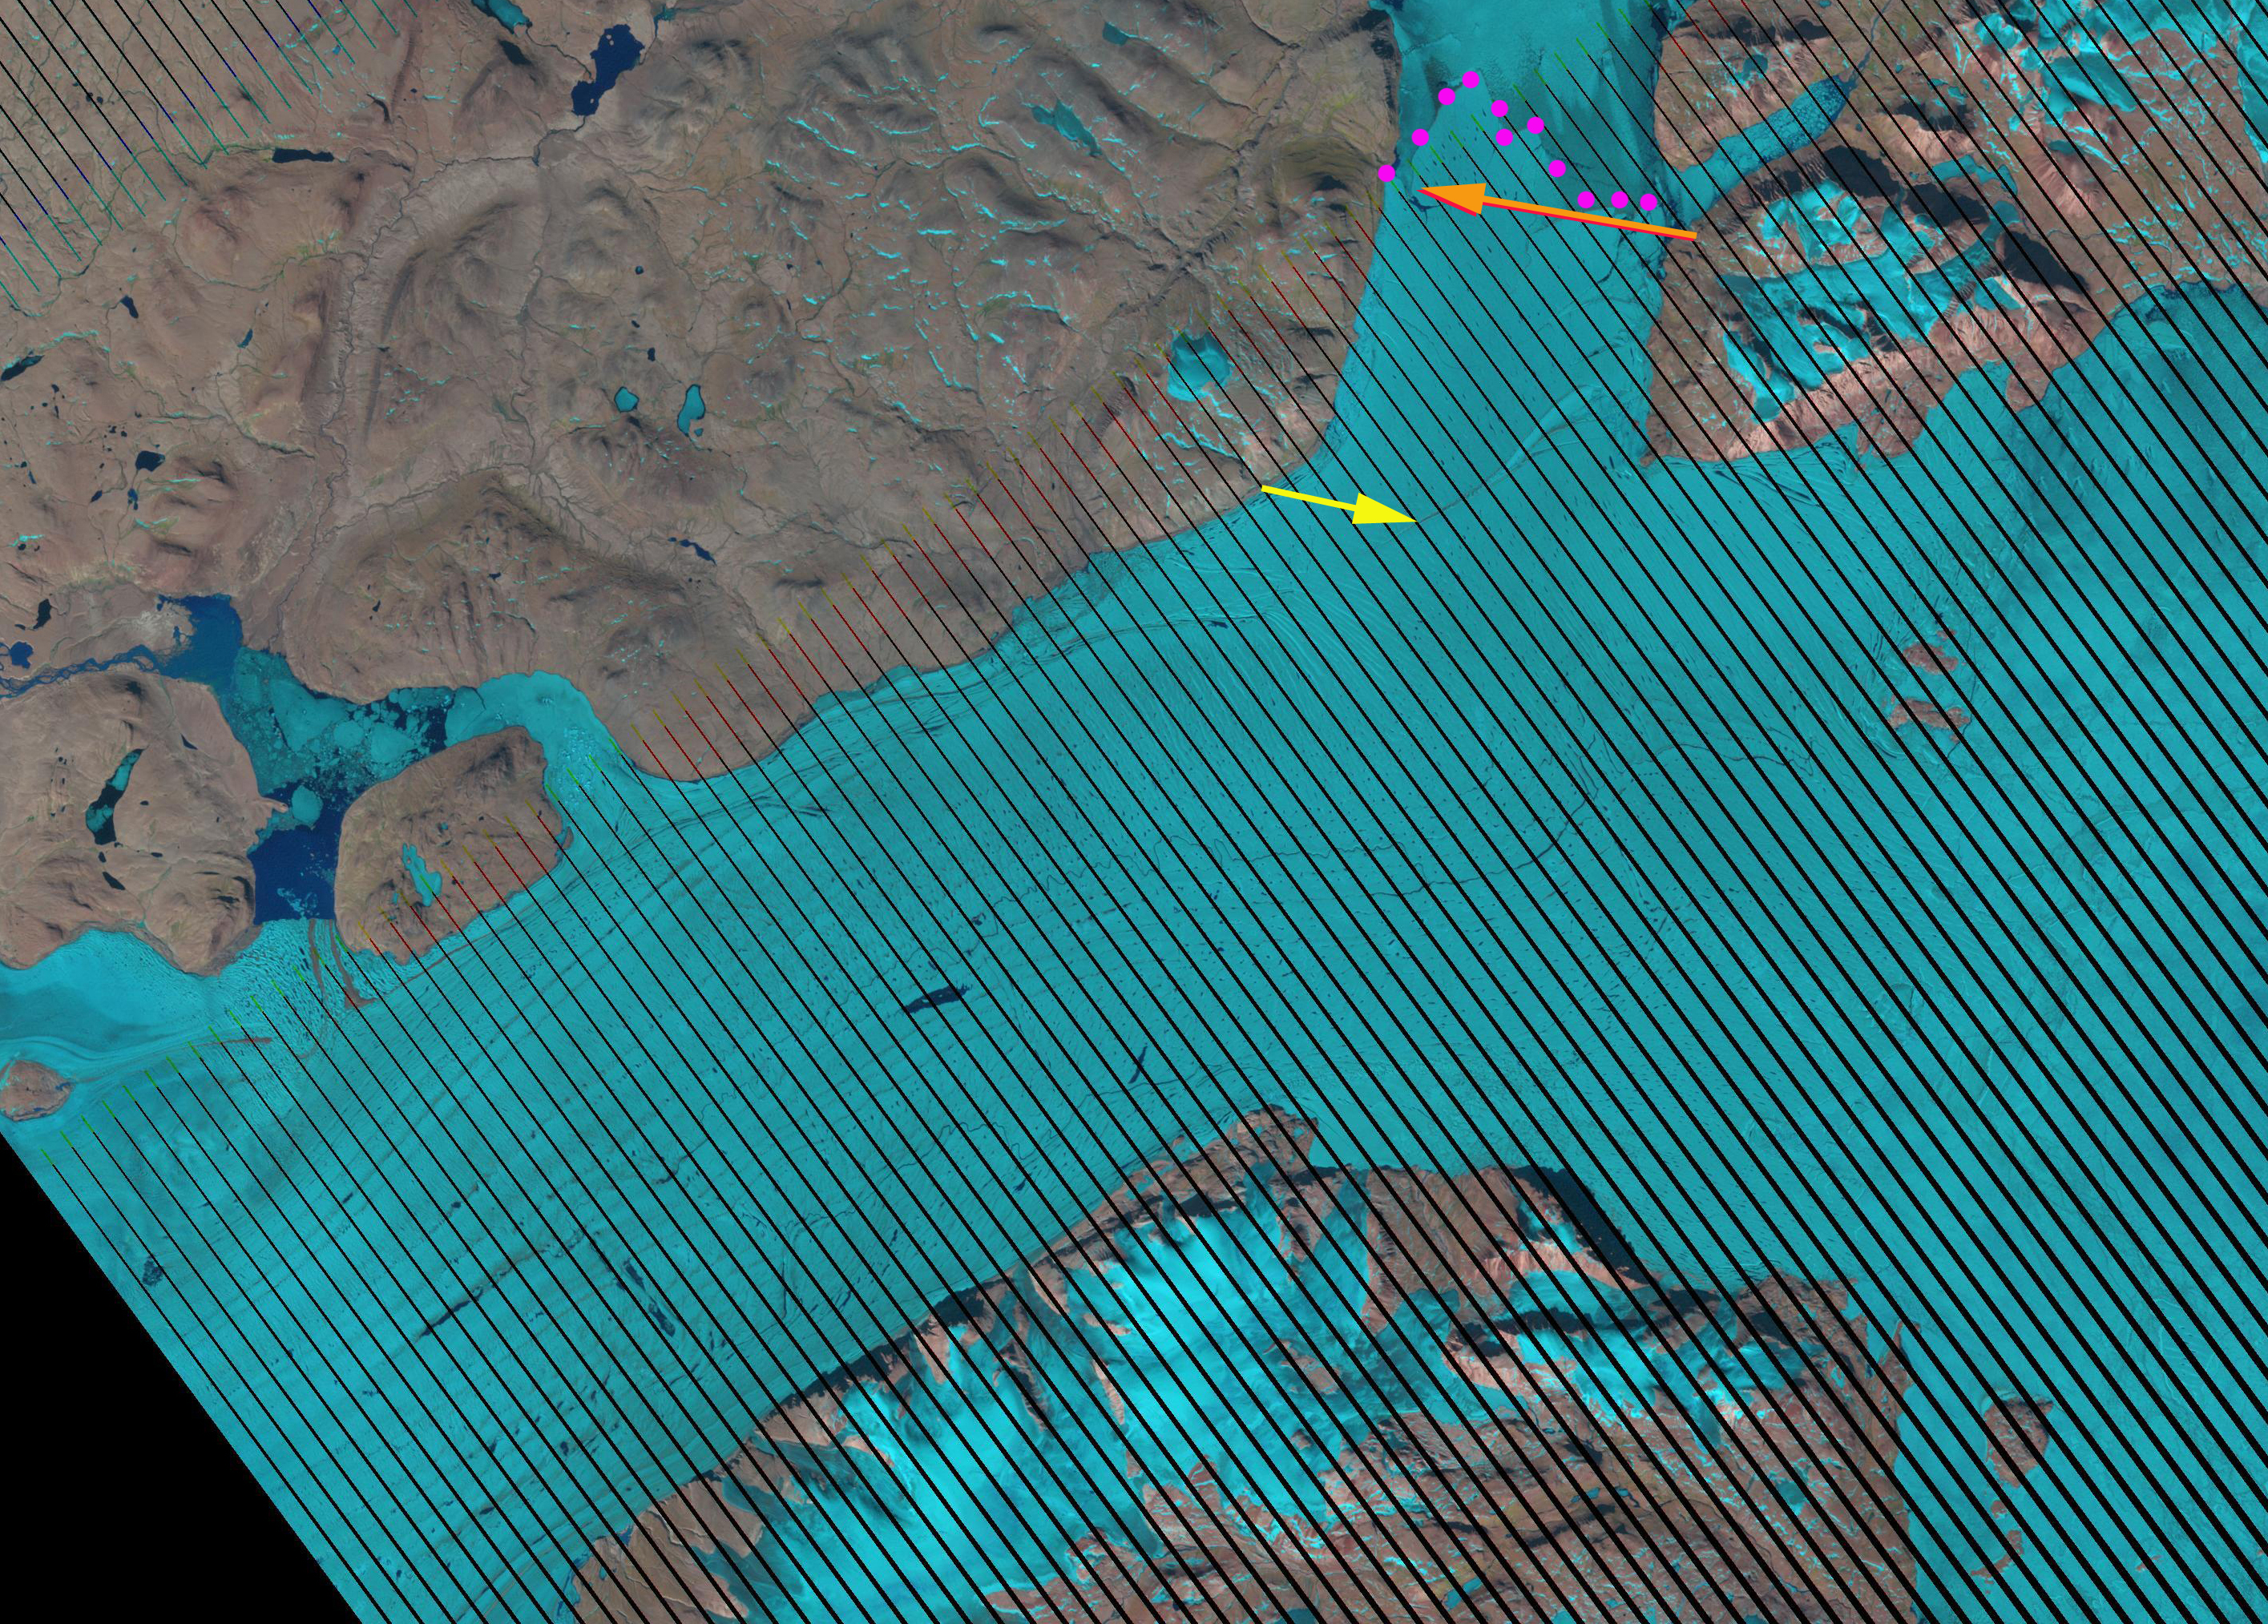
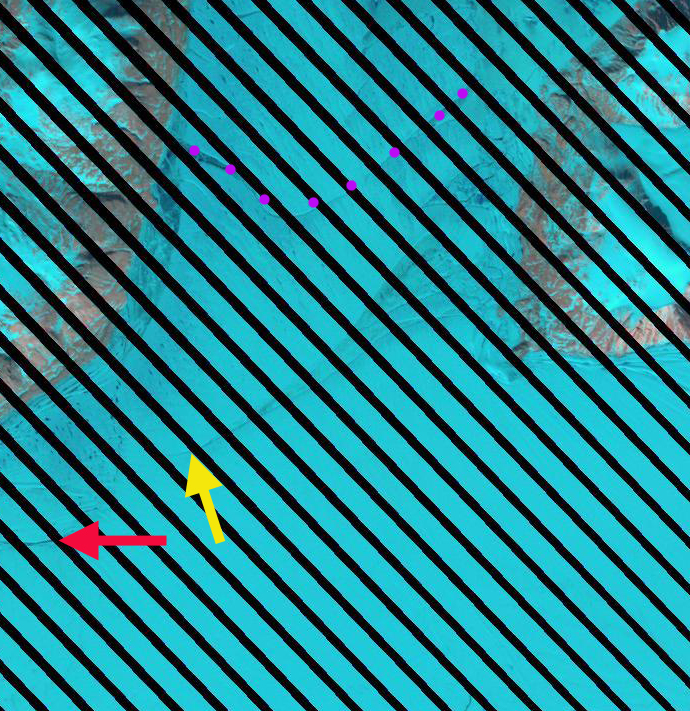
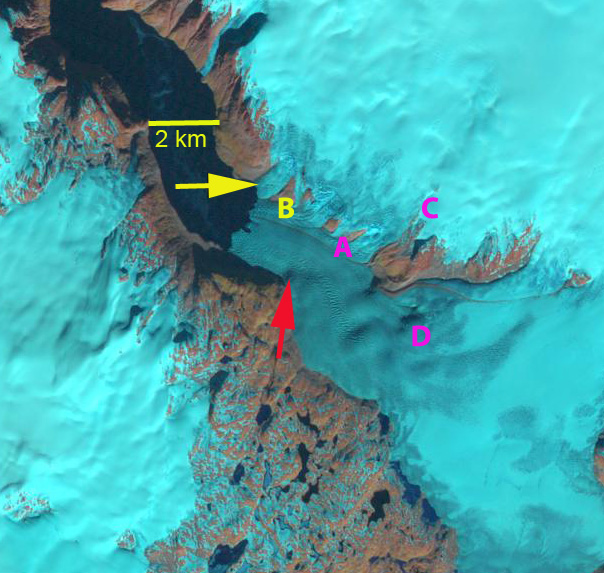
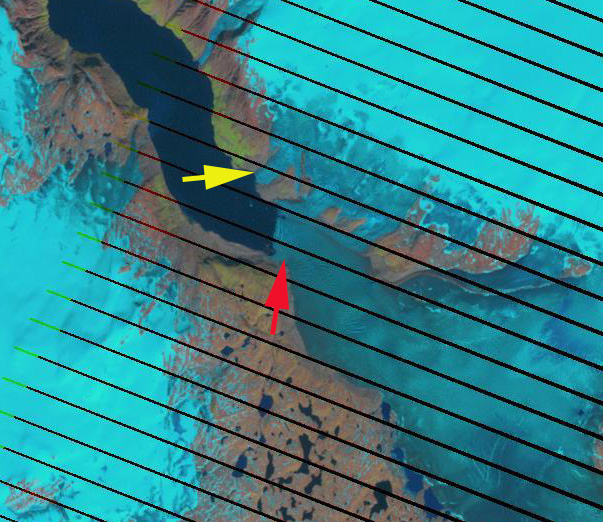
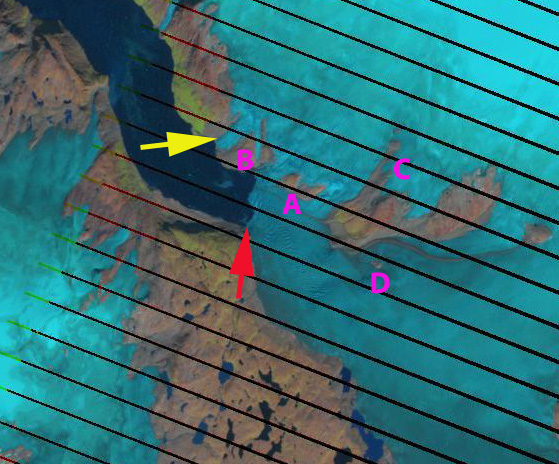
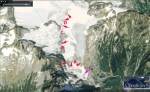
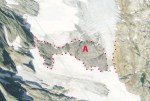
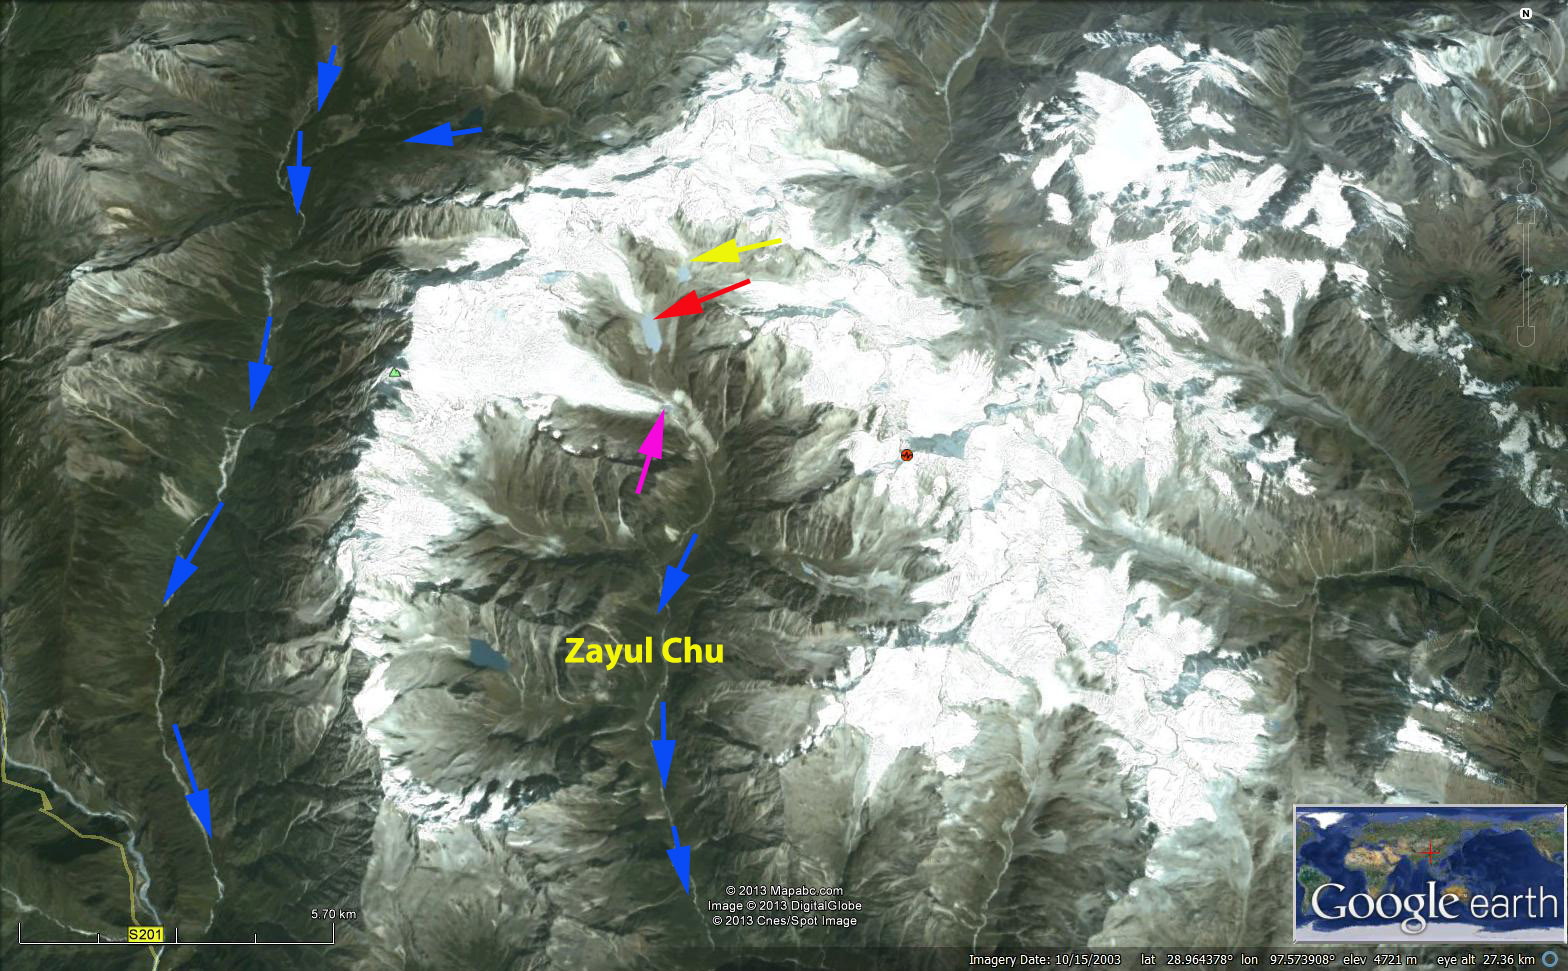
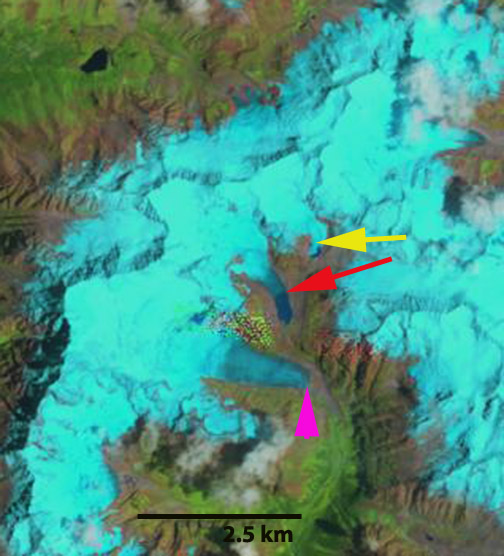
TakuTerminusSurvey2012

Jaundhar Bamak Glacier tributary retreat, Tons River, Uttarakhand, India

The Tons River is in Uttarakhand India. The watershed is fed by more than 50 glaciers. The largest are Jaundhar Barak and Bandarpunch, the glaciers of Tons valley are notable for a thick mantle of debris cover, due to the terrain characteristics, and the avalanche fed nature of the glaciers (Pankaj et al, 2012). The Tons River Basin has one significant operational hydropower unit, the Mori Hanol Hydro Power Project (70 MW) with a diversion dam downstream of Mori village. There are other proposed projects in the basin. Mehta et al (2013) observed the spatial changes of Jaundhar Barak, Jhajju and Tilku glaciers in the Tons River basin between 1962 and 2010 using Landsat Satellite data, topographic maps and field surveys. They estimated the overall loss in area to be 3.6 km2 (5.4%) and frontal retreat of 1,700 m, ∼ 800 m and ∼ 700 m for the Jaundhar Barak, Tilku and Jhajju Glaciers. The debris cover (DC) makes it quite difficult to easily identify terminus (T) position using Landsat imagery, Google Earth Imagery is not good either.

tons river map
Map of Tons River basin glacier from (Pankaj et al, 2012)

tons base map
Jaundhar Barak Glacier in 2012 arrows indicate flow Debris cover=DC and Terminus=T, tributary glaciers of note discussed below A-E.

Here we use Landsat imagery to identify the retreat of five tributary glaciers that have fed or are feeding into the Jaundhar Barak from the ridge to its north from 2000 to 2012. Jaunhar Barak is a 19 km long glacier with a north and south arm, here we focus on the north arm. The glacier begins near 6000 m and quickly drains into the main valley, at 4900 m the debris cover begins and the lower 13 km of the glacier are debris covered to the glacier end at 3900 m . The tributary glaciers are each a potential income stream for the main glacier, which when lost lead to less snow and ice “income” for the main glacier and then thinning and retreat will follow. The Jaundhar Barak Glacier is The five tributaries are labelled A-E. A comparison of the 2000, 2011 and 2012 images below indicate that: At Point A in 2000 two arms of the tributary glacier joined and it flowed out of the high alpine basin it was in, by 2011 and 2012 the two glacier arms have separated and the glacier is confined to the upper basin. At Point B there is a well established glacier tongue that extends halfway from the tributary to Jaundhar Barak, and by 2012 this tributary terminus has pulled back 200 m, which is nearly 200 m of elevation change also. At Point C in 2000 this tributary joins the main valley glacier and a small tongue of blue ice, its contribution can be seen heading downglacier. By 2012 the Point C tributary no longer reaches the main glacier. At Point D in 2000 the tributary joins the main glacier and like the previous tributary contributes a small tongue of blue ice that heads down the Jaunhar Barak Glacier. By 2011 the Point D tributary is no longer reaching the main glacier. At Point E in 2000 this accumulation area for the glacier is nearly all covered with glacier ice, with only a couple of small bedrock areas seen below the Point. By 2012 the bedrock exposed has coalesced into a one kilometer region separating a portion of the upper glacier from the main valley glacier. The ice from this tongue still may reach the lower glacier via avalanching. The last decade of loss on tributary glaciers more than 10 kilometers above the terminus of Jaundhar Barak indicates that downwasting and retreat of this glacier will continue. This glacier follows the pattern of other glaciers in the Garhwal of the Himalaya in its retreat and downwasting, Jaonli Glaicer, Gangotri Glacier, Satopanth Glacier . It also will feeds hydropower projects as do the other glaciers.
tons river 2000
2000 Landsat Image of tributaries on north side of Jaundhar Barak Glacier.

tons river 2011
2011 Landsat image

tons river 2012
2012 Landsat image

Glacier du Tour Retreat, France

Tour du Glacier is in the Valle de Chamonix and is one valley north of D’Argentiere Glacier and two north of Mer de Glace. Here we examine the retreat of Glacier du Tour from 1988 to 2011 using Landsat imagery and Google Earth. In each image the purple arrow indicates the 1988 terminus. The yellow arrow the top of an icefall at 2650 m. The orange arrow a prominent turn in the Little Ice Age lateral moraine. The red arrow a location along the 2011 ice front. Point A is an area on the south side of the glacier that is thinning, and shows little residual snow accumulation. Point B is another location near the top of a small glacier across the border in Switzerland where ice is being lost at the top of the glacier. Point C is where the tributary flowing from below Aiguille du Tour joins the Glacier du Tour.tour de glacier ge. In 1988 the glacier terminated at 2200 m, the icefall was 1 km above the terminus and the Aiguille du Tour tributary flowed into the Glacier du Tour. At Point B glacier ice still crosses the ridge at the top of the glacier. By 1999 the had retreated 100 meters, the Aiguille du Tour tributary still reaches the main glacier but is less than 200 m wide. By 2004 the terminus had retreated 200 m (red line) and the glacier is still quite crevassed near the terminus. In 2009 the area of the glacier around Point A has lost nearly all of its ice cover. Several rock knobs are protruding through the ice, purple arrows. The glacier has retreated another 200 m since 2004. At Point C the Aiguille du Tour tributary has a narrow finger that reaches the main glacier. In the 2011 Landsat image the Aiguille du Tour tributary no longer reaches the main glacier. At Point B the ridge that had been ice covered connecting two glaciers is now exposed. There is no snow left on the southern section of the glacier above and flowing down to Point a. The icefall region is now just 500 m above the terminus. The activity of the icefall indicates a continued active flow. The Aiguille du Tour tributary and portion of the glacier feeding Point A do not have significant retained snowcover and are not in equilibrium. tour de glacier 1988
Landsat image 1988, purple arrow indicates the 1988 terminus.

tour de glacier 1999
1999 Landsat image.

tour de glacier 2004
2004 Google Earth image with a red line indicating terminus.

tour de glacier 2009
2009 Google Earth image. Purple arrows indicate bedrock knobs emerging from beneath the ice.

tour de glacier 2011
2011 Landsat image with a red arrow indicating the terminus.

Jaonli Glacier Thinning and Retreat, Uttarakhand India

Jaonli Glacier is in the Pilang basin which feeds the Bhagirathi River in Uttarakhand. The glacier is 20 km west of the well known Gangotri Glacier and 30 km east of Jaundhar Barak. The glacier is one valley north of the well studied Dokriani Glacier. Jaonli has a heavily debris covered terminus which slows the retreat of the actual terminus, while upglacier thinning has been quite rapid. Here we examine Landsat imagery from 2000 to 2012 to illustrate the change due to increased melting. The glacier provides hydropower as it passes three Hydropower plants generating 1430 MW, including the 1000 MW Tehri Dam and reservoir, which also provides flood control, such as this past week of June 17, 2013(second image). The Tehri Reservoir level rose 25 m within 48 hours which is a storage of approximately 1.3 billion cubic meters. Jaonli Glacier is a heavily avalanche fed from the huge wall of rock on its northeastern flank, as noted by light blue arrows. In each image the yellow and orange arrows indicate the same location for comparison of the width of debris cover. The purple and red arrow indicate where two tributaries flow down to meet the Jaonli Glacier.jionla profiletehri dam map 2007

In 2000 the clean ice region of the main valley tongue of the Jaonli Glacier is 400 m wide at the yellow arrow and 500 m wide at the orange arrow. The eastern tributary at the red arrow joins the main valley glacier. At the purple arrow two small ponds are developing as the tributary that does not reach Jaonli melts back. By 2012 the debris free ice surface is 100 m wide at the yellow arrow and 200 m wide at the orange arrow. The debris cover spreads across the glacier as the clean ice melts faster thinning, and the debris covered area is then on an increasingly wide and high ridge above the clean ice and the debris then falls and oozes down onto the cleaner ice. The tributary at the red arrow still reaches the main glacier but is now covered by debris. The two ponds have merged at the purple arrow to create a larger terminus lake. IN Google Earth the images are from 2011. The first is a cross ice view towards the red arrow tributary, indicating the same locations and the extent of the debris cover. The second image is a closeup of the terminus, with a pink arrow indicating the 2011 terminus, note river issuing here and large ice face. However, there are two other developing termini with lakes forming 1 km upstream of the main terminus, green arrows. This stagnant ice in between will continue to melt and collapse. The glacier has retreated 160 m from 2000 to 2012, but will undergo an additional one kilometer retreat to reach the lake locations. This glacier fits well the overall retreat in the region (Kulkarni et al, 2007).Dokriani Glacier retreated at a rate of 17 m/year from 1962-2000 (Bhambri and Bolch, 2011). In the nearby Tons River Basin Mehta et al (2013) noted the 1962-2010 retreat of three glaciers Jaundhar (34 m/year), Jhajju (15 m/year) and Tilku Glacier (13 m/year). jaonli glacier 2000

jaonli glacier 2012

jionla debris

jaonli terminus 2011

Nioghalvfjerdsbræ (79) Glacier, Northeast Greenland

The Northeast Ice Stream in Greenland taps deeper into the heart of the Greenland Ice Sheet than any other glacier system. The ice stream has high velocities extending 700 km into the ice sheet, much longer than even Jakobshavn, first figure. This makes it a potential weakness for the northern sector of the GIS. The ice stream has three major outlets the Storestrommen, Zachariae and Nioghalvfjerdsbræ (79 Glacier). Fahnestock et (2001) identified that the initiation of fast flow occurred within 100 km of the ice divide and is driven by a high geothermal heat flux. Here we examine changes in the 79 Glacier using MODIS and Landsat imagery of the lower reach of the glacier. Nioghalvfjerdsbræ has a 20 km wide ice shelf, and the bed remains below sea level over a distance of 150 km upstream from the grounding line, and 200 km inland of the calving front, as indicated by the third figure below from Thomas et al, (2009).

greenland_velocity basene
Velocity of the Greenland Ice Sheet indicating extent of NE Ice Stream, (Bailey and Pelto, 2011).

negis velocity
Velocity map From Joughin et al (2010)

79 glacier profile
Bedrock Profile, surface profile and thickness change on a 79 Glacier Profile (Thomas, et al, 2009).

The most extensive field study of this remote glacier was conducted by GEUS(Geologic Survey of Denmark and Greenland) from 1996-1998(Thomsen et al. 1997). Thomsen et al (1997) denotes a floating ice tongue that is 60 km long and 20 km wide until expanding at the terminus to 30 km.They identified surface velocities in the terminus tongue section of the glacier, surface mass balance, ice thickness and bottom melting. he multi-year survey of the glacier by GEUS indicated that basal melting was approximately 4-5 m per year, much larger than the surface melt of 1 m per year. There works also indicates a rather uniform velocity for the floating ice tongue across the width of the glacier. Examination of ice thickness change on 79 Glacier indicates surface lowering predominated between 1994 and 1999, at rates of about 0.1ma–1, with almost exact balance further inland. Conditions were similar between 1999 and 2007, but with thinning rates increasing to about 0.3ma–1 over the seaward 150 km, and surface lowering of parts of the ice shelf by 0.5– 1ma–1 (Thomas et al, 2009).

Thomsen et al (2007) found surface velocities of 500 to 700 m per year in the region examined here, declining toward the ice front. The ice thickness declined from 325 to 175 m in thickness over a span 25 km in this same region. This is in a zone of limited change in width and most of the change has to be from basal melting. Given velocities observed of 600 m/year this would indicate a thinning of 150 m in a span of 40 years to traverse this reach. This would be a thinning for nearly 4 m per year via basal melting, a similar magnitude to the direct borehole observations.

Seroussi et al (2011) indicate the velocity declining from 800 m/year to 600 m/year in the reach examined here.
79 glacier velocity
Velocity of 79 Glacier and Zachariae Ice Stream from Jougin et al (2010).

Joughin et al (2010) observed no significant change in speed for the inland part of the Northeast Greenland Ice Stream. They further noted that for 79 Glacier there was no significant speed-up, and any change visible on its floating ice shelf can be attributed to tidal effects. Straneo et al (2012) found that the warmest (deep) AW is found near Helheim, Jakobshavn and followed by Kangerdlugssuaq and 79, with Petermann having the coldest. This suggests that basal melting can be an even more significant volume loss than on Petermann.

Here we pay particular attention to a section of the glacier that is 20-40 km from the calving front. A series of Landsat images from 2001 to 2013 track specific features as they move down glacier. The features A-D are each adjacent to specific unique features, specific meanders in two supraglacial streams. The movement of these features indicate the velocity over the 12 year period in this region, approximately 600 m/year. This agrees with the more detailed analysis of Seroussi et al (2011) , Thomas et al (2009) and Thomsen et al (1997). Further the spacing of these points has not changed indicating that the glacier in this region is moving as a single unit with relatively similar velocities. Further the persistence of the same streams and the ponds indicates The surface melting has led to development of numerous ponds and streams on the surface of the glacier. The lack of drainage of these features indicates the lack of crevassing, rifting or moulins to deliver water to the base of the glacier. The Petermann Glacier had several prominent rifts running transverse to glacier flow, that were clear weaknesses that would lead to future calving. 79 Glacier lacks such large rifts, just upstream of Point A is a prominent feature that at least at this point is not a rift. Pat Lockerby has noted these features in MODIS, but given the lack of water drainage and distinct break, these are not currently cracks.

79 glacier 2001 super
2001 Landsat image

79 glacier 2004
2004 Landsat image

79 glacier 2009
2009 Landsat image

79 glacier 2011
2011 Landsat image

79 glacier 2013
2013 Landsat image

The second set of images indicates the change in terminus position at the northeastern terminus from 2000 to 2011, purple dots, often referred to as Spaltegletscher. The yellow arrow indicates a longitudinal rift that has developed since 2000 that is nearly connected to another rift near the margin of 79 Glacier. Espen Olsen at the Arctic Sea Ice Forum has suggested that this is what will lead to this area breaking off. The orange arrow indicates the same location marking the terminus of the glacier at its northwest corner. The last image is from June 16, 2013 this MODIS image indicates the two rifts red and yellow arrow at the start of the Spaltegletscher terminus. Followed by Landsat image from June 17, 2013 indicating the new terminus position more clearly and the same rifts. Another iceberg has peeled off since 2011, and the total ice loss since 2001 is 70-80 square kilometers. Jason Box, Ohio State had noted a loss of about 50 square kilometers from 2000 to 2010. Also apparent is an area of active calving and icebergs in front of Zachariae, check out the new icebergs in the June 17, 2013 Landsat atZachariae Ice Stream79 glacier 2000
2000 Landsat image

79 glacier 2010
2010 Landsat image

79 glacier 2011b
2011 Landsat image

zis20130616AQUAJune 16, 2013 MODIS image, yellow and red arrows indicate two rifts at the start of Spaltegletscher.

79 glacier june 2013June 17, 2013 Landsat Image

Qinngua Avannarleq Retreat, Southwest Greenland

Qinngua Avannarleq is at the head of Evighfjorden an arm of Kangerlussuatsiaq Fjord in southwest Greenland. Leclercq et al (2012) notes the glacier is 15 km long and has an area of 57 square kilometers. qinnguaThey further note that the glacier retreated 0.5 km from 1850-1960. Here we examine Landsat imagery from 1996, 2000, 2009, 20011 and 2012. In each image the yellow arrow points to a tributary from the northeast that met the glacier at the terminus in 1996, the red arrow indicates the 2012 terminus location and Points A-D identify locations where bedrock exposure is expanding with glacier thinning. In 1996 and 2000 the terminus was 1.8 km wide and merged with a tributary from the north right at the terminus. In 1996 and 2000 Point C and D are uninterrupted glacier cover. At Point A and B there are narrow glacier tongues passing between rock exposures. By 2011 and 2012 the terminus has retreated 1.3 km from the 1996 position. At Point A the tributary that separated the rock outcrops has now disappeared leaving uninterrupted rock. At Point B the bedrock area has expanded and the narrow tributary no longer connects to the main glacier. At Point C a ridge of bedrock has extended 1 km further into the ice cap. At Point D a new bedrock knob has emerged amidst the main glacier. The retreat of over 1 km since 1996 is a greater retreat than had occurred from 1850-1990 (Leclerq et al (2012). The retreat of this glacier is similar to that of Narssap Sermia Glacier and Qaleriq Glacier. A nunatak 12 km inland also indicates thinning with a stranded section of ice, red arrows. This area also features very dirty ice, black arrows, that increases the albedo, which bring to mind the Dark Snow Project. qinngua Kujalleq 1996
1996 Landsat Image

qinngua Kujalleq 2000
2000 Landsat Image

qinngua Kujalleq 2009
2009 Landsat Image

qinngua Kujalleq 2011
2011 Landsat image

qinngua Kujalleq 2012quinngua Nunatak
2012 Landsat image

Canada Glacier Retreat Post Index

Canada Glacier Index
Canada has more than 20,000 glaciers spread across its arctic islands and in the mountains of the western provinces. Below is a list of 32 glaciers in Canada that are all retreating and chronicled glacier by glacier. I have had the pleasure of working on 10 Canadian glaciers.

great glacier 1914
Great Glacier, National Railroad Archive 1914 image.

Glacier Post List
Icemantle Glacier, British Columbia
Bridge Glacier, British Columbia
Snowcap Creek, British Columbia
Stave Glacier, British Columbia
Washmawapta Glacier, British Columbia
Bubagoo Glacier, British Columbia
Hector Glacier, Alberta
Helm Glacier, British Columbia
Jacobsen Glacier, British Columbia
Porcupine Glacier, British Columbia
Melbern Glacier
Warren Glacier, British Columbia
Castle Creek Glacier, British Columbia
Hoboe Glacier, British Columbia
Coleman Glacier, British Columbia
Tulsequah Glacier, British Columbia
Des Poilus Glacier, British Columbia
Decker and Spearhead Glacier, British Columbia
Columbia Glacier, British Columbia
Freshfield Glacier, British Columbia
Apex Glacier, British Columbia
Galaxy Glacier, British Columbia
Great Glacier, British Columbia
Devon Ice Cap, Nunavut
Dexterity Ice Cap Baffin Island
Penny ice Cap, Nunavut
Northern Outlet Devon Ice Cap, Nunavut
Penny Ice Cap SW, Nunavut
Mittie Glacier, Ellesmere Island, Nunavut
Snowshoe Peak, Yukon
Petain Glacier, Alberta
Saskatchewan Glacier, Alberta

Neve Glacier Retreat, North Cascades, Washington

I have had the opportunity to visit the Neve Glacier on eight occasions, it is not easy to get to. In the North Cascades it is one of a handful of glaciers with a large higher elevation accumulation zone, that is not on a volcano. The glacier feeds Diablo Lake, part of the Skagit River hydropower system. The terminus of the glacier in 1975 was in basin that receives considerable avalanche deposition slowing the retreat. In this post we focus on the thinning of the glacier leading to expansion of bedrock exposures at four locations above the former terminus, that by 2011 had led to this low lying basin being dynamically cutoff from the upper glacier. In each image the red letters A-D are located in the same spot, and the purple arrow on the Google Earth images indicates the terminus position. The first image is an aerial view of the glacier from Austin Post, USGS from 1975: at point A there is a quite small exposure of bedrock, at Point B and C there is a good connection of feeder glaciers from the higher slopes to the main valley glacier. At Point D there is continuous glacier cover. This was the case during my first two visits to the glacier in 1985 and 1988, second image. The third image is from 1990 and reflects limted change from 1975 as well, the blue arrows indicate glacier flow.

. By 1996 notable thinning of the glacier was apparent adjacent to Point A, in 2001 and 2002 the thin nature of the ice around the bedrock at Point A is evident. . The accumulation zone of the glacier around Point B and D in 2001 indicates no bedrock exposure at D and a connection of the upper glacier at Point B; however at Point D in 2009 the large new bedrock areas that have resulted from thinning has occurred. A comparison of the Google Earth imagery from 1990, 2006 and 2009 indicate the expanding bedrock at each Point. A closeup of Point A from 2009 has the bedrock delineated with red dots indicating that the left arm of the glacier that formerly encircled Point A, now ends above Point A and that the right hand arm is only 35 m wide and despite the steep slope has no crevassing and is stagnant. At Point B the upper glacier no longer reaches the main trunk. At Point C the connection to the main glacier has decreased by 50% in its width from 140 m to 70 m, and at Point D several large bedrock areas have emerged. In 2013 or 2014 the upper glacier will likely separate from the former terminus region below the Point A bedrock region. The thinning of this glacier is typical of North Cascade glaciers (Pelto, 2007), though the retreat has been unusually small (Pelto, 2010).

Excelsior Glacier Retreat, Alaska

Excelsior Glacier in Alaska has terminated in a lake for the last century. excelsior overviewHere we examine the retreat of this glacier from 1984 to 2011 using Landsat imagery. This glacier is seen as a model for the impending retreat of Brady Glacier examined in a paper we just published (Pelto et al, 2013). In 1909 the glacier ended on the strip of forested land between the lake and the ocean (Molnia, 2007). By 1950 the glacier had retreated 2 km from this strip of land creating the new lake (USGS-Molnia, 2008) In 1909 the glacier had ended on land at the south end of the lake, indicating a retreat of 4.5-5.0 km in approximately a 75 year period. In 1984 (first image below) Excelsior Glacier ended at the pink arrow and the lake extending beyond the terminus was 4.7 km long, the yellow arrow indicates the 2011 position and just south (under) the arrow is a glacier dammed lake. The lake width has changed little and is 1.4-1.8 km wide in the region the terminus has been retreating through during the last 30 years. By 1989 the glacier had retreated 500 m and the lake was filled with numerous icebergs. By 2001 the glacier had retreated 1500-1700 m from the 1984 position, a rate of 100 meters per year, and the glacier dammed lake south of the yellow arrow is still apparent, as are a couple of large icebergs. The 2003 Google Earth image indicates further retreat and again a couple of large icebergs and a large crack near the center of the terminus indicating a new iceberg getting ready to separate. By 2011 the glacier had retreated past the formerly glacier dammed lake and ended at the prominent ridge just north of this former lake and the new inlet that replaces it. The glacier has retreated 3400-3700 m depending where on the front the measurement is made. This is a rate of over 100 meters per year since 1984.
Another big change is the thinning and narrowing of the tributary entering on the east side of the glacier north of the terminus. This is illustrated in the last image with a combined 1989 image left and 2011 rigth and the red arrows pointing out three significant points of thinning and new rock-moraine exposure. This glacier has behaved in a similar fashion to so many Alaskan glacier from the nearby Bear Glacier, to British Columbia’s Melbern Glacieror Porcupine Glacier and southeast Alaska’s Chickamin and Norris Glaciers of southeast Alaska

excelsior 1984
1984 Landsat Image

excelsior 1989
1989 Landsat image

excelsior 2001
2001 Landsat image
excelsior ge
2003 Google Earth image

excelsior 2011
2011 Landsat Image

excelsior thinning
1989-2011 Landsat image

Zayul Chu Headwaters Glacier Retreat, Tibet, China

The headwaters of the Zayul Chu River is a series of glaciers. This river becomes the Lohit River as it enters India. The impact of glaciers is visible just from the color of the water, the greenish tone being generated from glacier flour. The Lohit River is also the focus on a hydropower development plan that proposes six dams that would generate 7450 MW.
zayul chu map
Glaciers at the Headwater of Zayul Chu noted by red, yellow and purple arrows.

lohit hp map
Map of proposed Hydropower Project for Lohit River, yellow arrows indicate dams.

lohit river
Table of hydropower characteristics for six proposed sites on Lohit River.

lohit hp
Lohit River, color indicates glacier contribution

Here we examine three glaciers that have seen lake expansion at the terminus in the last 25 years using satellite imagery from 1987, 1996, 2009 and 2011. In 1987 there was no lake at the end of the glacier ending at the purple arrow. In 1987 the glacier ending at the red arrow, ended in a narrow lake. At the yellow arrow the glacier ended in a small round lake in 1987. By 1996 the glacier at the red arrow has retreated leading to a lake that is 100 m longer than a decade before. The glacier at the yellow arrow has pulled from the lake it had ended in. In 2009 a small lake has formed at the end of the glacier with the purple arrow, a distance of 200 m. The glacier at the red arrow has retreated from the lake it had formerly ended in, a distance of 400 m. The glacier at the yellow arrow has retreated 200 m from the lake it had ended in. Each of these glaciers ends between 4200 and 4600 m and begins above 5300 m. The glaciers retain snowpack on the upper reaches each summer and will continue to retreat but can survive current climate. The retreat of the Zayul Chu headwaters glaciers parallels those of the Bode Zangbo Headwaters a short distance to the north and the Hkakabo Razi Glaciers a short distance south.
zayul chu 1987
1987 Landsat image

zayul chu 1996
1996 Landsat image

zayul chu 2009
2009 Landsat image

zayul chu 2011
2011 Landsat image