Colonia Glacier drains east from the Northern Patagonia Icefield feeding the Rio Colonia and then Baker River, Chile. A Feb 8th 2013 Landsat image caught the impacts of a jökulhlaup in progress, glacier lake outburst flood. This post examines the filling and emptying of Cachet Lake 2 and its impacts and the continued retreat of Colonia Glacier. The glacier is unusual in the number of lakes that are adjacent to or feed into the adjacent glacier dammed or proglacial lakes. In the image below Lake A=Arco Lake, Lake B=East Terminal Lake, Lake C=Cachet, Lake D= West terminal Lake, Lake E=Colonia Lake and Lake F=Cachet 2. 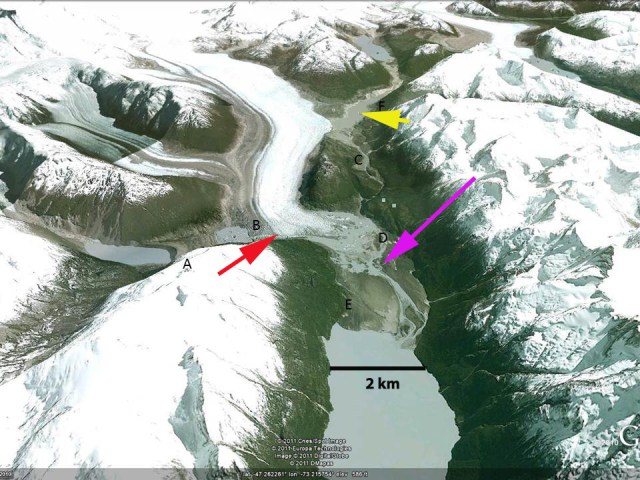 The glaciers recent retreat has been closely monitored by the Laboratorio de Glaciología in Valdivia, Chile. Aniya and others (1999)observed that Colonia Glacier began a rapid retreat after 1985, with a comparison of a RADARSAT image from 1997 and a Landsat 1987 image indicating a retreat of 400 m. From 1997-2005 the retreat has further accelerated, with a general frontal retreat of 2.5 km. The retreat has continued to 2013 as examined below.
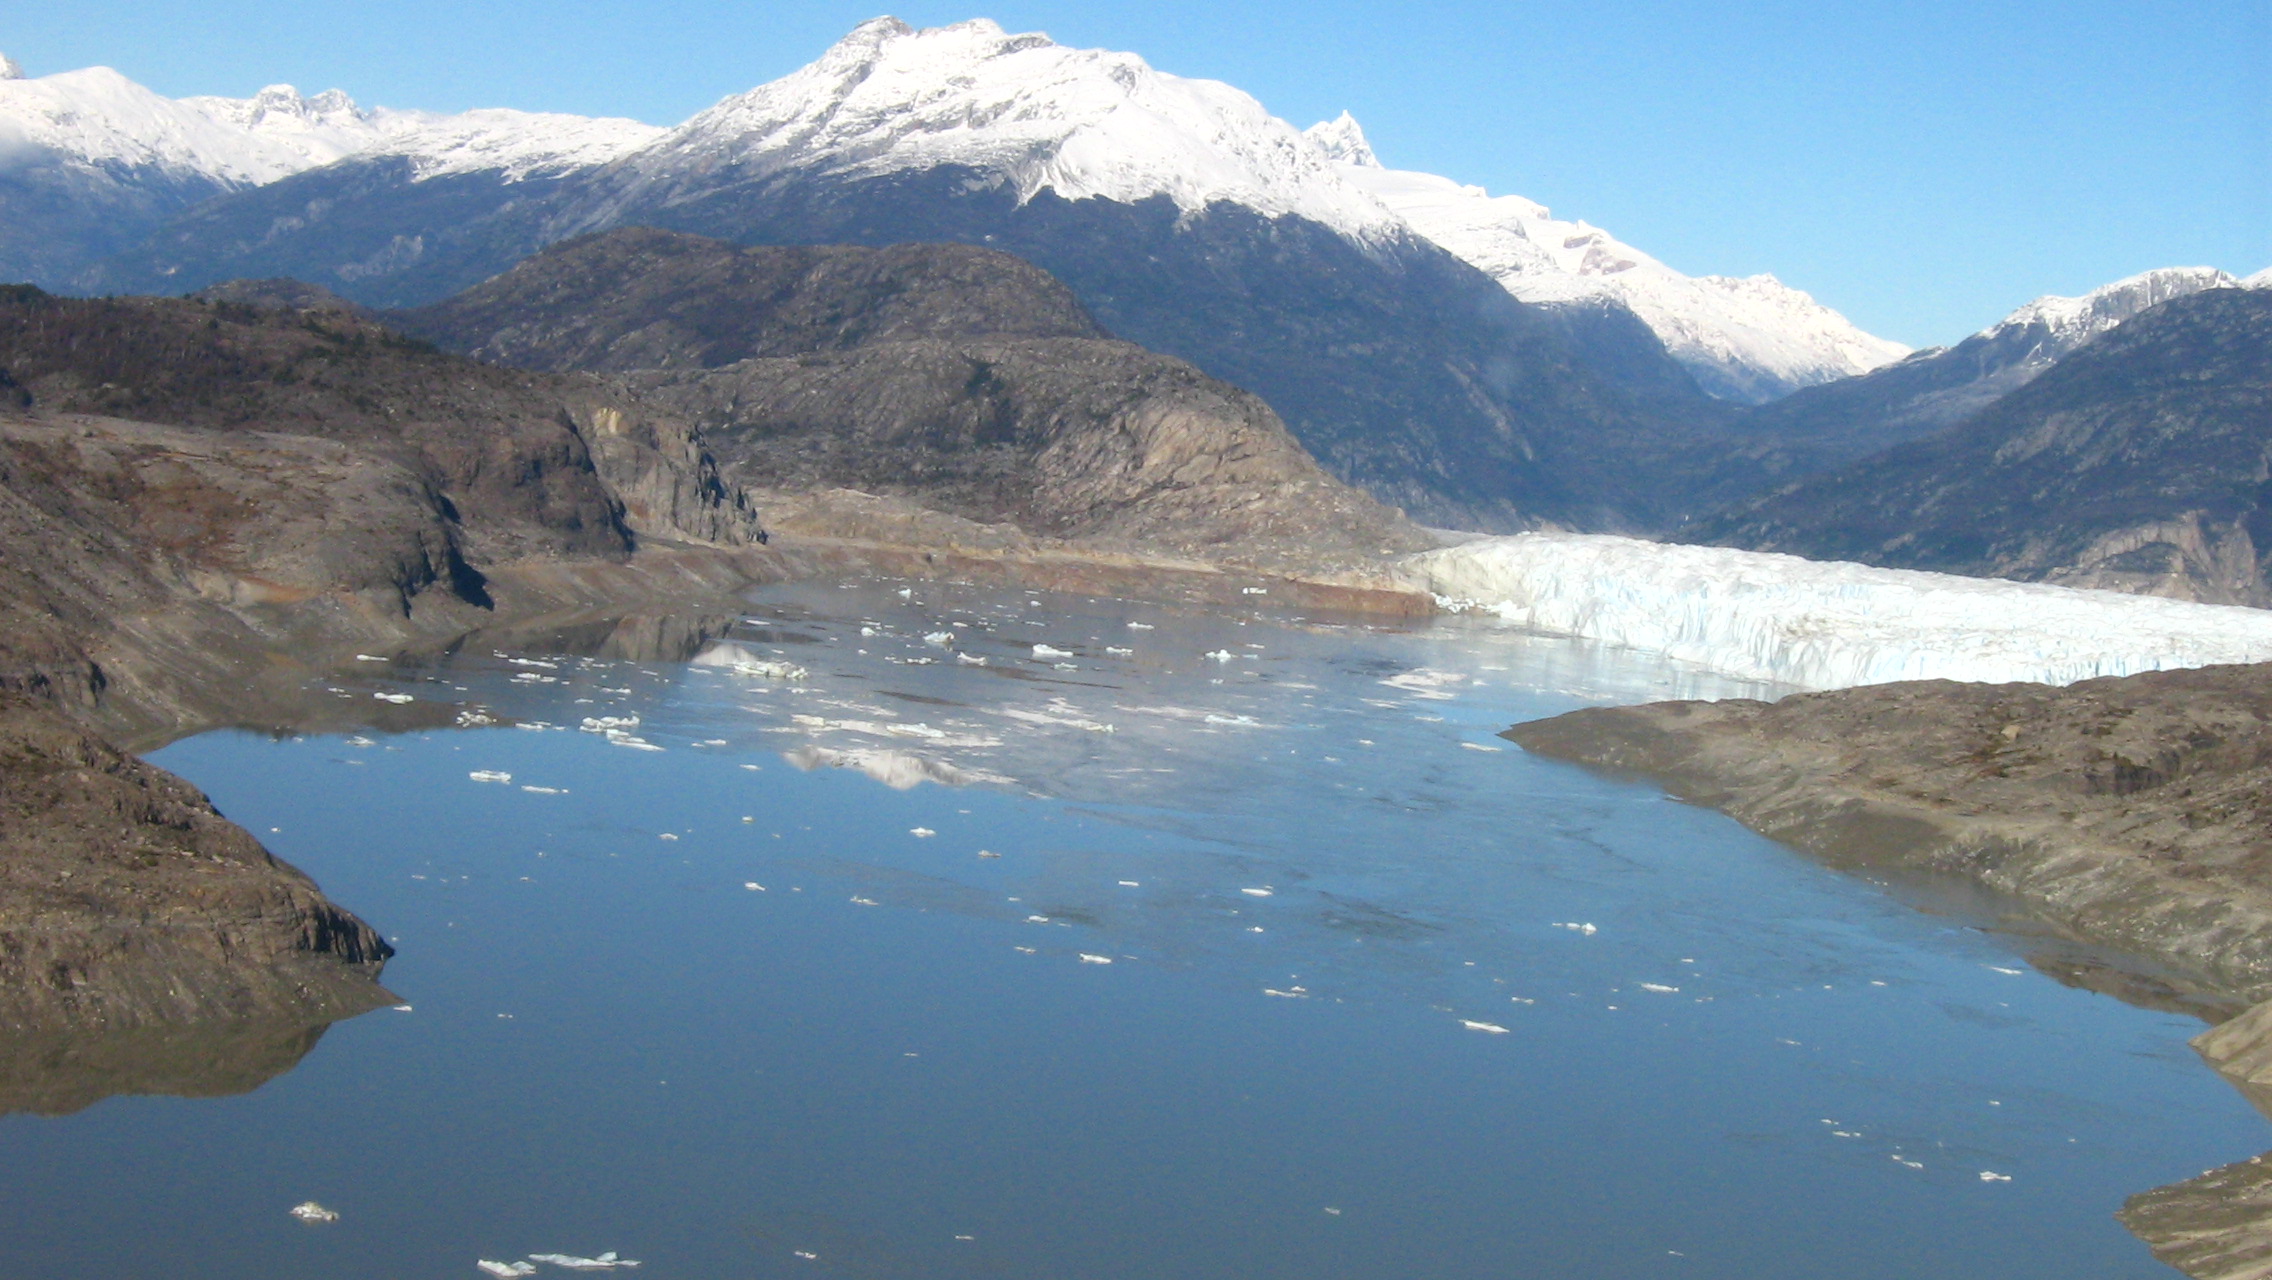
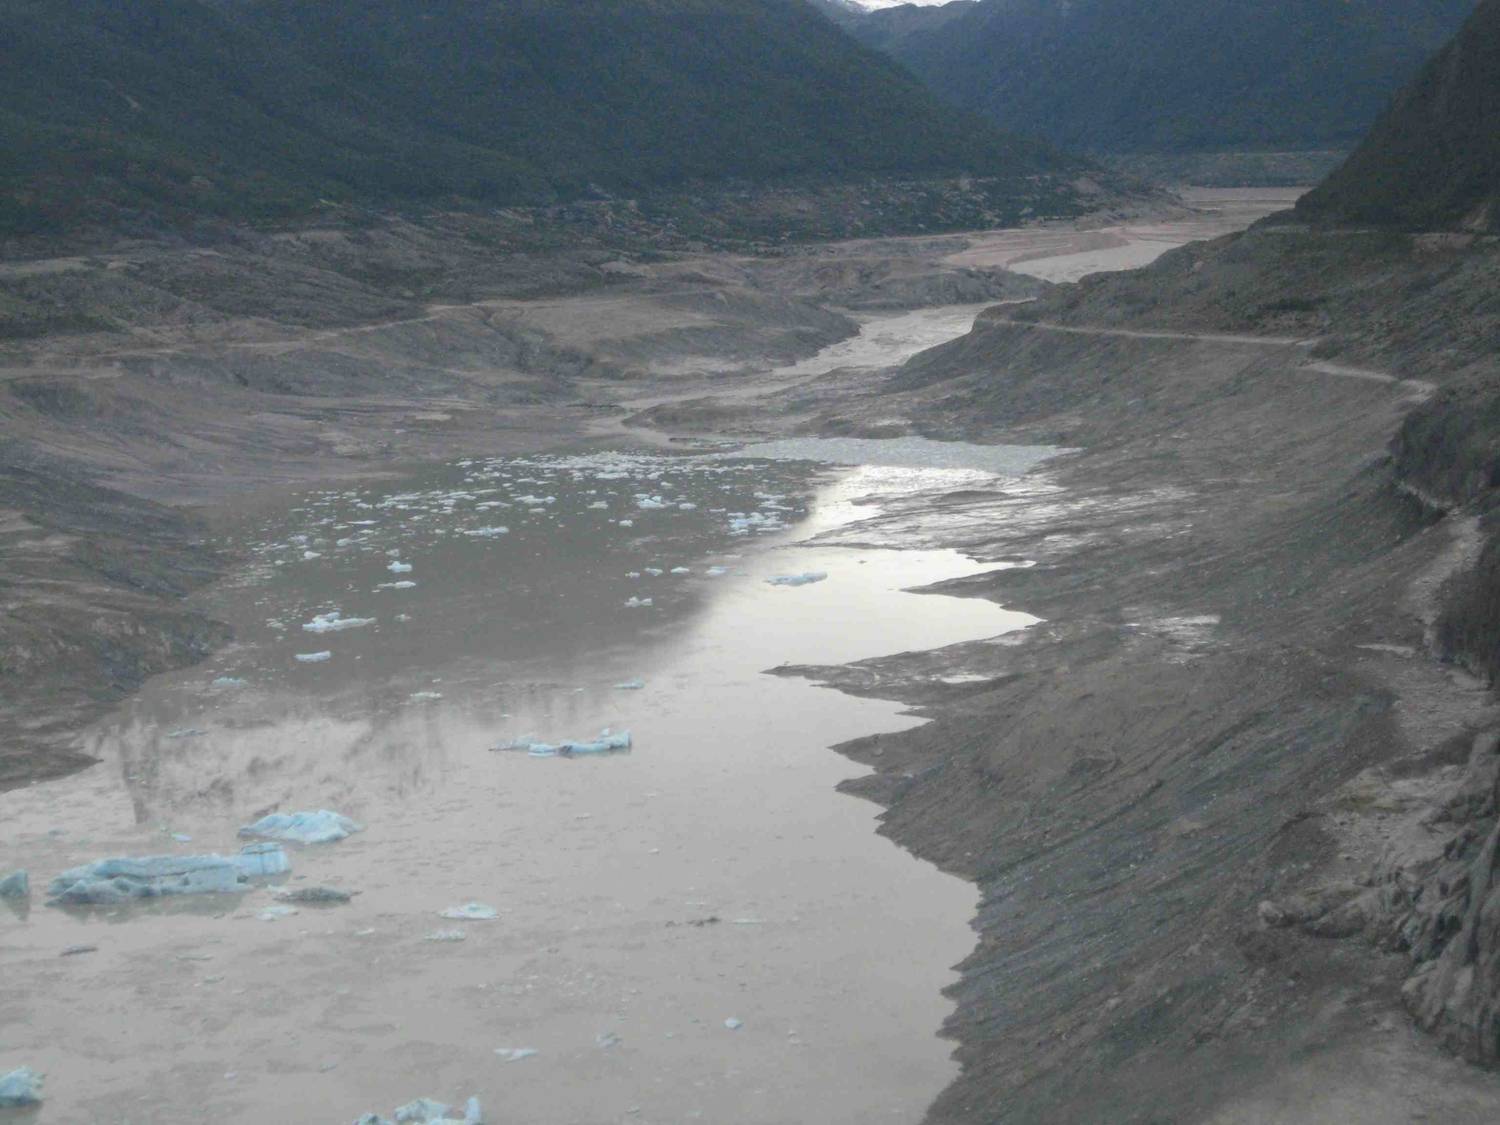
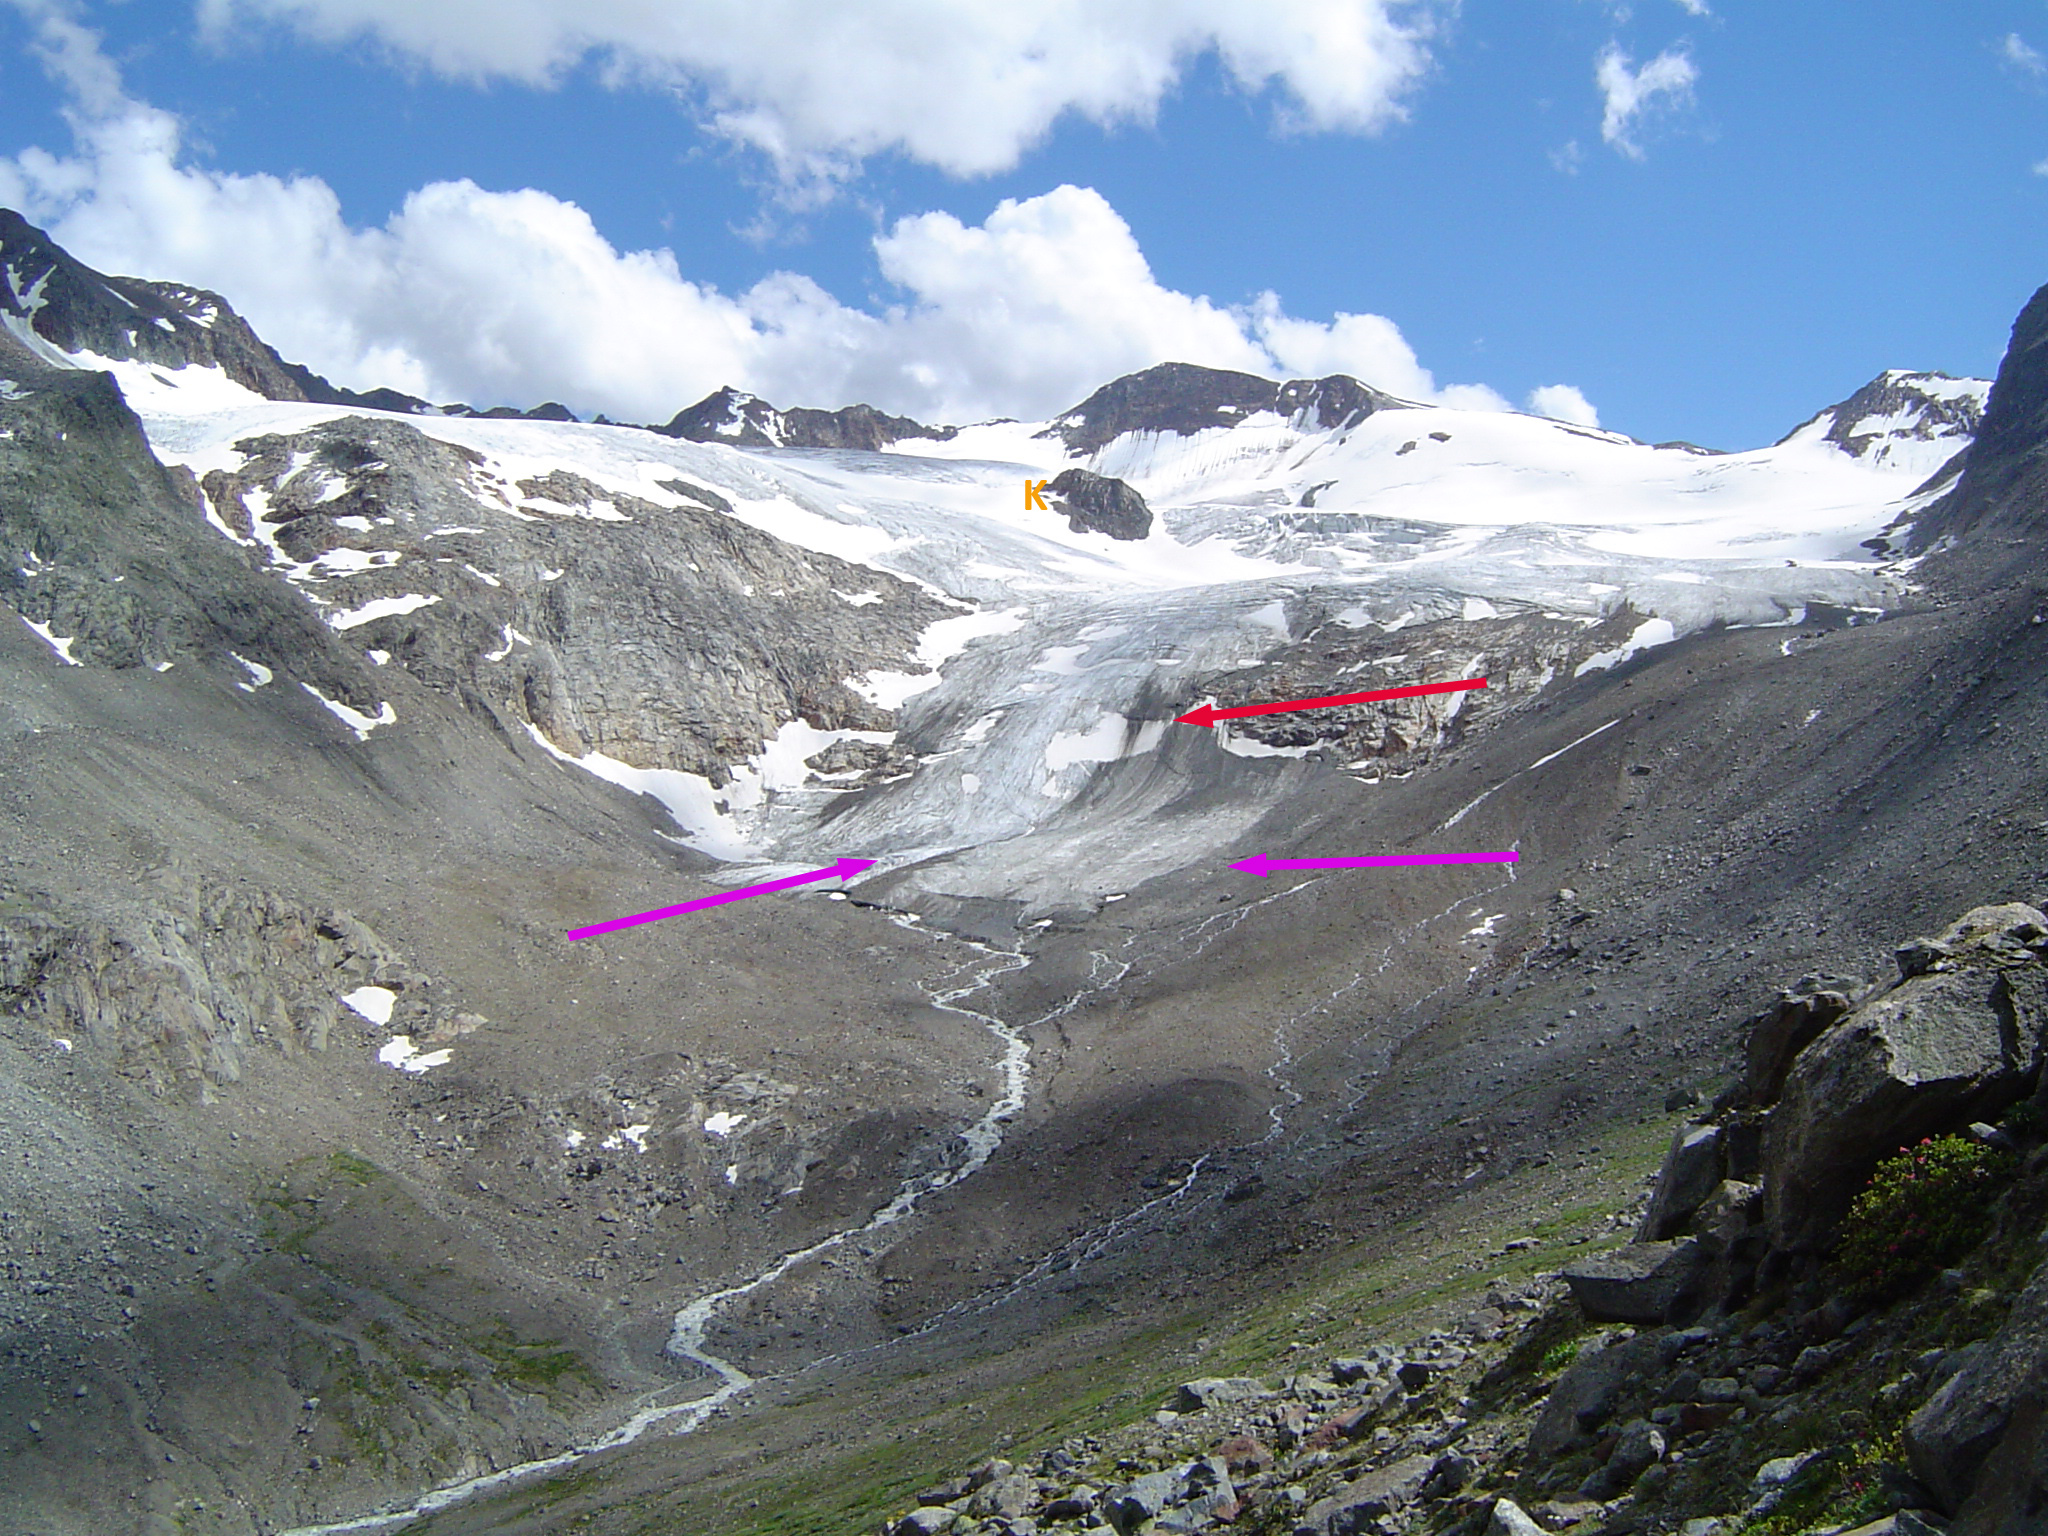
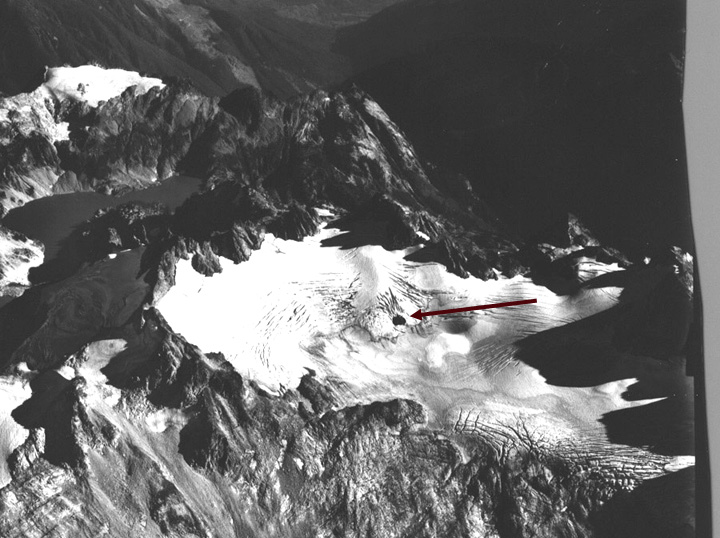
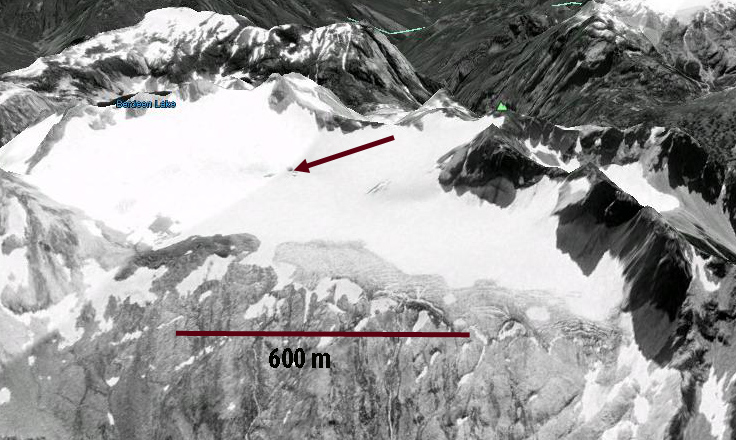
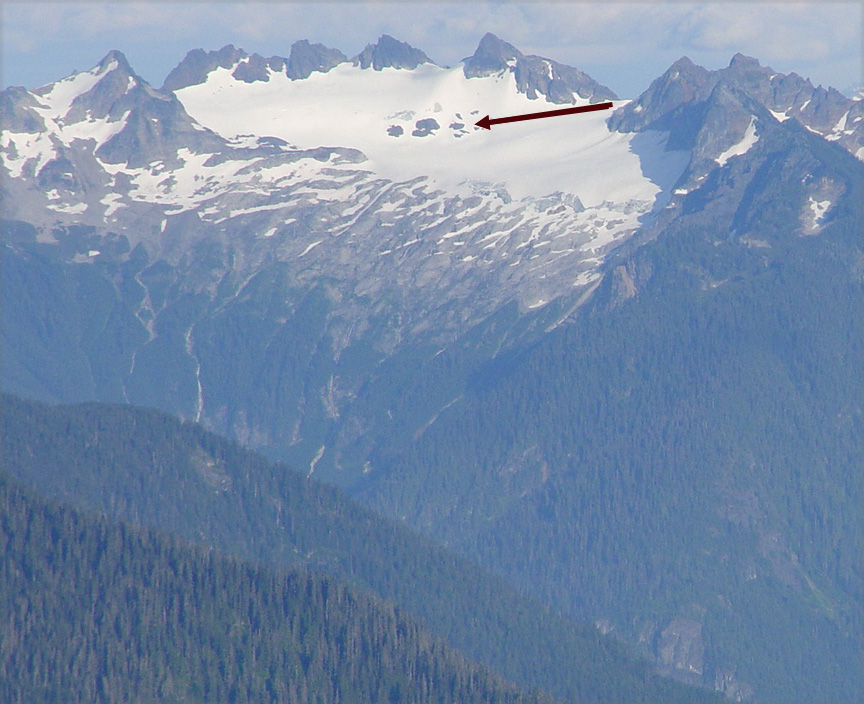
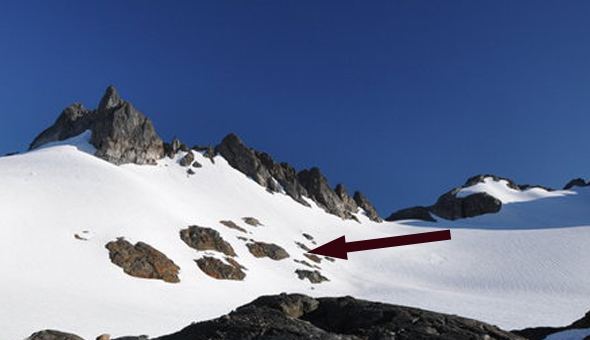
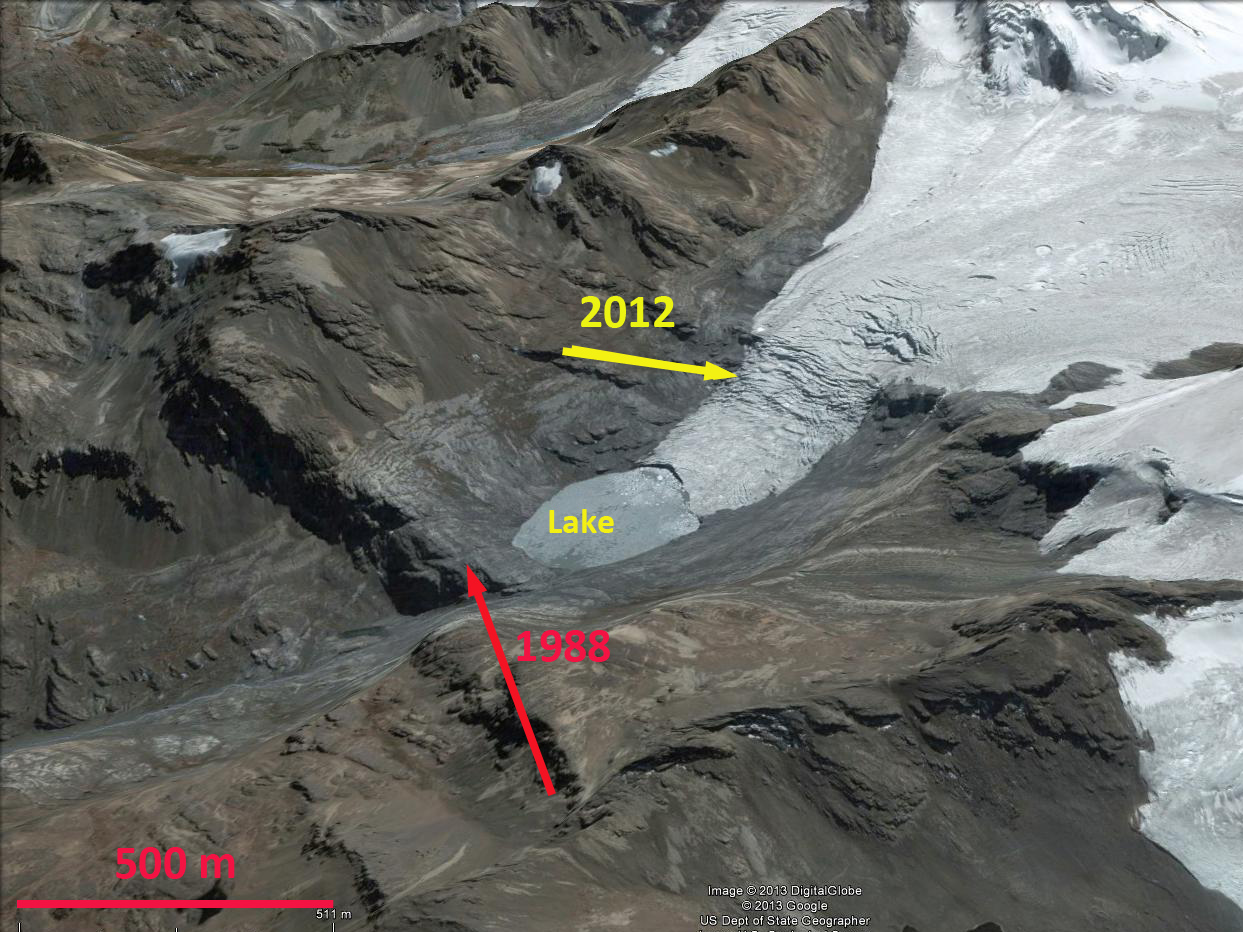
In the spring of 2008 Baker River suddenly tripled in size, in less than 48 hours, roads, bridges, and farms were severely damaged. Lake Cachet 2 had vanished the 5 square kilometer glacial lake had emptied 200 million cubic meters of water in just a matter of hours. This lake drained beneath the glacier after sufficient water had filled the lake to buoy part of the glacier and subglacial conduits had begun to develop. Since Cachet 2 emptied in April 2008, the lake has emptied thirteen times, with the Feb 7-8 release in 2013 the most recent. In 2008 the General Directorate of Water (DGA) setup a station to monitor the water level and telemeters this information, so that any outburst can be quickly identified. The two pictures below are of the Lago Cachet 2 basin filled and empty 

In this case notification came from Fabian Espinoza at the DGA.
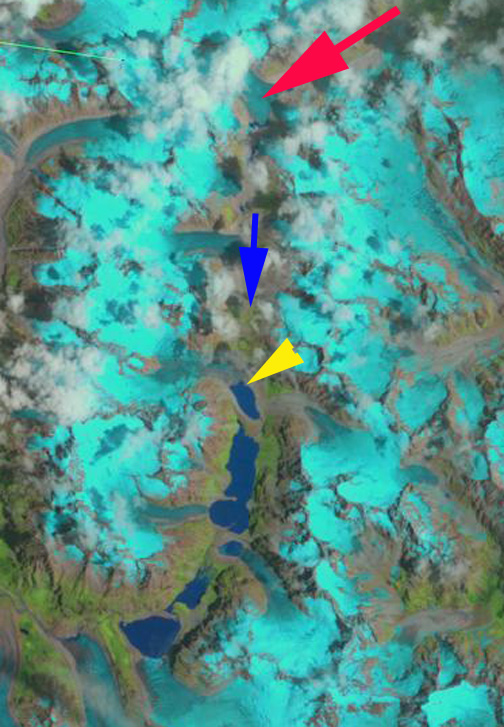
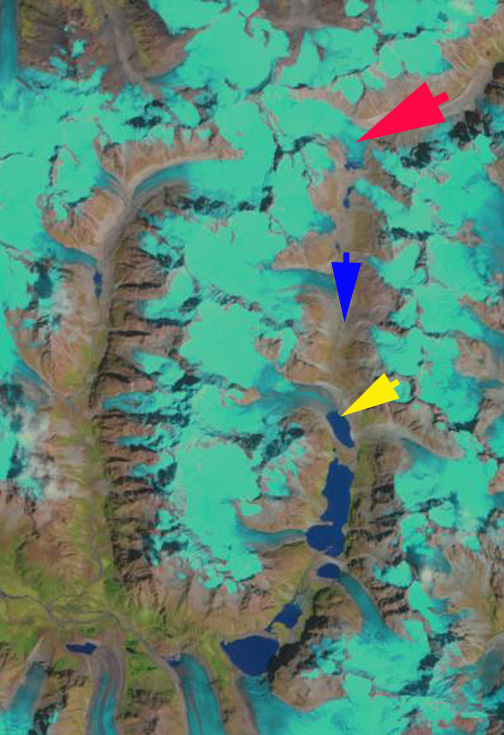
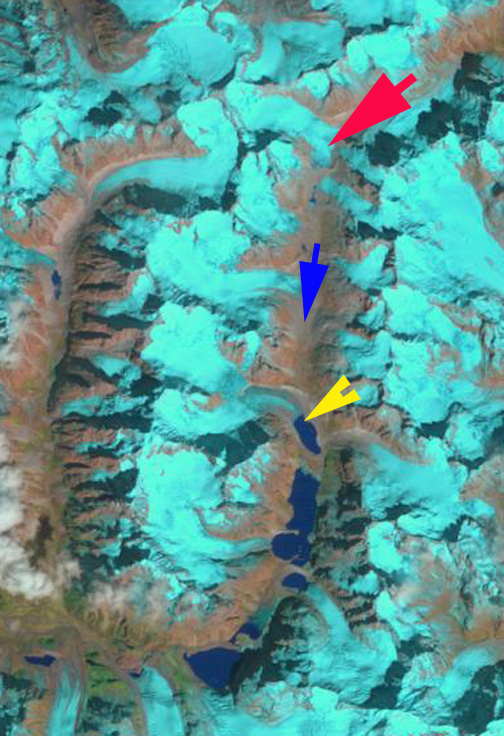
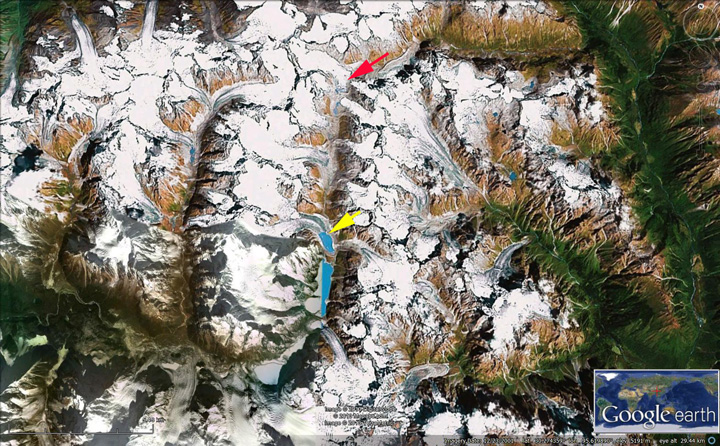
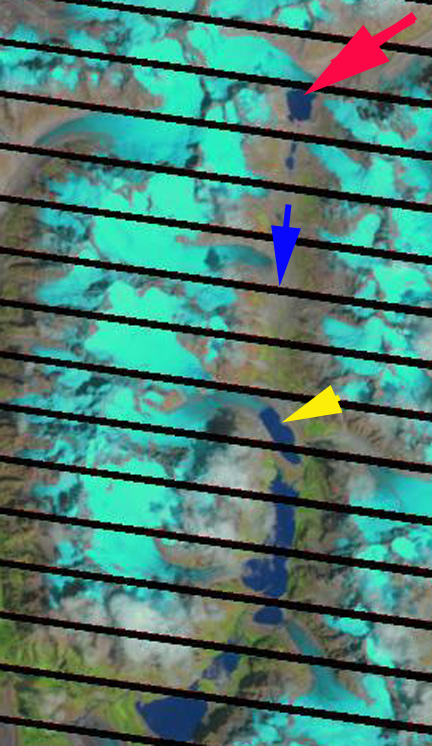
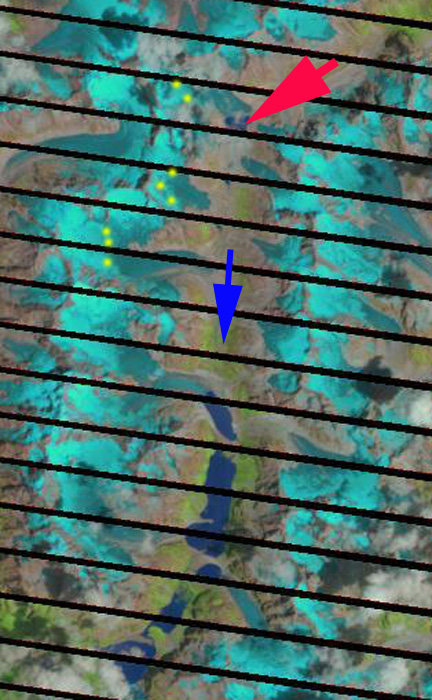
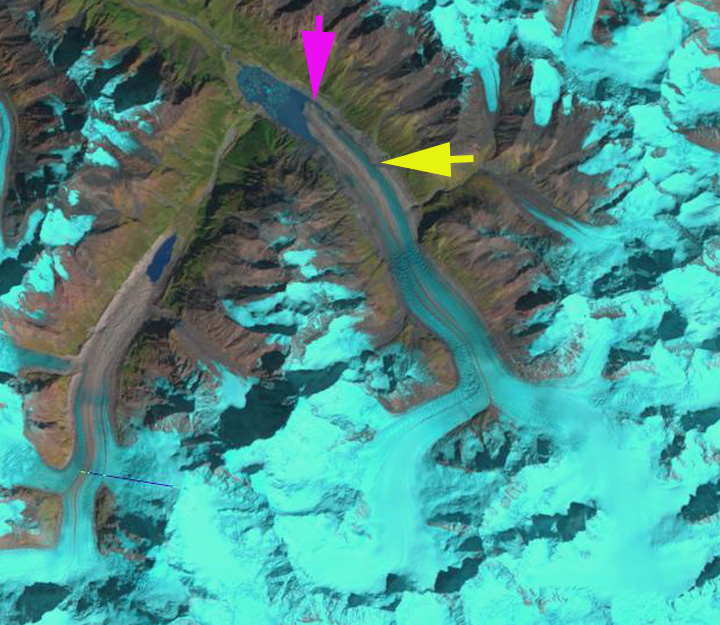
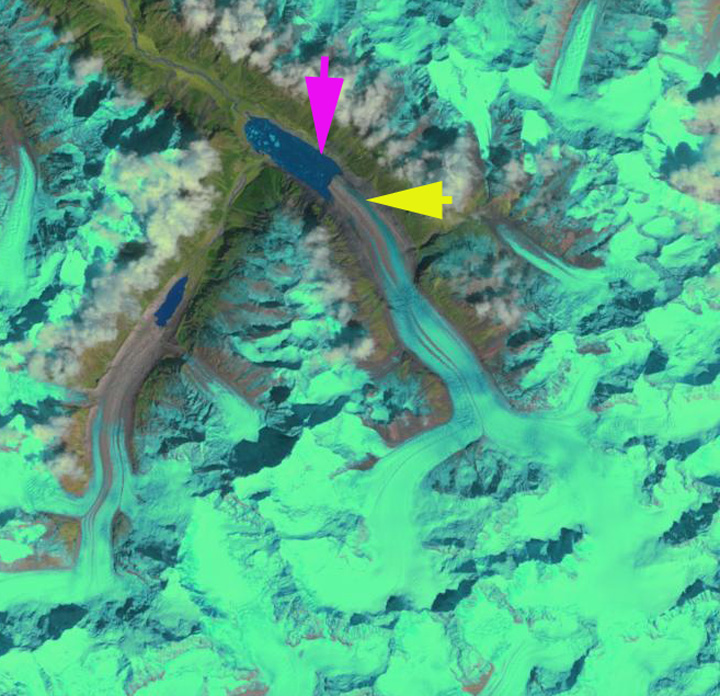
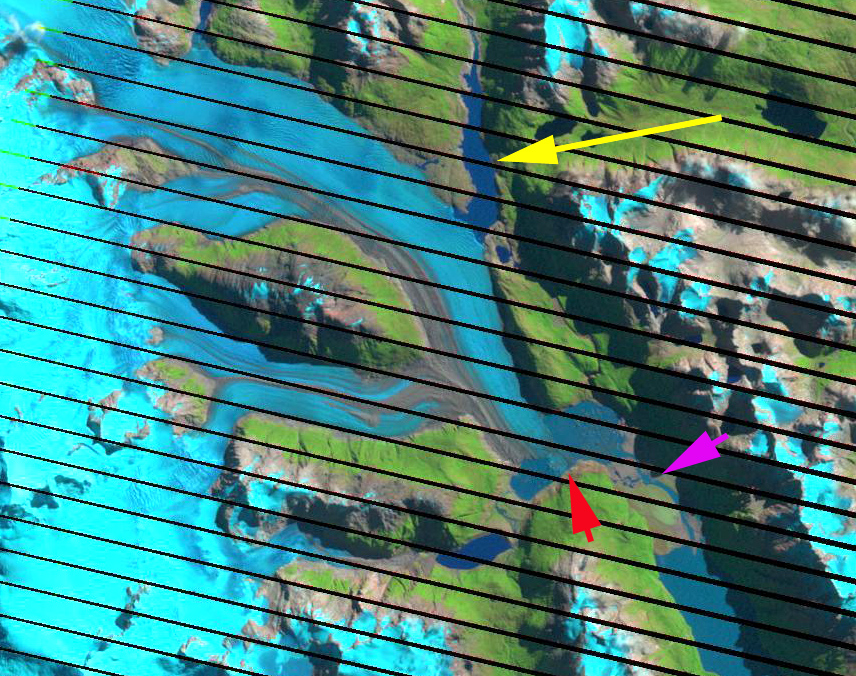
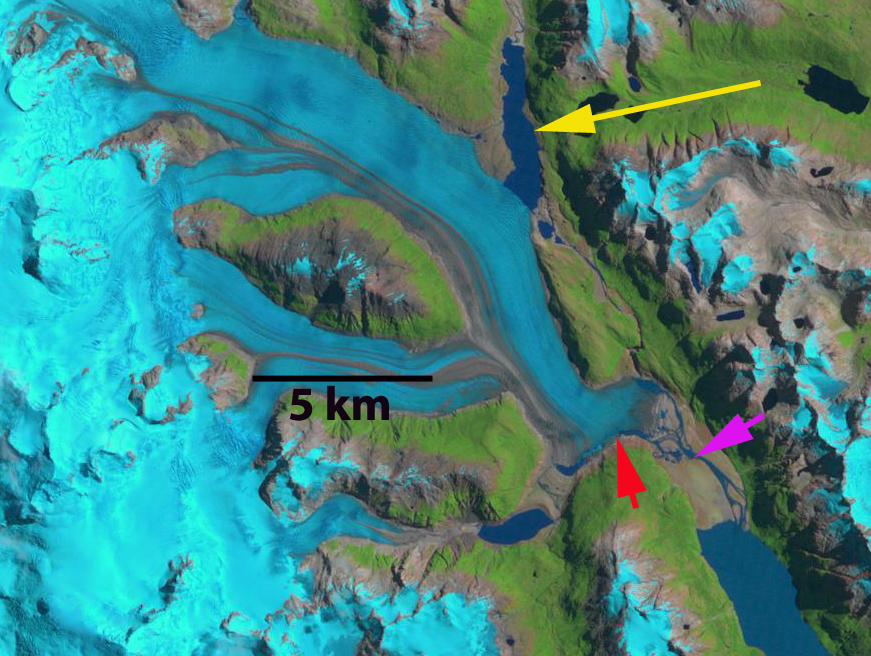
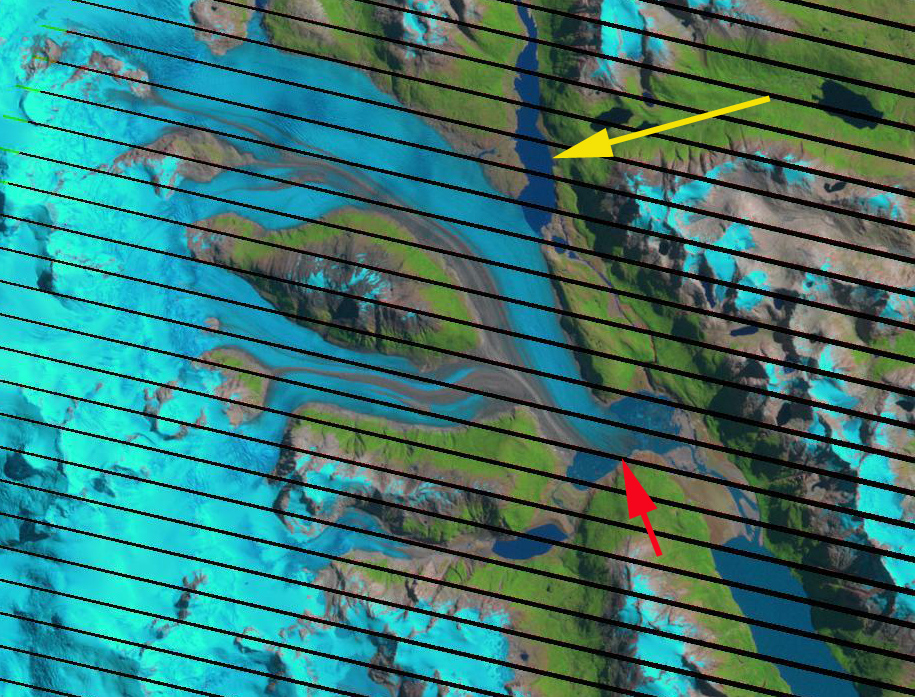
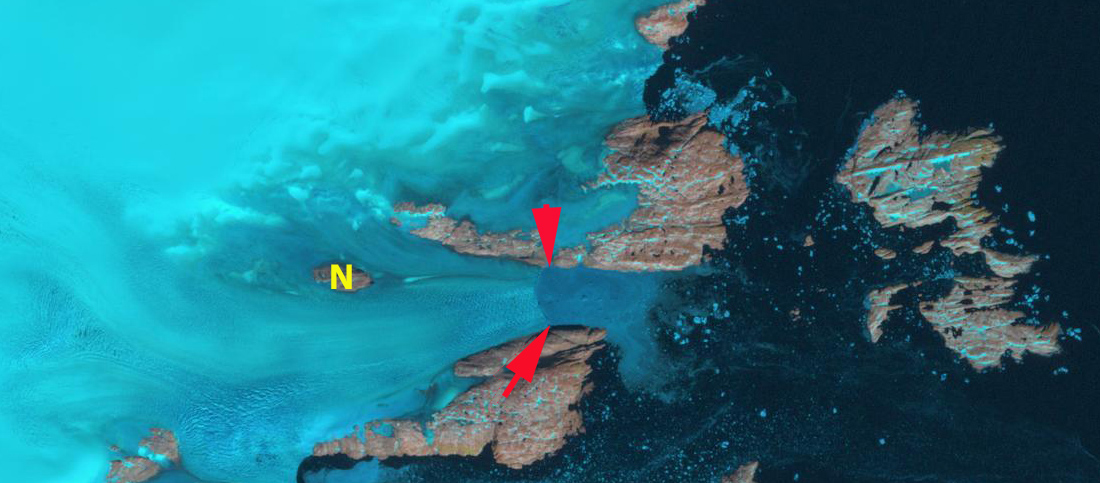
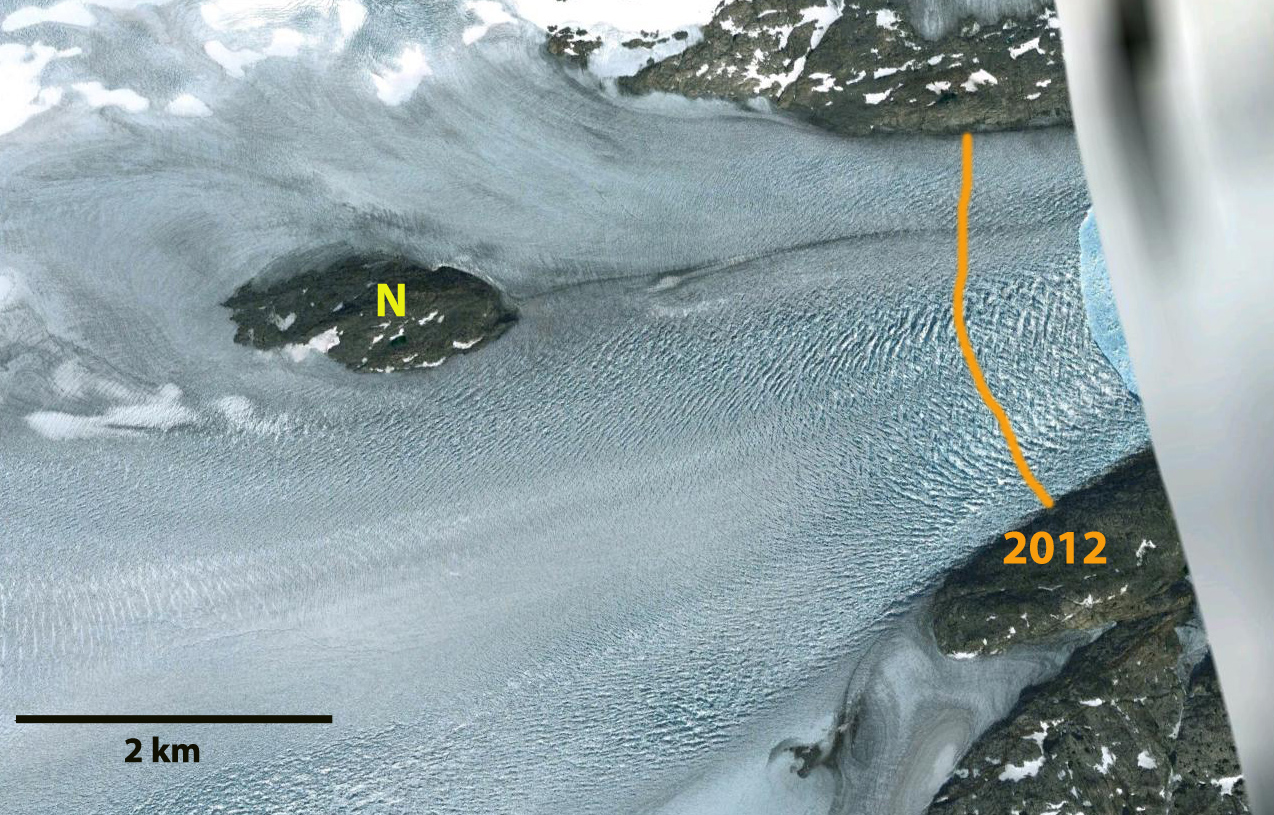
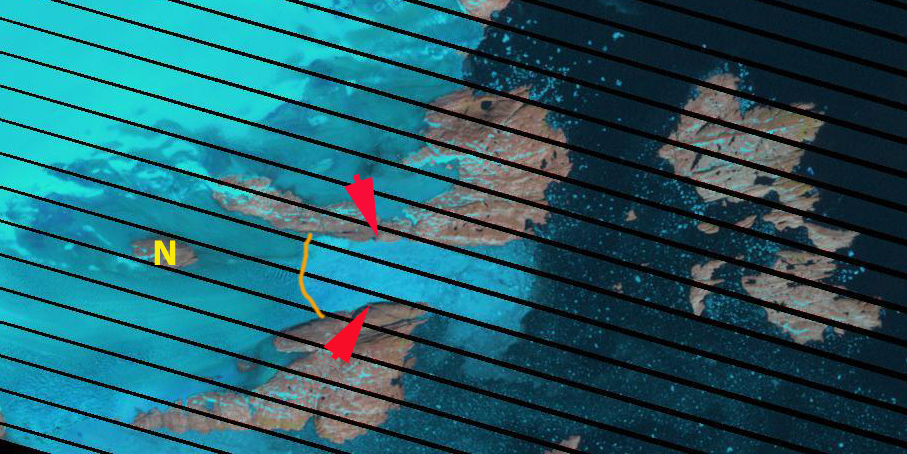
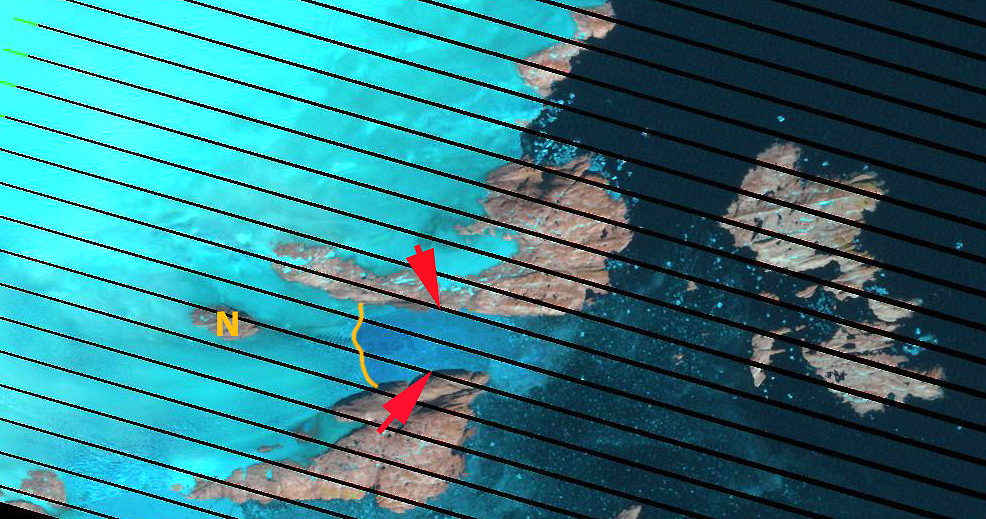
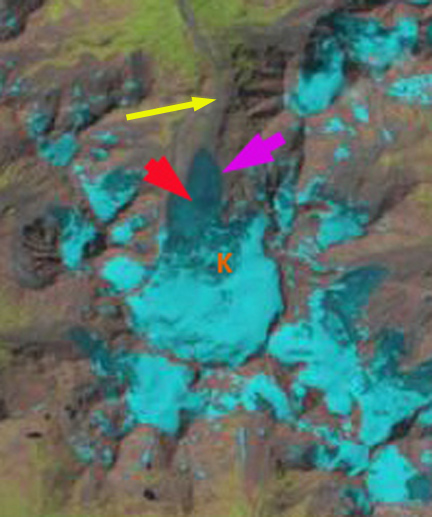
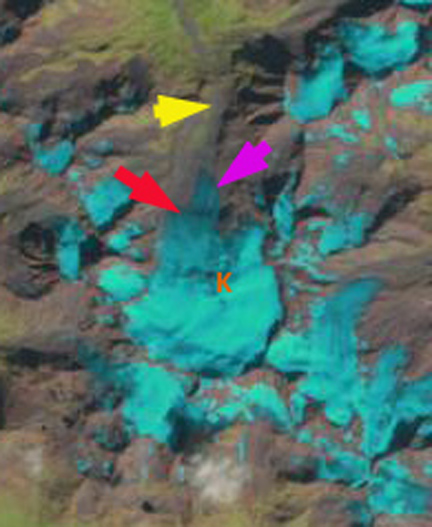
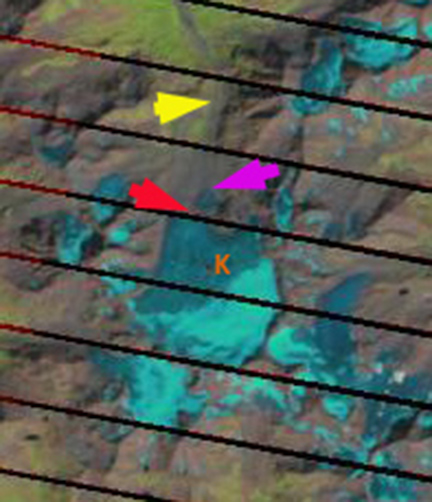
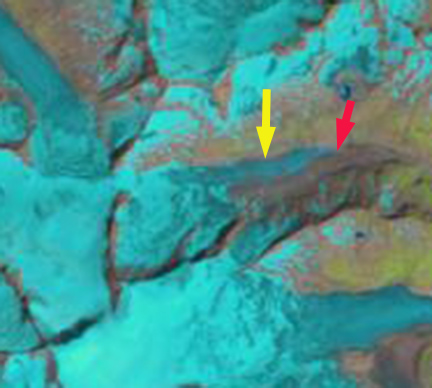
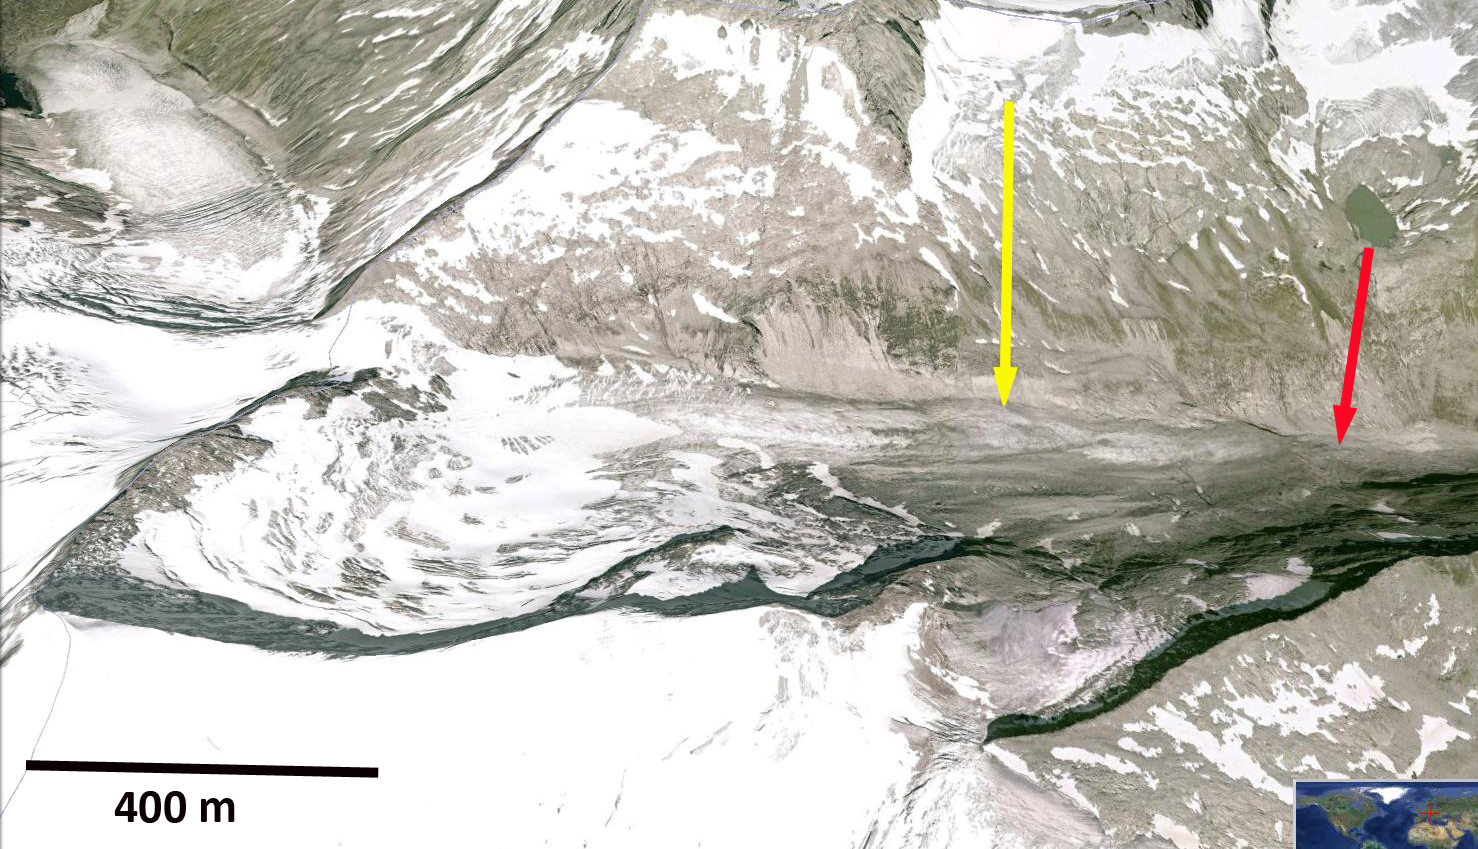
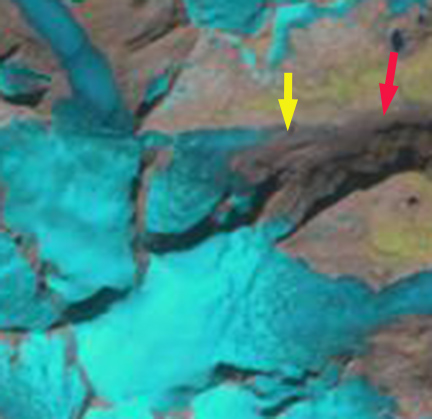
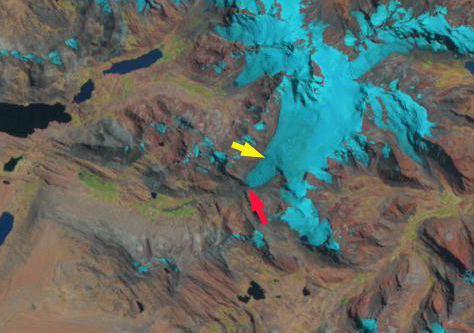
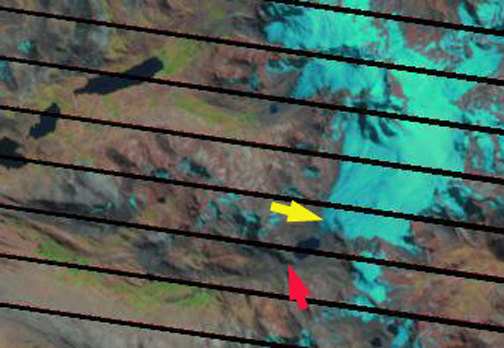
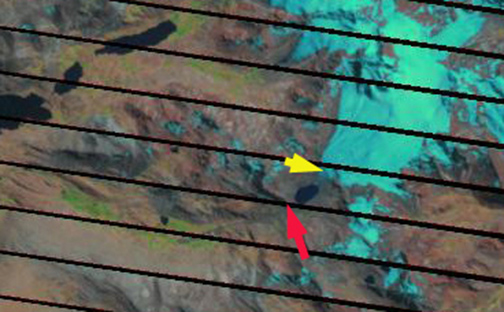
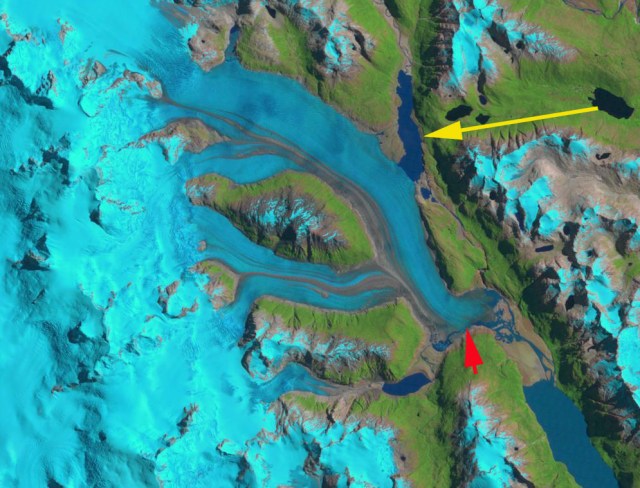
Below is a sequence of images from Sept. 17, 2012 when the lake is full, then on Feb. 8, 2013 just as the lake is finishing draining and then on March 28, 2013 after the lake has mostly refilled. The yellow arrow indicate Lago Cachet 2, the red arrow where the terminus has its last connection to a peninsula between the two proglacial terminus lakes and the purple arrow to the outwash plain between the proglacial terminus lake and Lake Colonia. In the Sept. 2012 image the east terminus lake has its normal water level and the outwash plain is 3 km long between the lakes. On Feb. 8th the water level in both Colonia Lake and the east and west terminus lake have been raised and most of the outwash plain is flooded. Even Colonia Lake has risen considerably, notice the southeastern edge of the outwash plain flooded by the outburst. By March 28, 2013 Lago Cachet is mostly filled again and the outwash plain is normal. The terminus connection to the red arrow peninsula has declined in width from 1 km in 2012 to less than 500 m by March 2013. The Feb. 2013 image indicates that the high water level in the terminus lakes partially submerged the terminus. 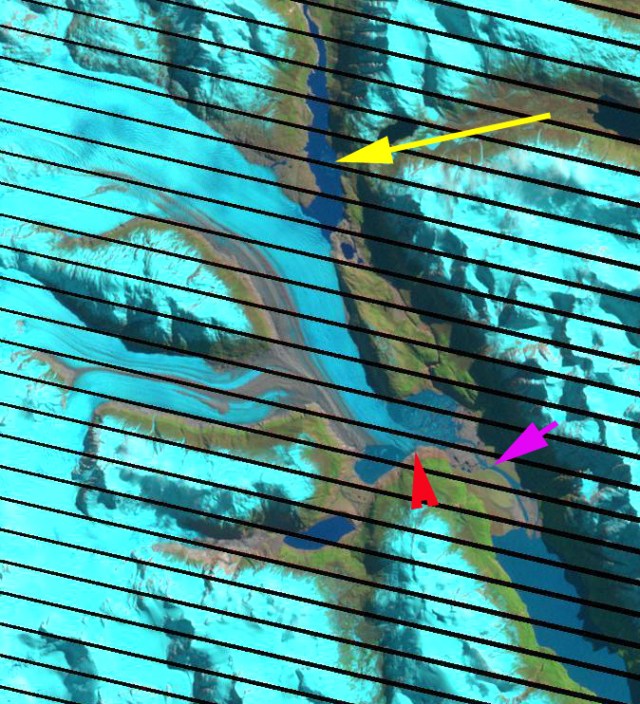
Sept. 17 Landsat
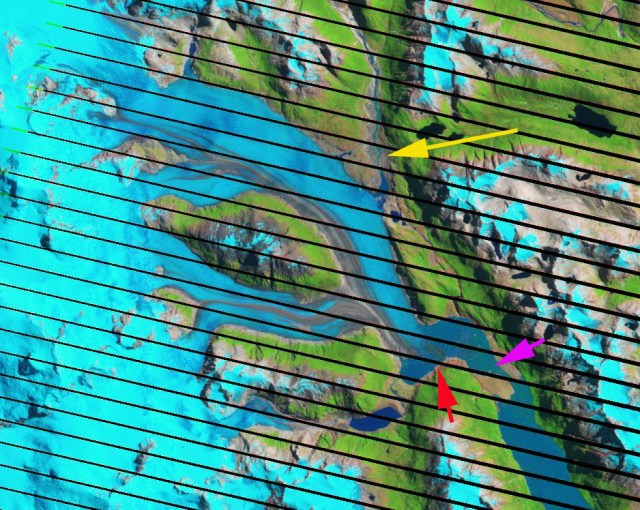
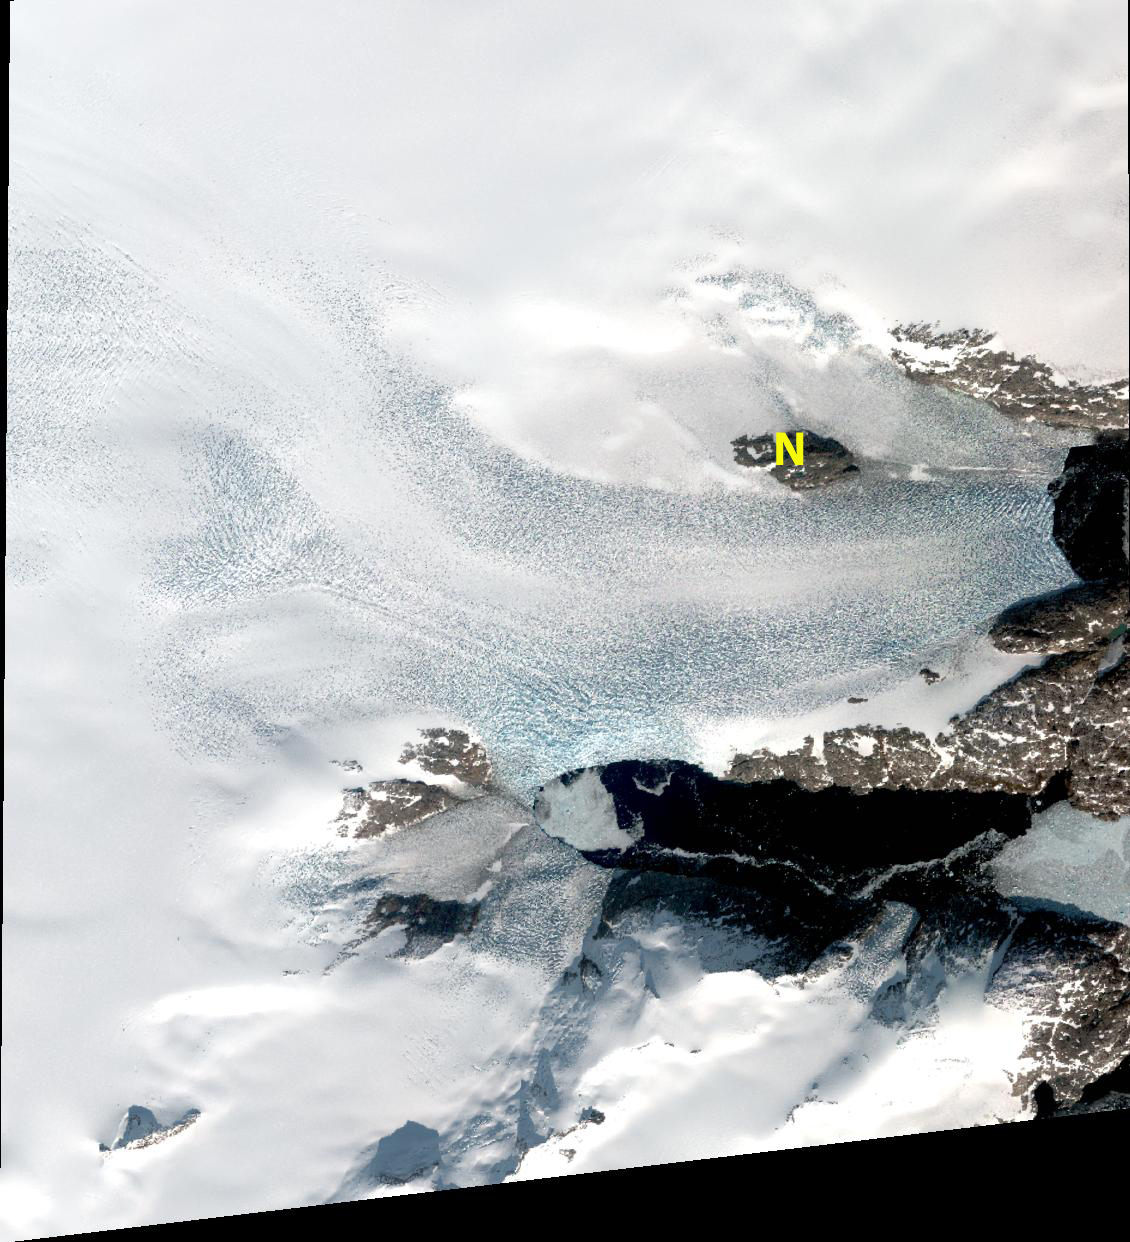
Feb. 8 Landsat

March 28, Landsat
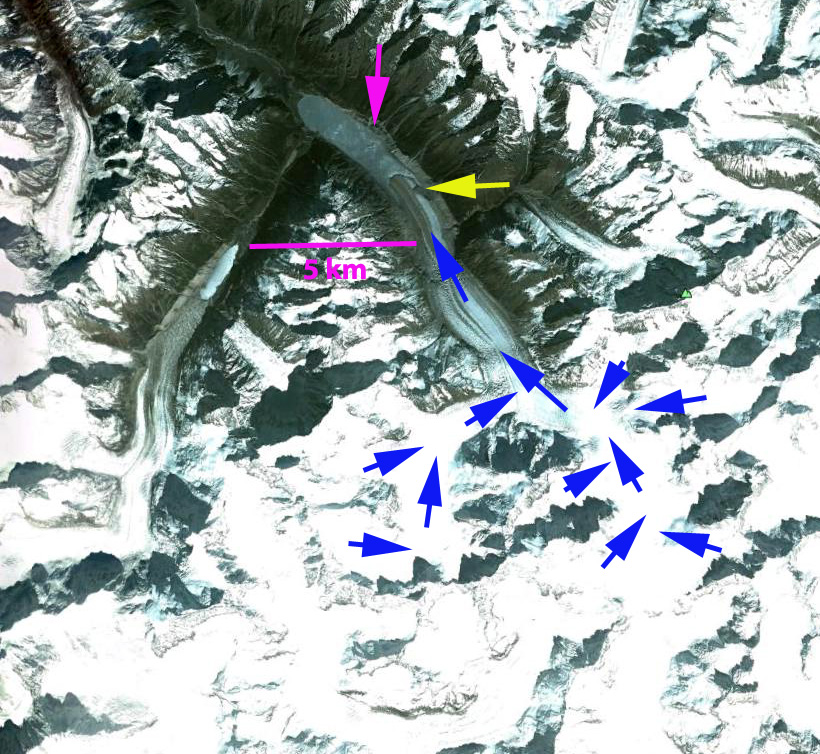
The terminus of the glacier continues to retreat and its area in the proglacial terminus lake basin contract. Below is a sequence of images from 1999, 2003, 2005, 2011 and 2013. In 1999 the terminus lakes barely exists. By 2004 the lakes have a combined area of 1.4 square kilometers. In the Google Earth image from 2005 this has expanded to 2.3 square kilometers. By 2012 the terminus lakes have expanded to an area of 4.0 square kilometers, and the glacier terminus has lost the same area. The connection to the red arrow peninsula will be lost very soon, which should lead to further terminus tongue breakup. This is much like the breakup observed at Glaciar Steffen and Glaciar Gualas 


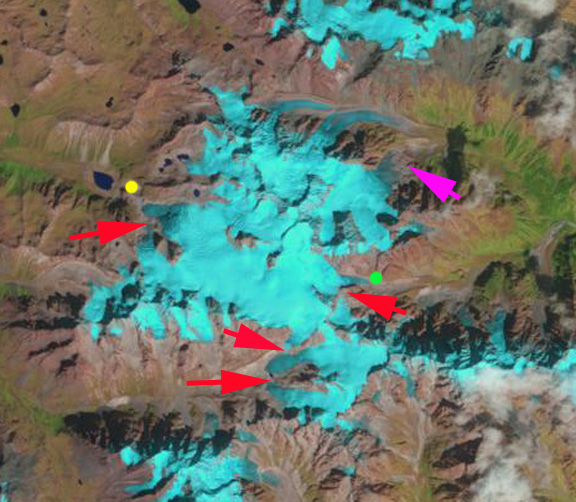
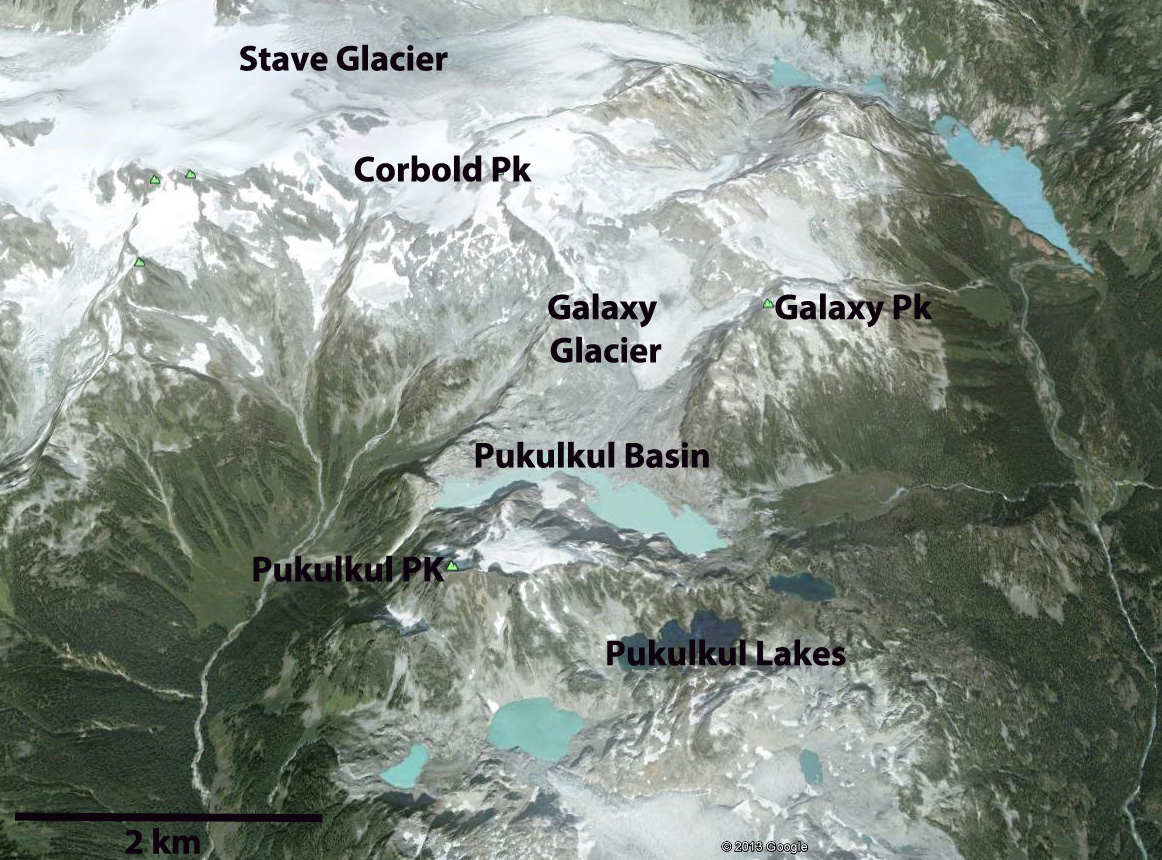
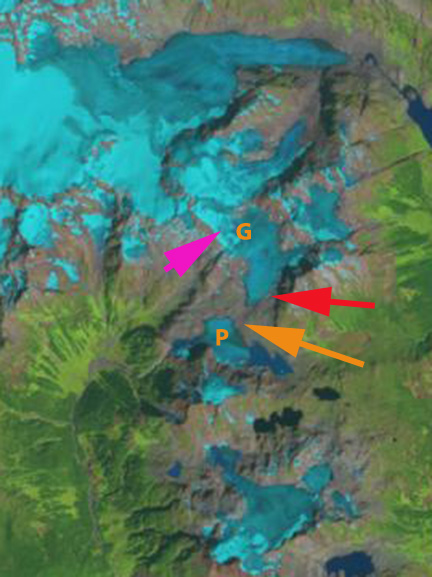
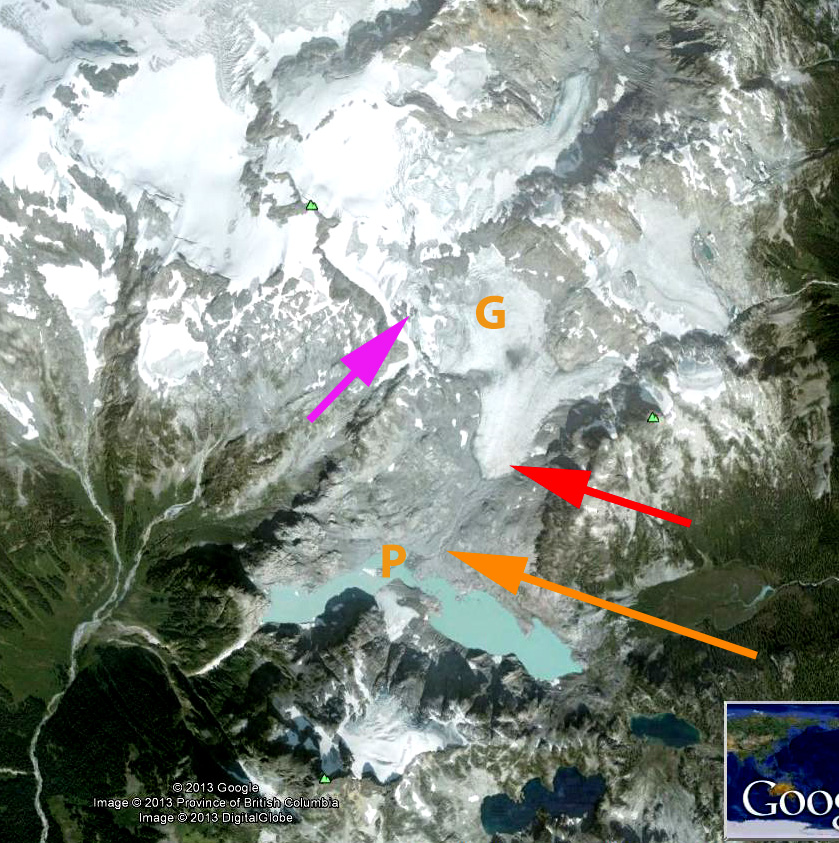
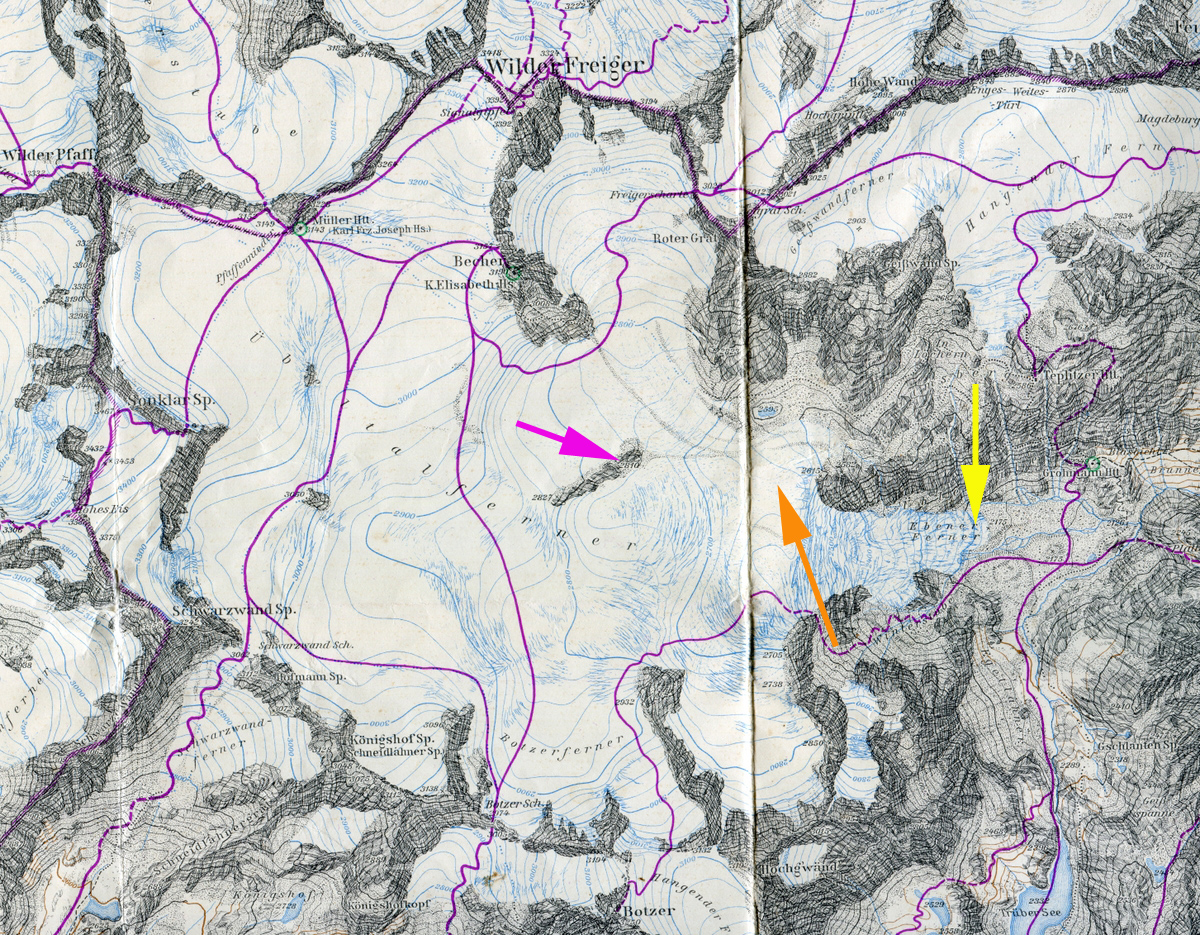
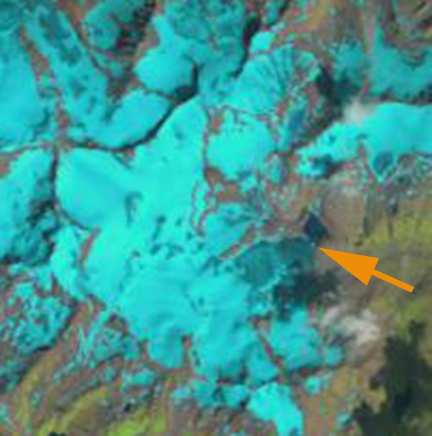
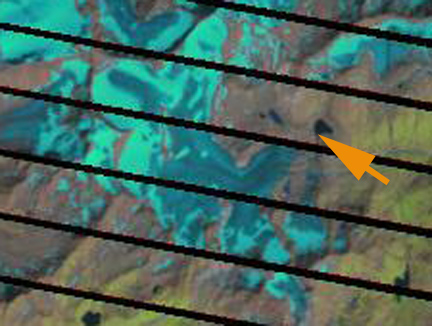
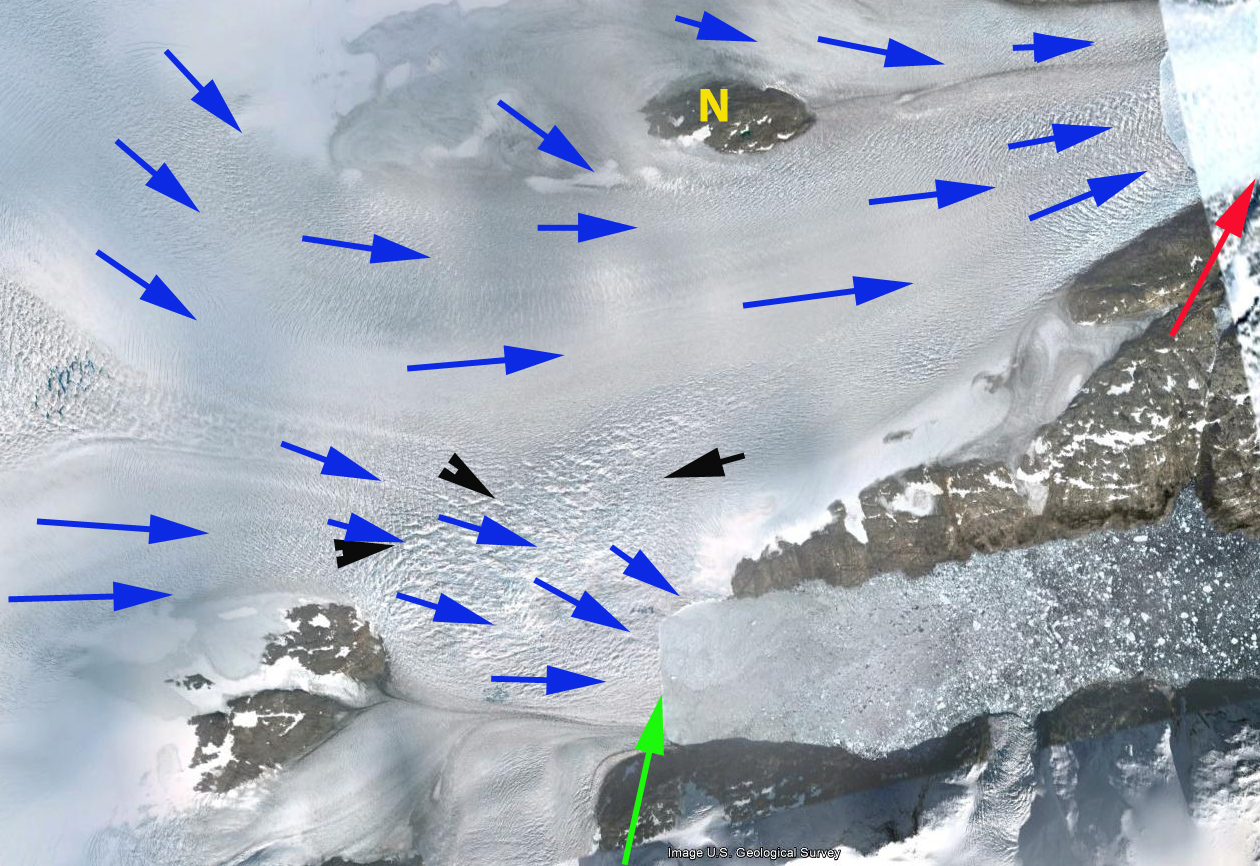
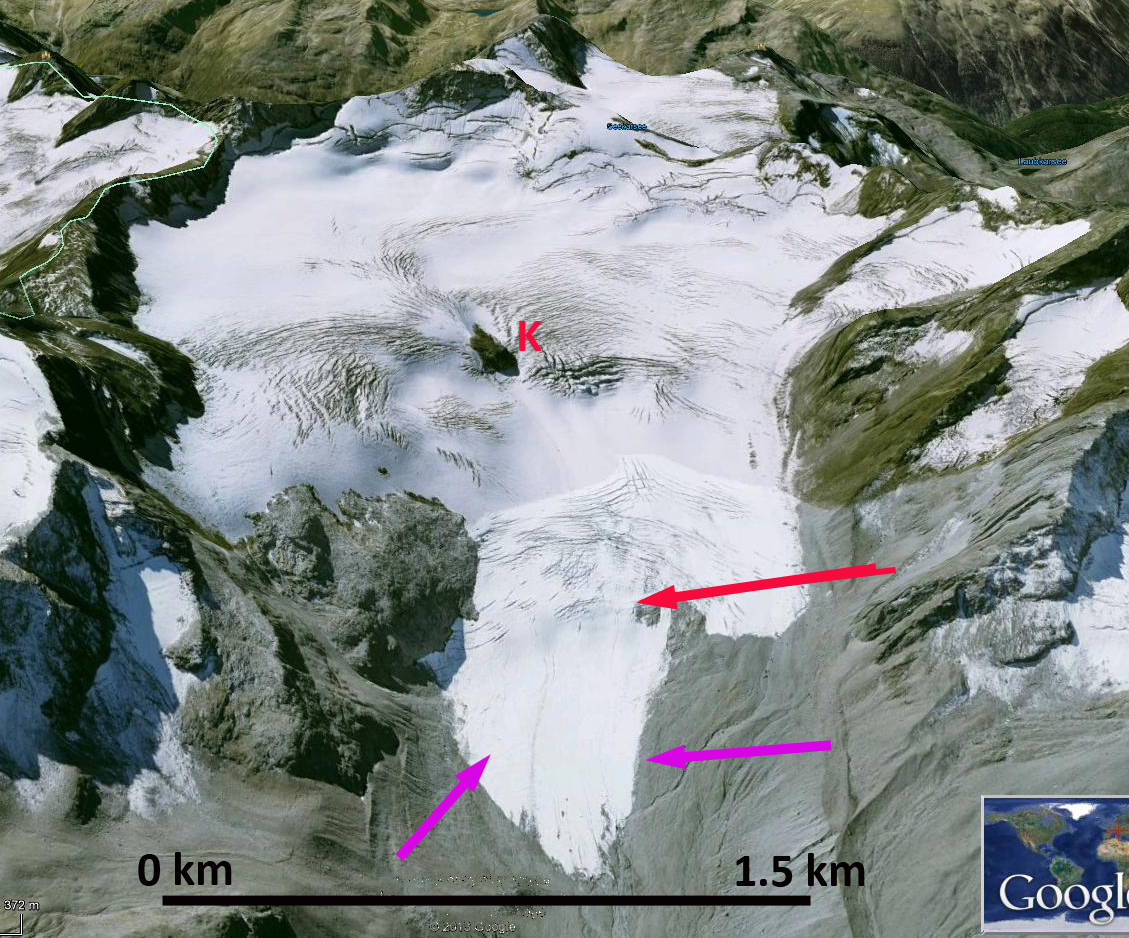
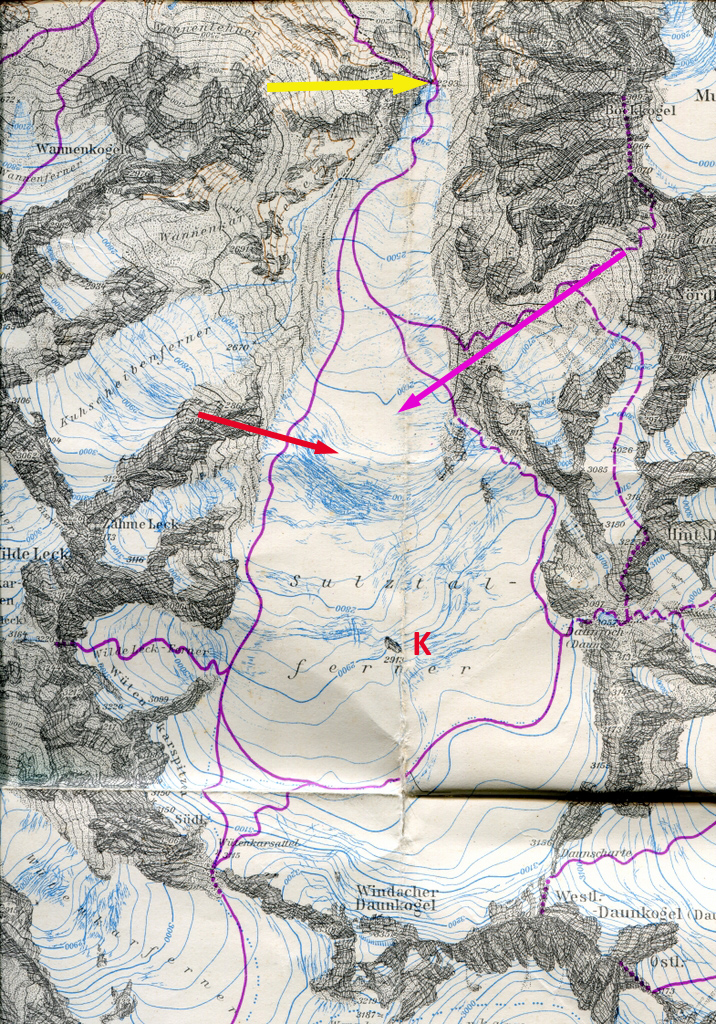
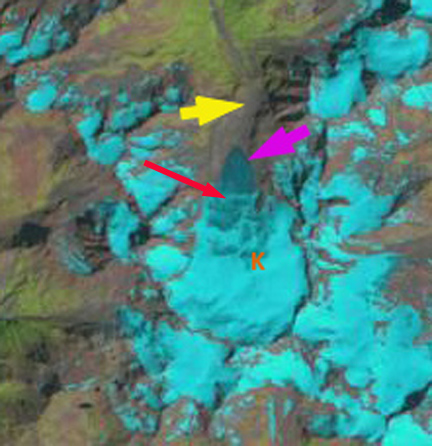
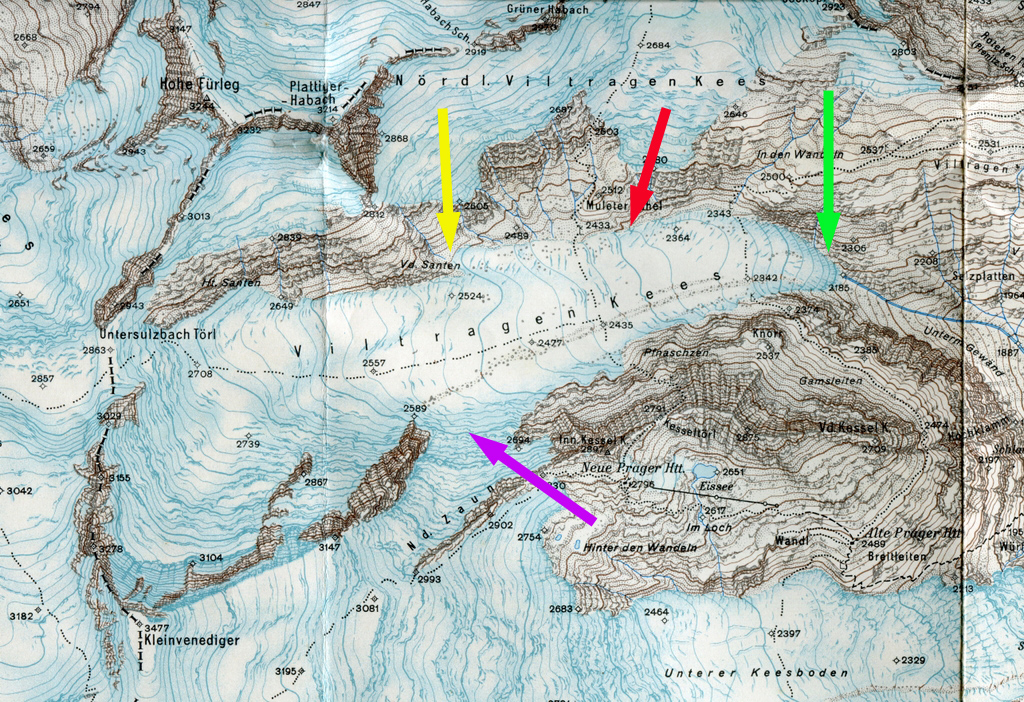
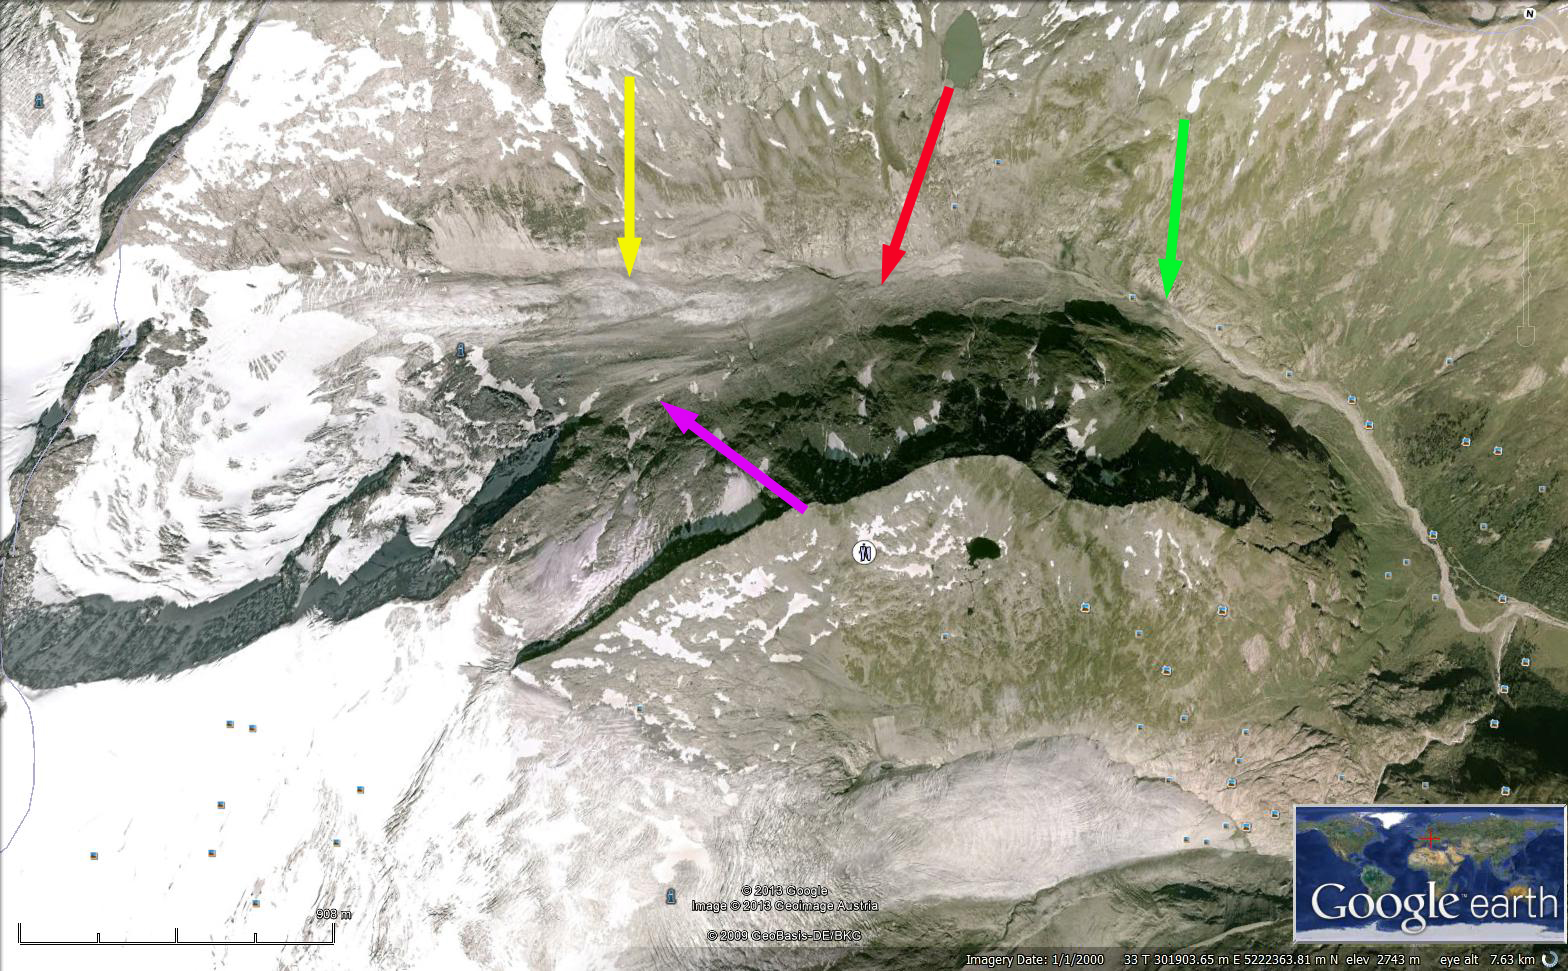
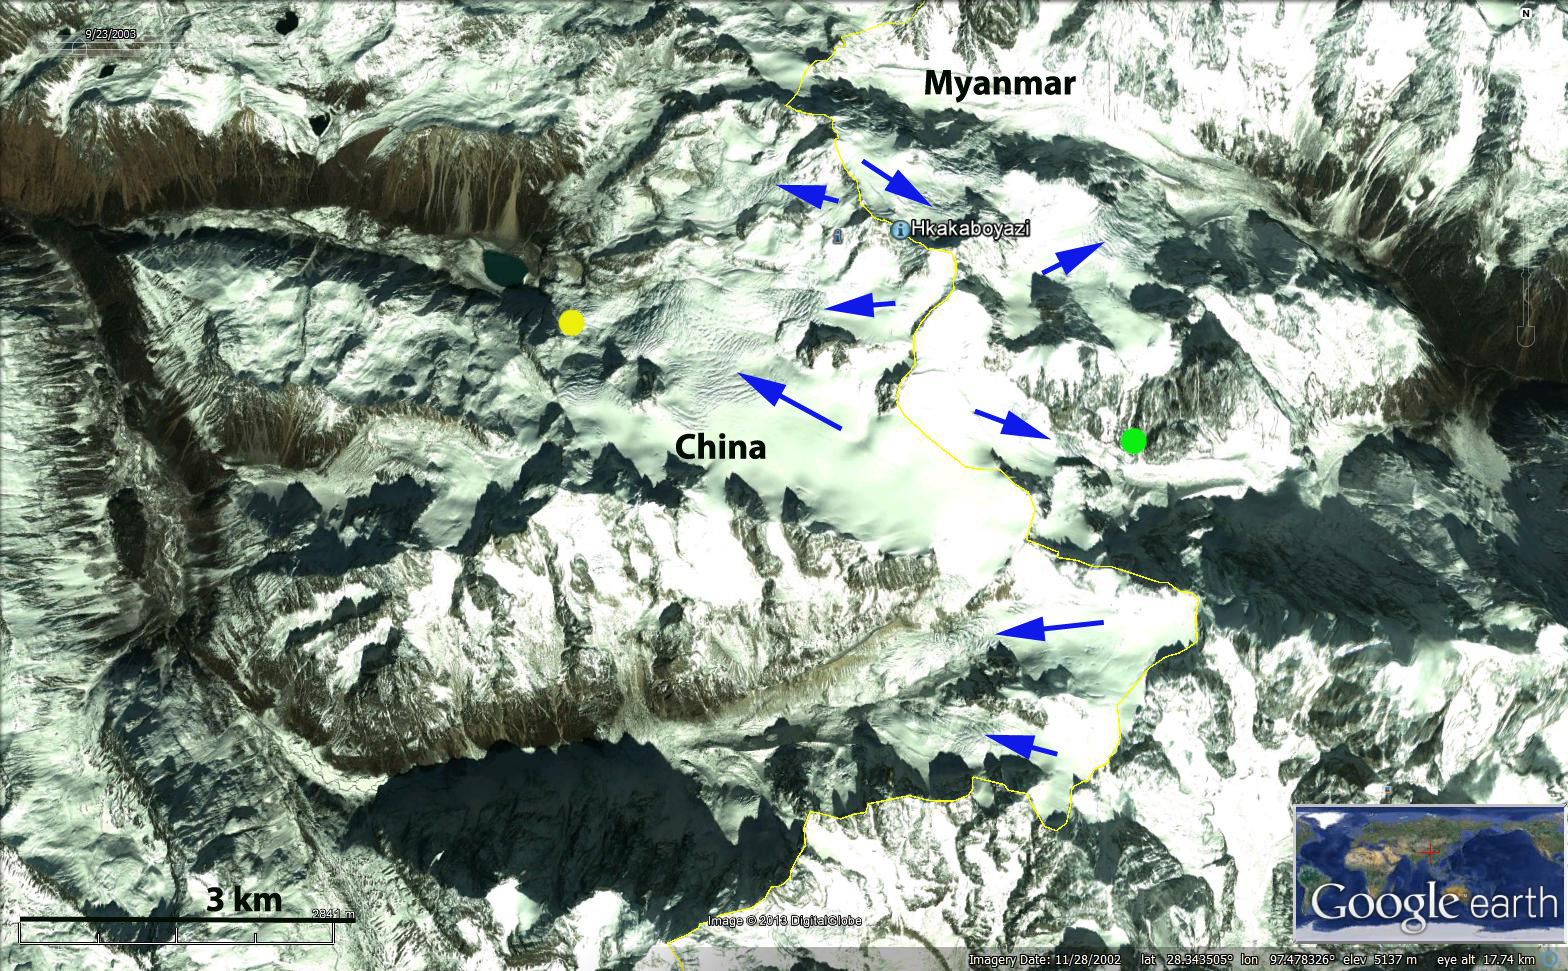 Here we examine the changes in several glaciers using Landsat imagery from 1987, 1996 and 2009. The red arrows indicate several locations in each image where in 1987 and 1996 sections of a each glacier coalesce. By 2009 in each of the red arrow locations the sections of the glacier have separated. The change in terminus position of three glaciers is also noted, the yellow dot indicates the terminus of the main west flowing glacier. The retreat from 1996 to 2009 is 250 m. The green dot indicates a location at the terminus of an east side glacier. In 1996 the terminus is at the down slope side of the dot and in 2009 the terminus barely reaches the up slope side of the green dot a retreat of 200 m. The pink arrow indicates the terminus of a steep east side glacier. In 1996 the glacier ended at a prominent cleft in the rock, pink arrow and by 2009 had retreated 200 m from this feature. These glaciers have behaved in a similar fashion to Hailuogou Glacier and the glaciers at the headwater of the Bode Zangbo.