The Emend River drains from the Hindu Kush Mountains and joins the Worsaj River and eventually drains into the Amu Darya River. This area is not impacted much by the summer monsoon and glacier runoff is key to summer streamflow. The runoff from the glacier is tapped for extensive irrigation in the valley bottom both along the Emend, and eventually downstream near Taliquan (bottom image).
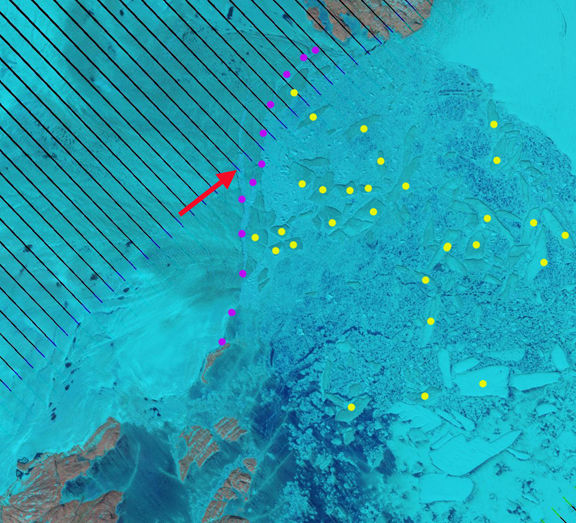
 At the headwaters of the Emend River, Takhar Province, Afghanistan are a pair of 3 kilometer long glaciers that are the focus of this post. We examine Landsat images from 2000 and 2011 and a Google Earth image from 2004. In 2000 the western glacier ends in a proglacial lake indicated by the purple arrow in each image. By 2007 the glacier has receded 50 meters from the edge of this lake, and by 2011 the glacier has receded 100+ m from the lake. On the eastern glacier in 2000 a small proglacial lake less than 0.1 square kilometer is at the end of the lake, yellow arrow. In the 2007 Google Earth image the lake has expanded as the glacier has retreated and has an area of 0.25 square kilometers. A small additional expansion has occurred by 2011, with the lake area reaching 0.3 square kilometers. Another glacier to the south also in the Emend River watershed has also experienced lake expansion at its terminus, red arrow. This latter lake has expanded from less than 0.1 square kilometers to 0.3 square kilometers in the last decade. These are all small lakes and do not pose a glacier lake outburst flood hazard.
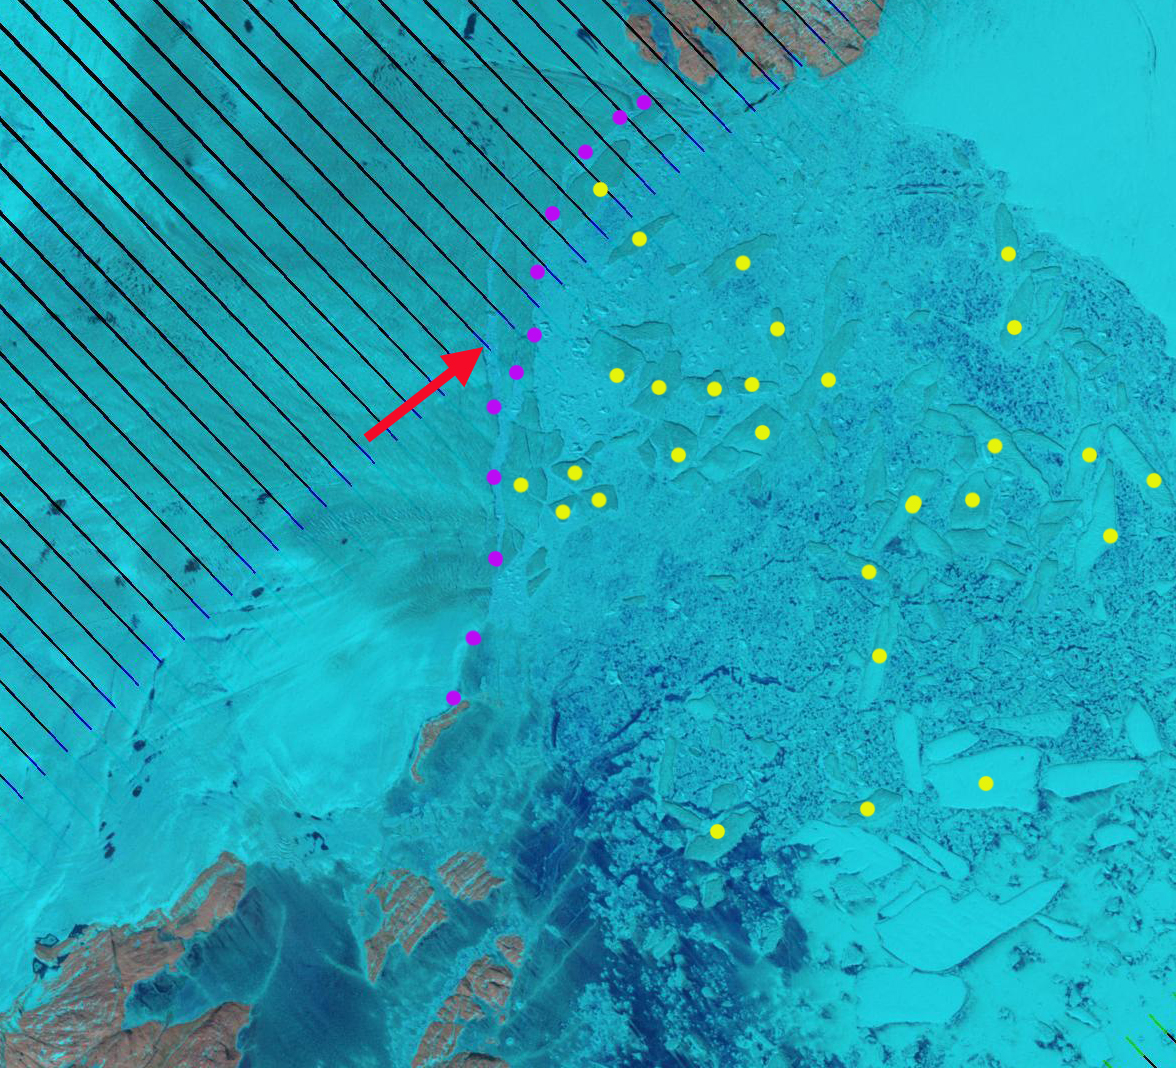
 <
<

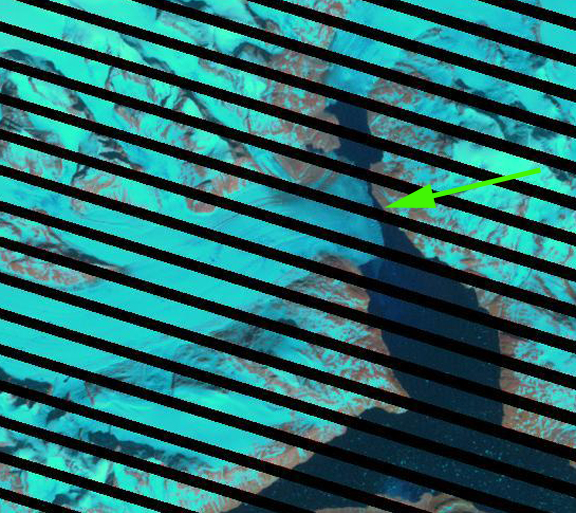
A closeup view of the terminus area indicates numerous depressions, green arrows. The depressions are ablation hollows, where more dust has accumulated, and then accentuated ablation, the hollows typically form from wind scouring. The hollows are not water filled, Petrov Glacier also featured similar features. This region of the Hindu Kush has not been the focus of detailed glacier studies. Northeast of Takhar Province in the Wakhan Corridor a group of glaciers was examined by Umesh Haritashya and others (2009) and found 28 of thirty had retreated. Zemestan Glacier is one example. The Hindu Kush follows the pattern of the high mountains of central Asia including the Himalaya.