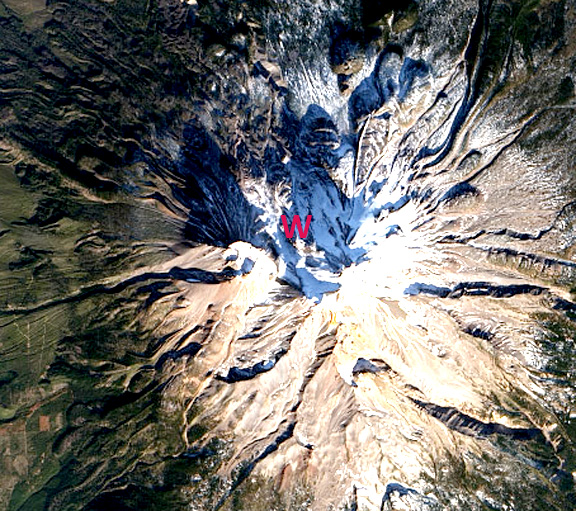
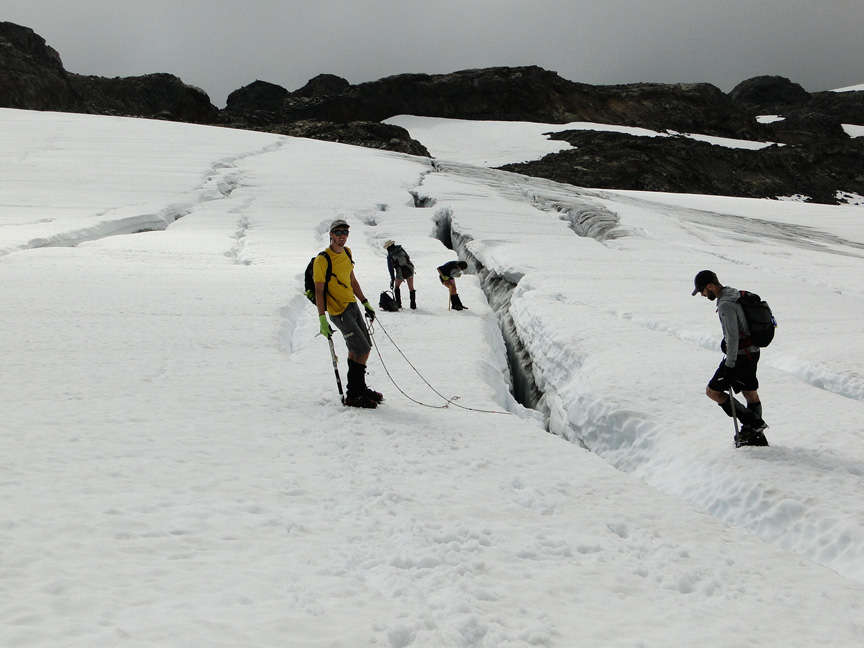
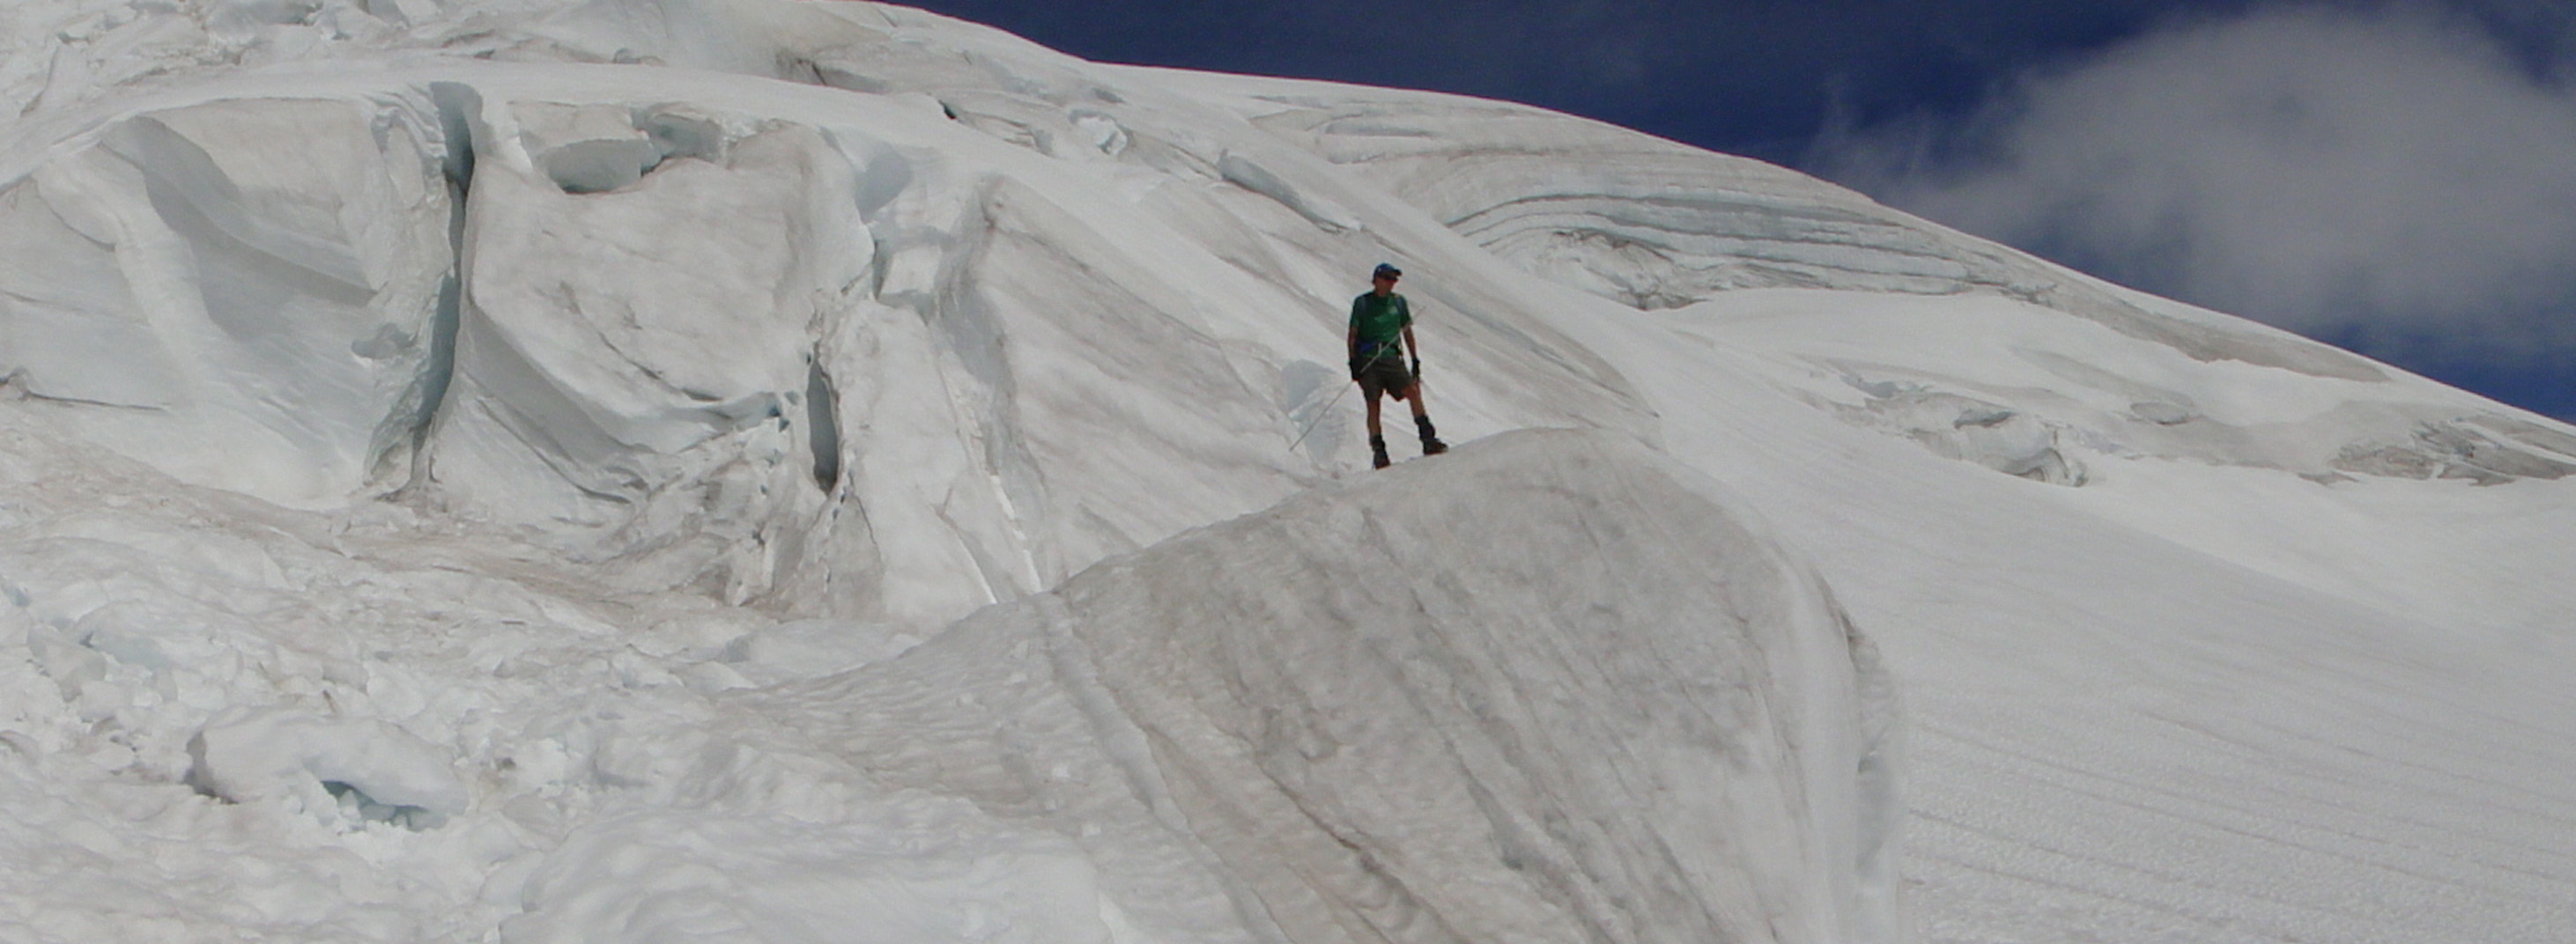
The 2014 Glacier Field season was our 31st consecutive year working on North Cascade glaciers. After a late winter surge of snowfall, the North Cascades had a slightly above average snowpack as the melt season began in early May. The warm, dry summer to date, could end up being the warmest for the region, currently 2013 was the warmest melt season. The result is glacier melt has been high overall. In the field we measured the mass balance, terminus position, surface elevation and runoff from North Cascade glaciers. This includes assessment of annual retained snow layer thickness in crevasses and overall crevasse depth.
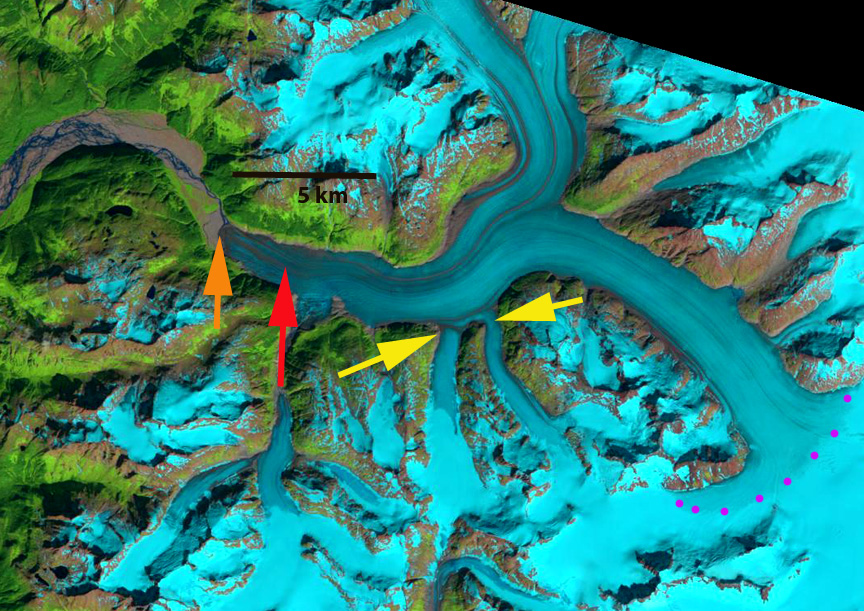
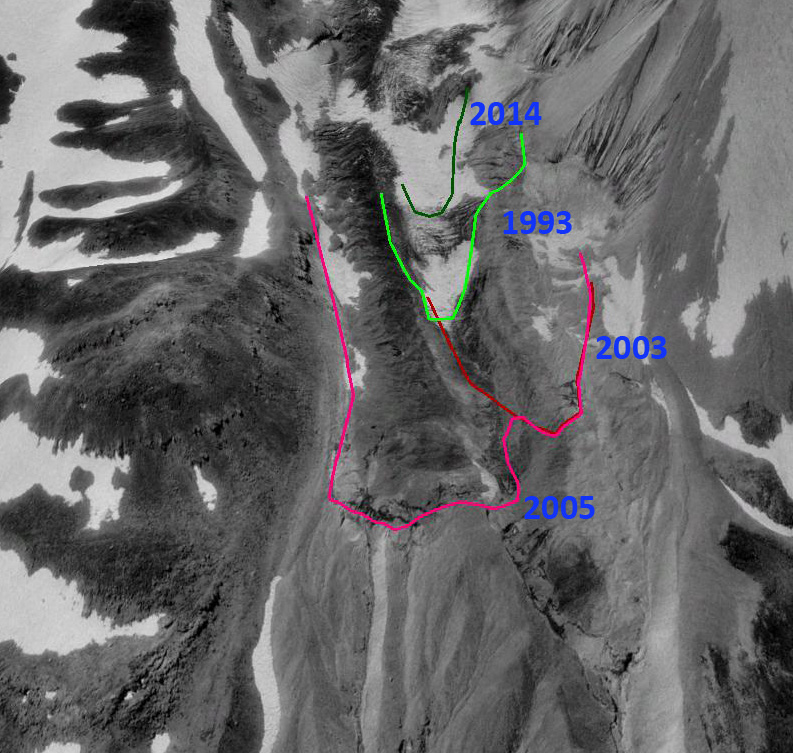
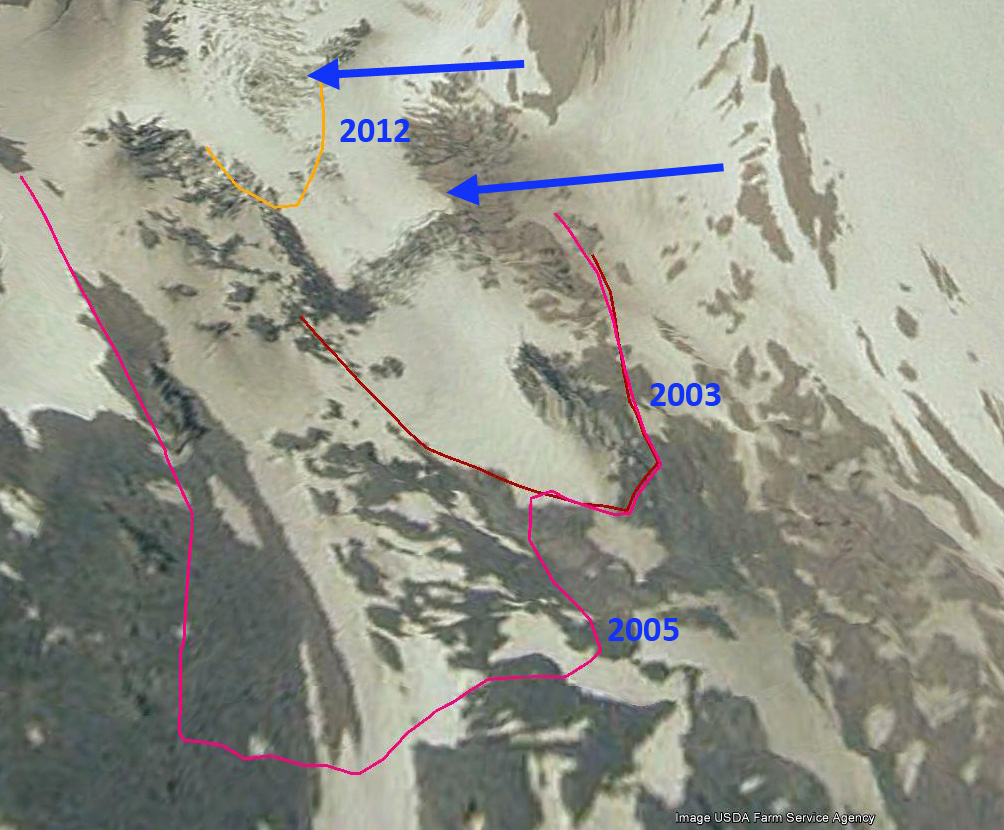
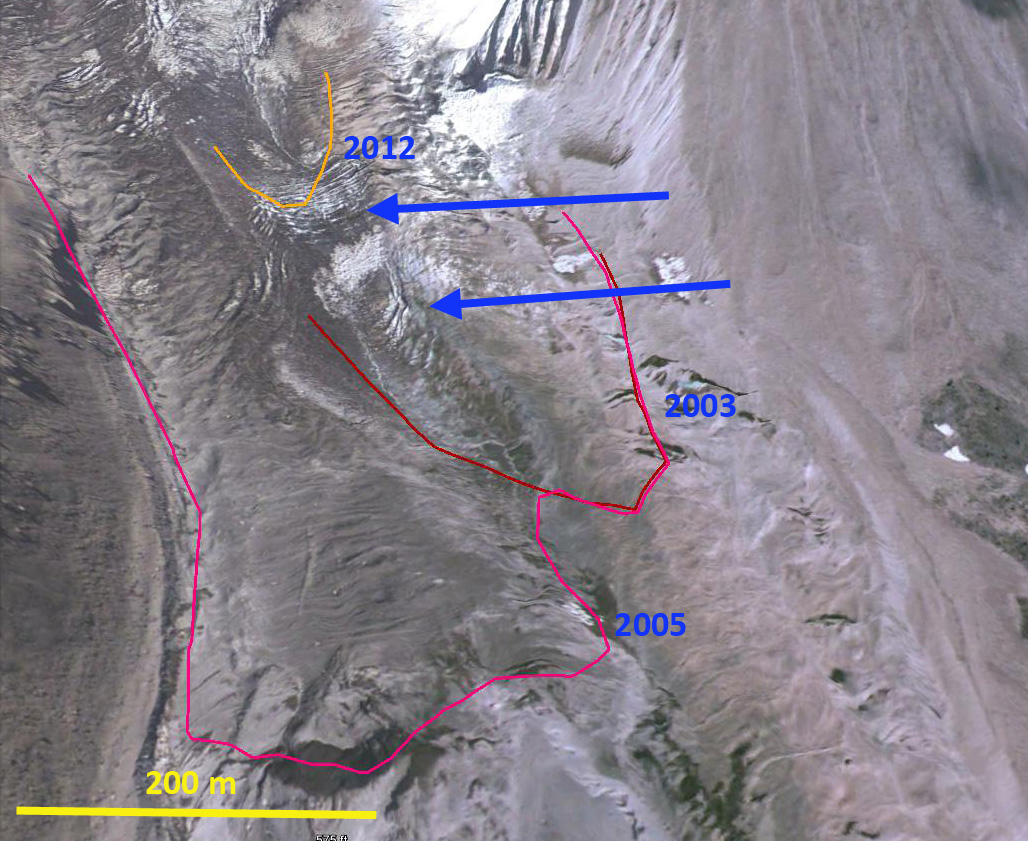
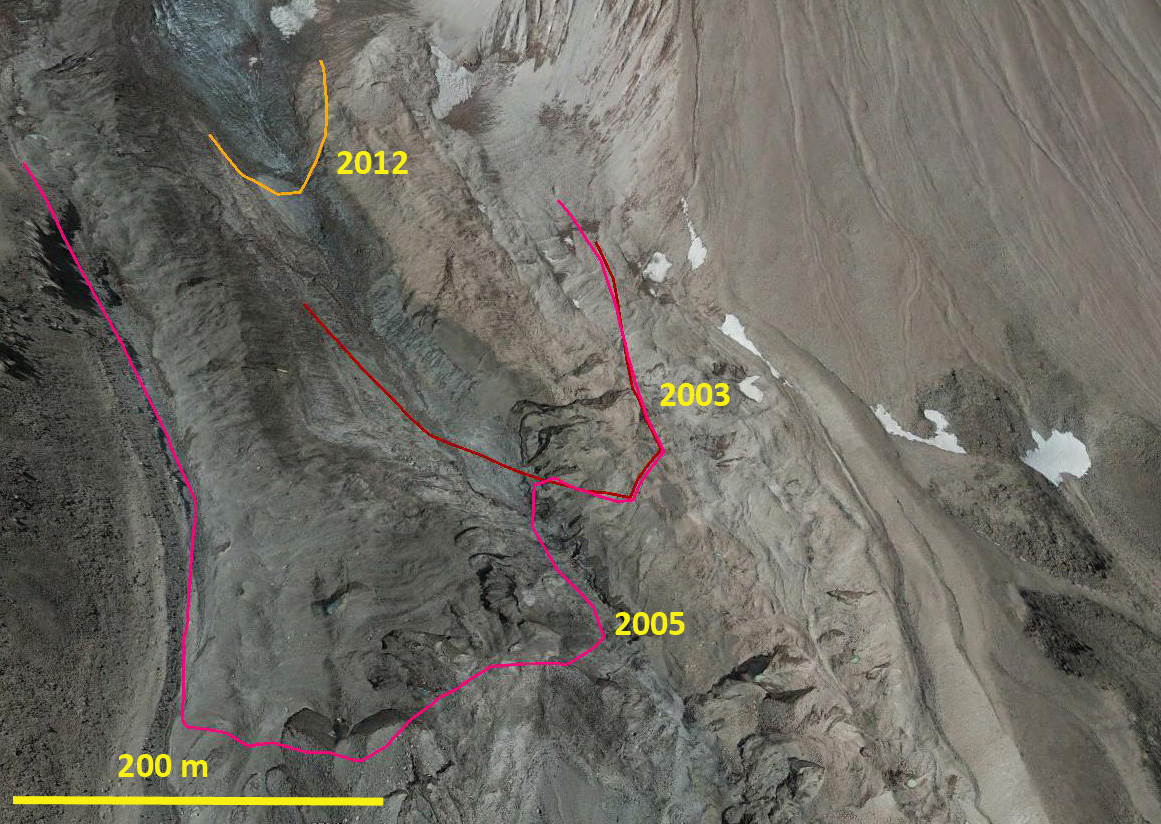
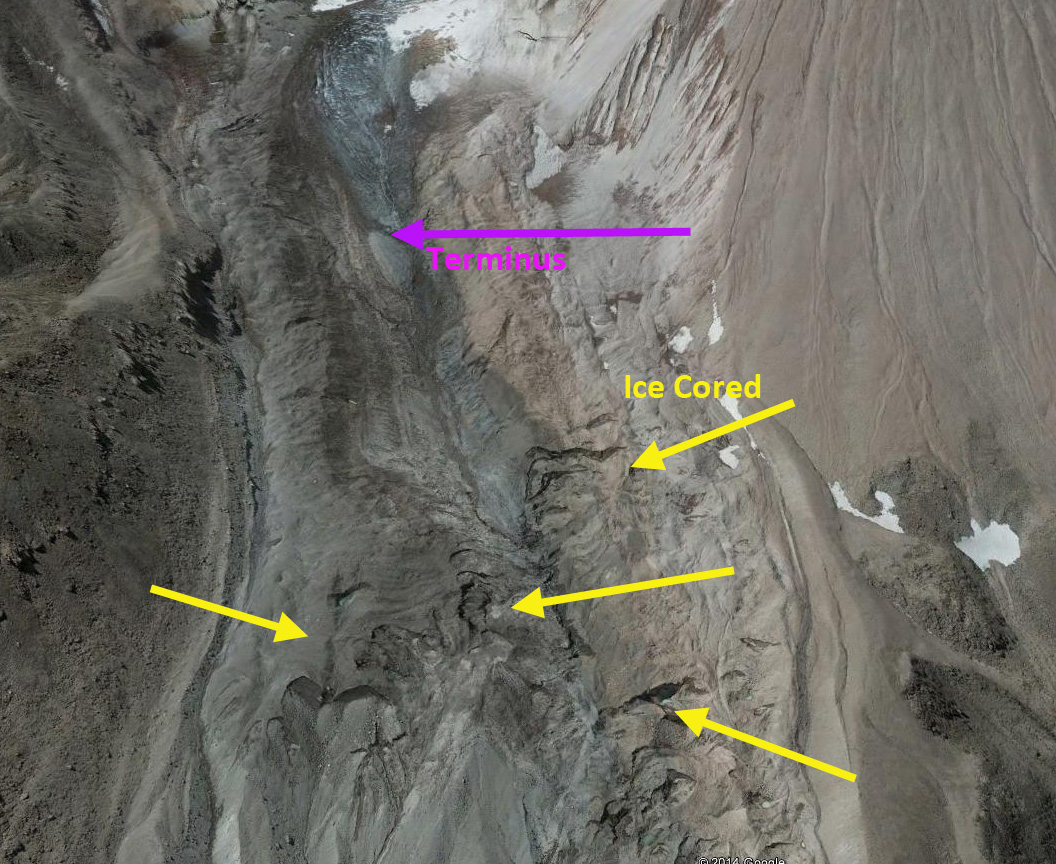
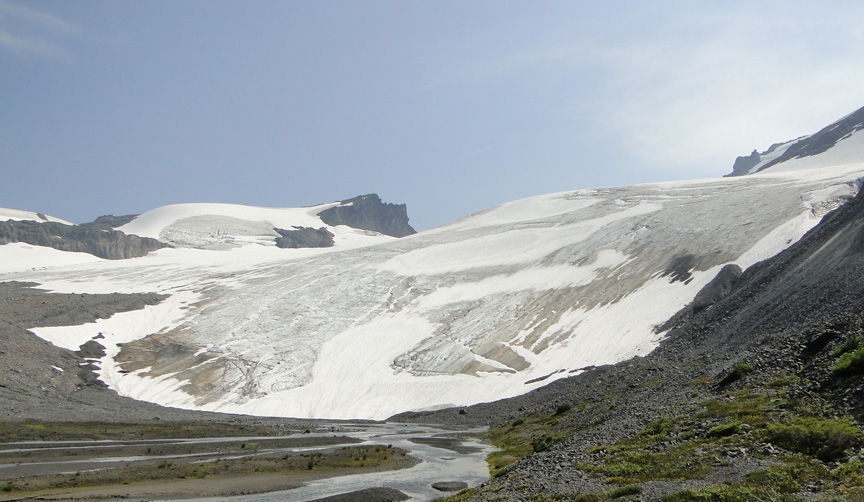
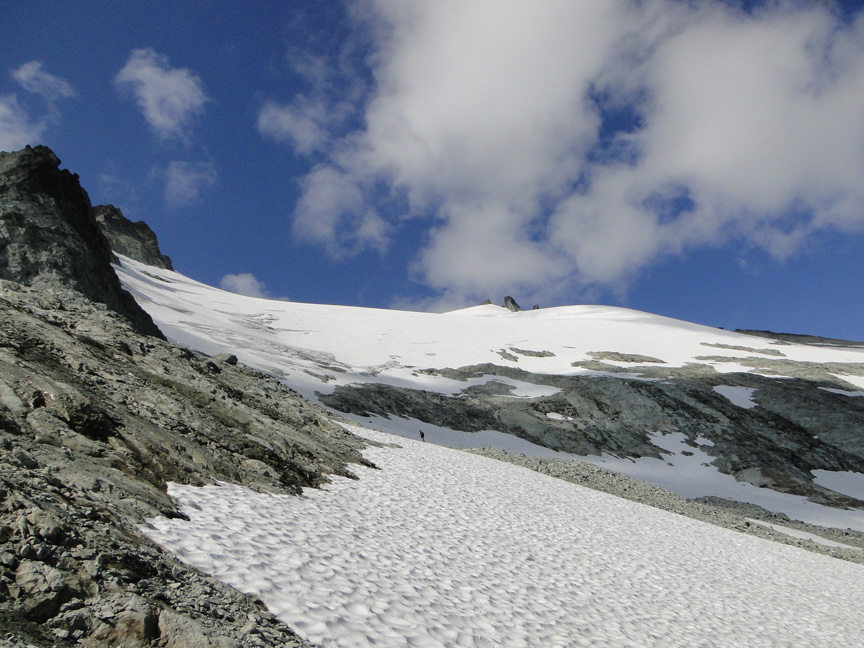
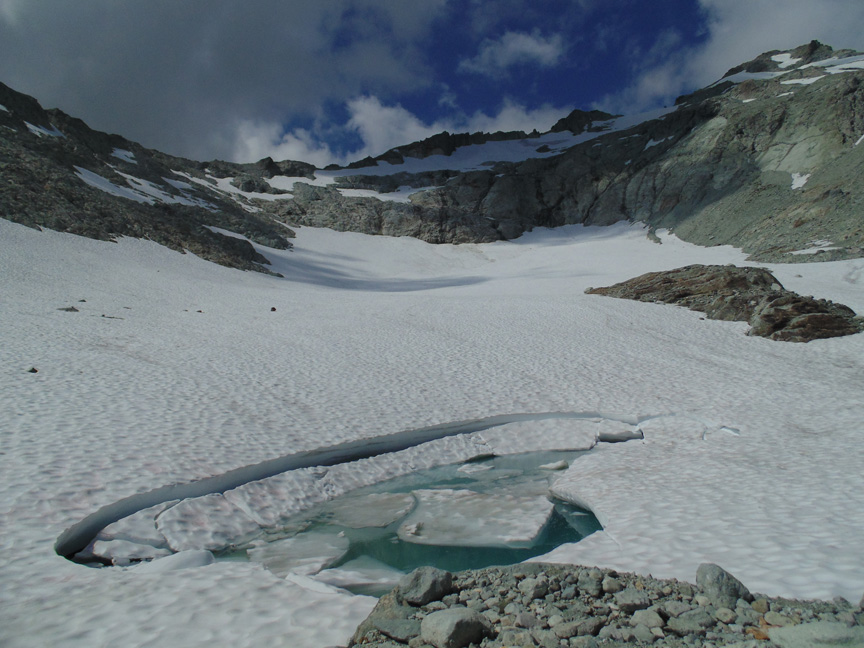
We first examined the Easton Glacier on the south side of Mount Baker, which has now retreated 370 m since 1990. The glacier has retreated 55 m in the last two years. The most interesting change is that the western toe of the glacier has receded beyond its normal drainage channel, and there is no outlet stream from the west side of the glacier. Snowpack below 2100 m was much below normal including on the bench at 1900 m below the main icefall. Above this main icefall snowpack was closer to normal. Snowpack average 4.5 m at 2500 m, assessed in numerous crevasses. The ongoing warm conditions will continue to reduce the snowpack more than the average summer. With typical late summer conditions mass balance will be -1.1 m on Easton Glacier. The Deming Glacier debris cover has now spread across the entire terminus, retreat from 1985 to 2014 is 480 m. The snowline was at 2075 m in early August in the main icefall, which is 100 m higher than normal.

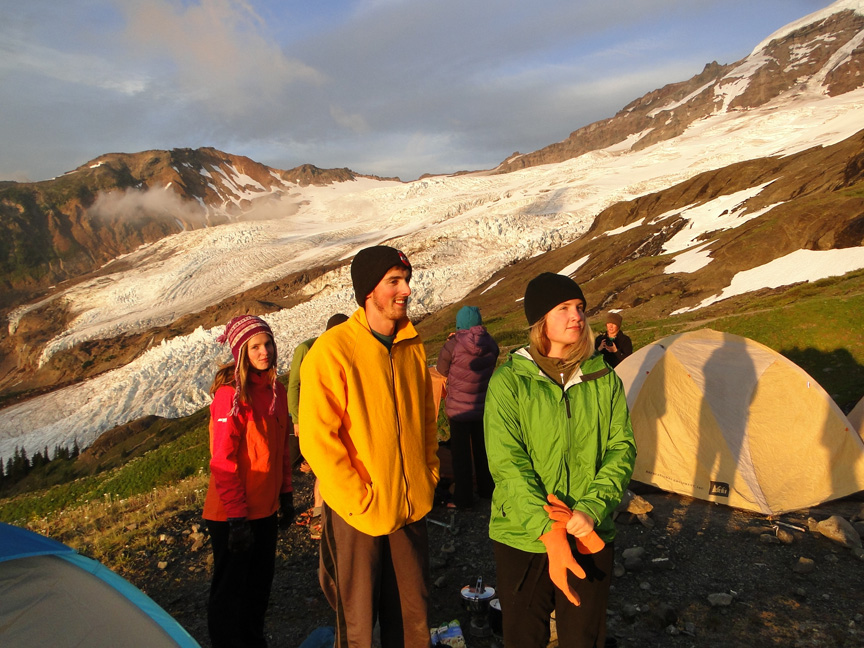
Breakfast at camp below Easton Glacier

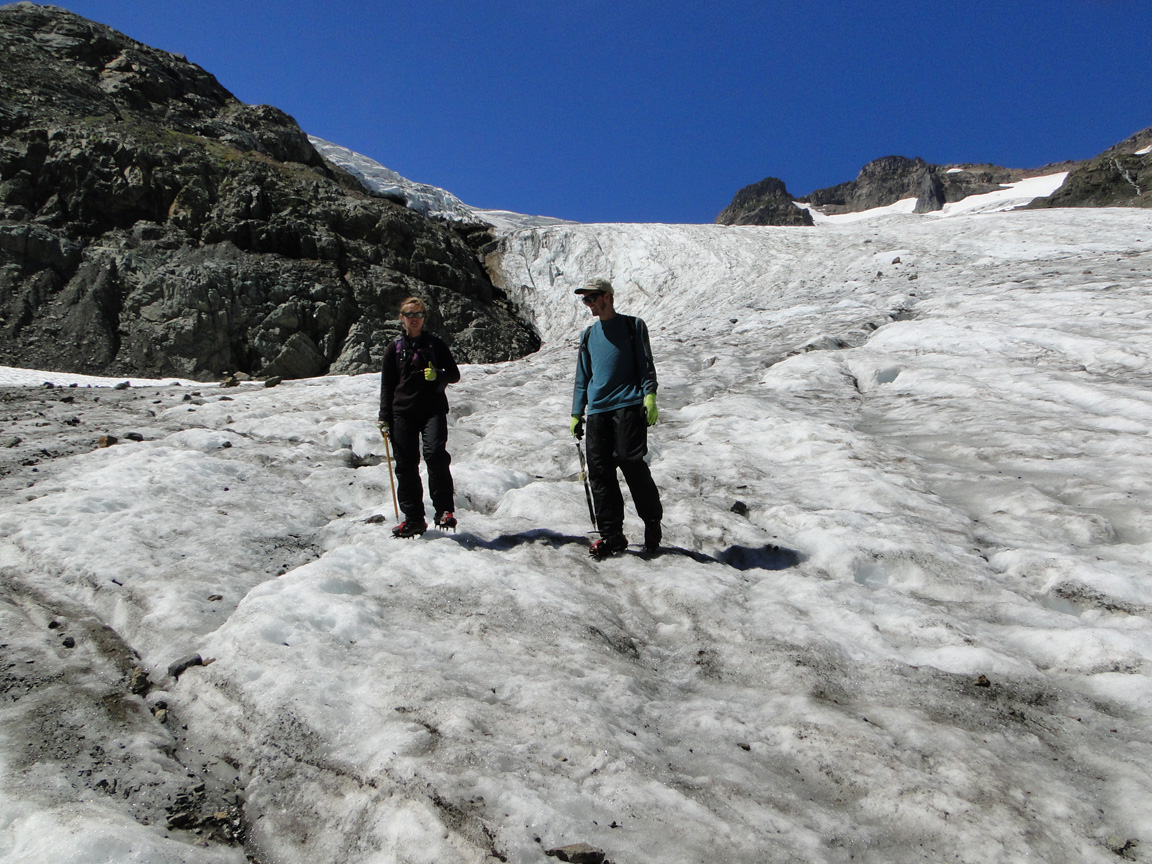
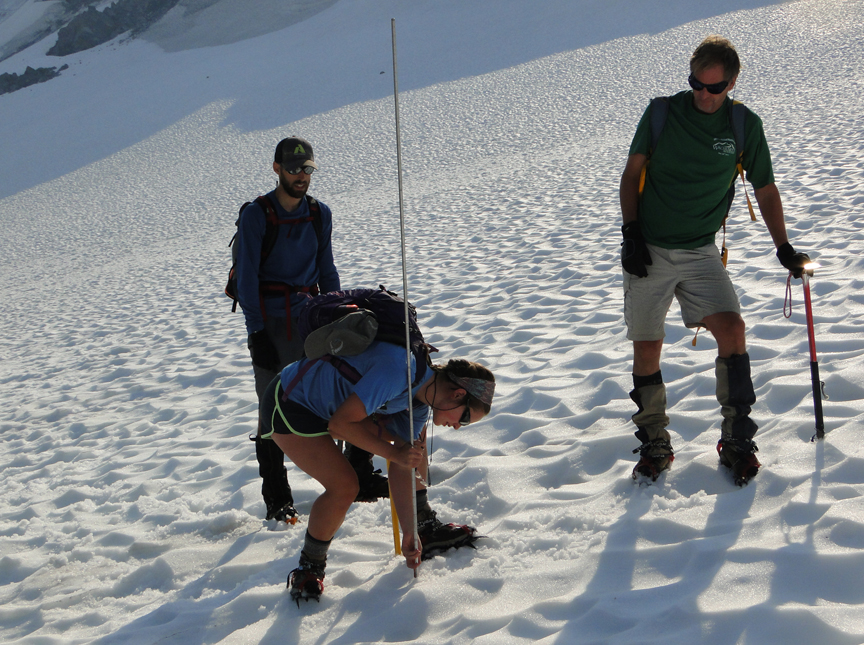
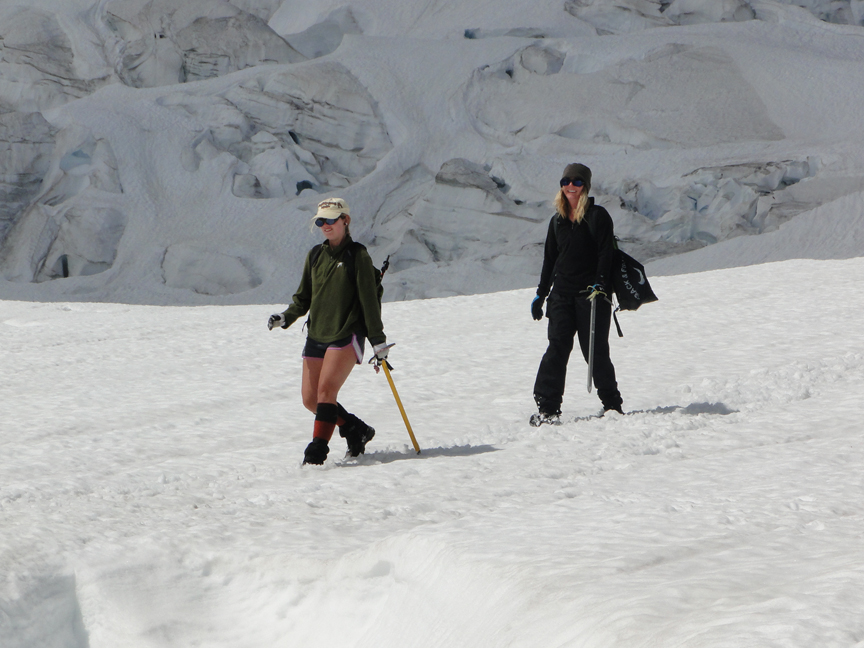
Jill Pelto assessing the depth of crevasses on Easton Glacier, her sixth year working on glaciers.

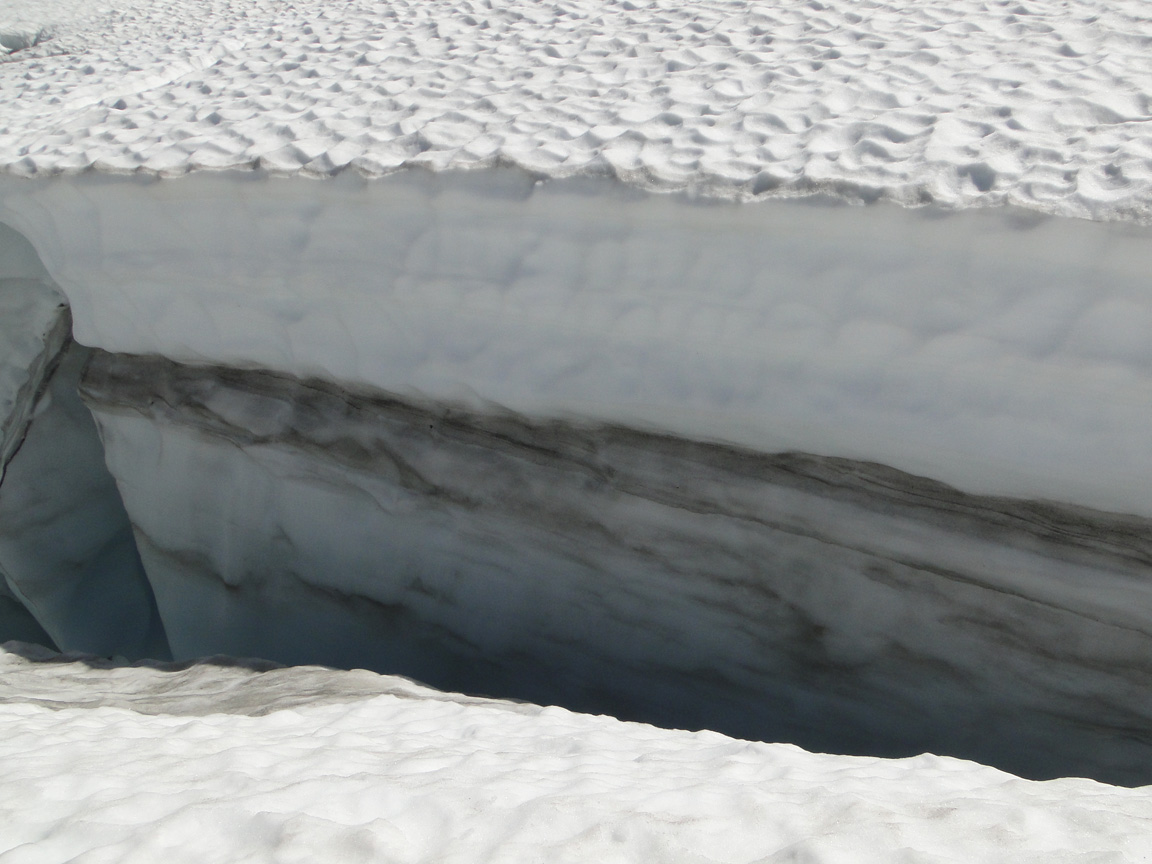
Determination of annual retained snowpack depth using crevasse stratigraphy.

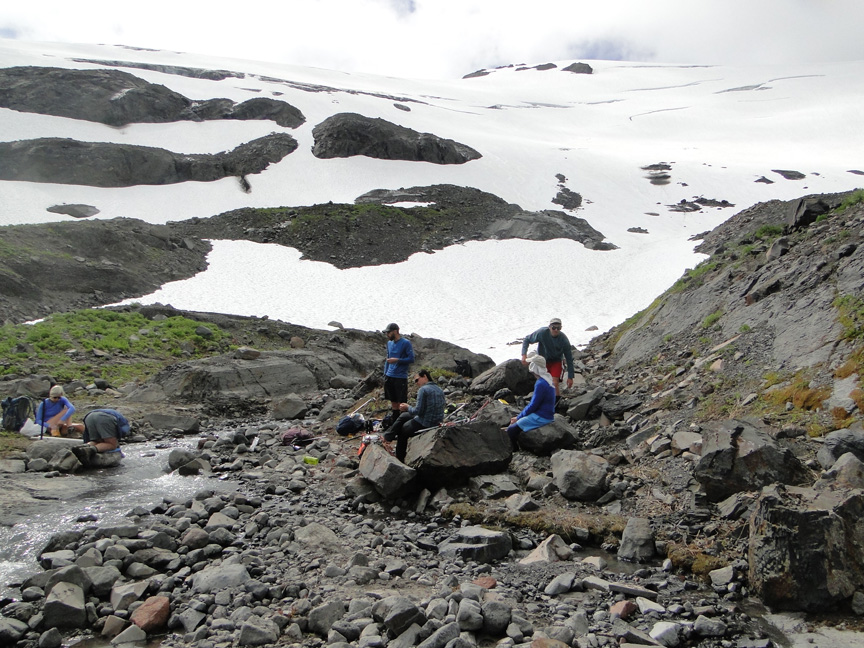
More snowpack assessment by Ben Pelto and Justin Wright.

Ashley Edwards descending Easton Glacier lower icefall
 Melanie Gajewski visually examining the Easton Glacier profile.

Mauri Pelto on a serac in Easton Glacier icefall, 31st year working on these glaciers.
The next stop was Helitrope Glacier on the north side of Mount Baker, where we installed of a stream gage below the Heliotrope Glacier. Oliver Grah and Jezra Beaulieu of the Nooksack Indian Tribe installed the gage while we calibrated runoff and assessed the amount of snowcover on the Heliotrope Glacier, the western extension of the Coleman Glacier, and installed ablation stakes. The rise in the snowline over the rest of the summer will identify the ablation of snowcover. The maximum snowpack on Heliotrope Glacier was less than 3.5 m, which means almost the entire glacier will lose snowpack by the end of September up to the ridge above it. The daily runoff from the Roosevelt-Coleman-Heliotrope system during our observations was an impressive 14 million cubic feet per day.The snowline was quite high on Roosevelt Glacier and Coleman Glacier at 2000 m in mid-August. The retreat of Roosevelt in particular is impressive since my first visit in 1985, a retreat has been 450 m over this interval.

Camp at Heliotrope Glacier.
 Justin Wright on the Coleman Glacier

Oliver Grah installing stream gage below Heliotrope Glacier. Jill Pelto probing snowpack.
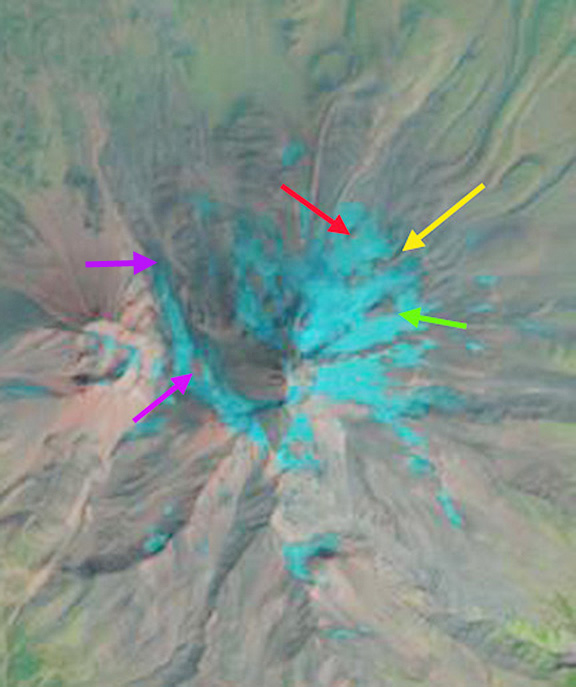
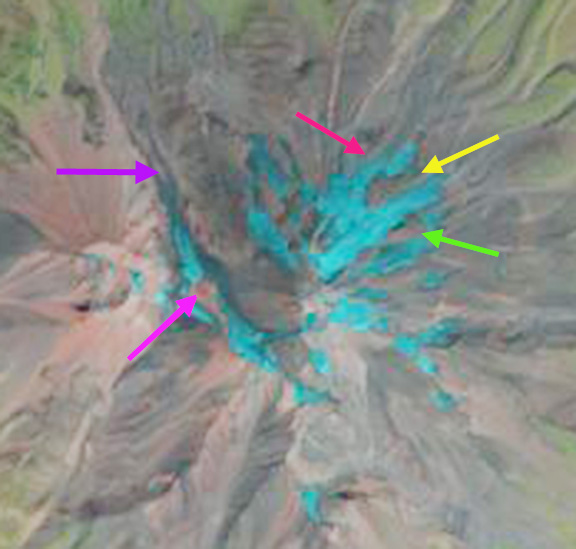
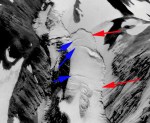
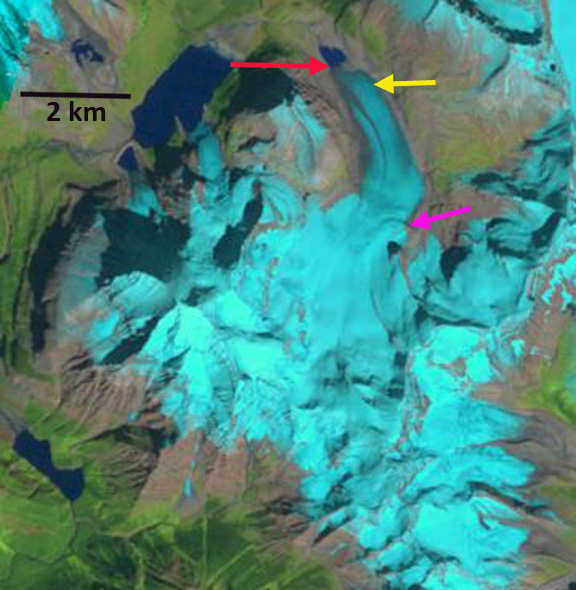
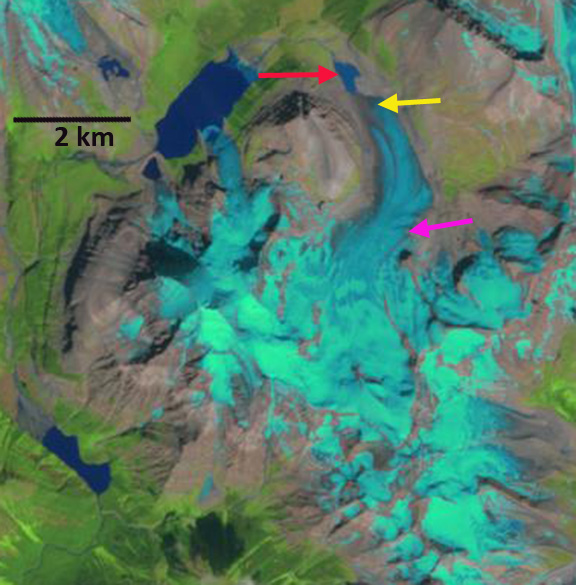
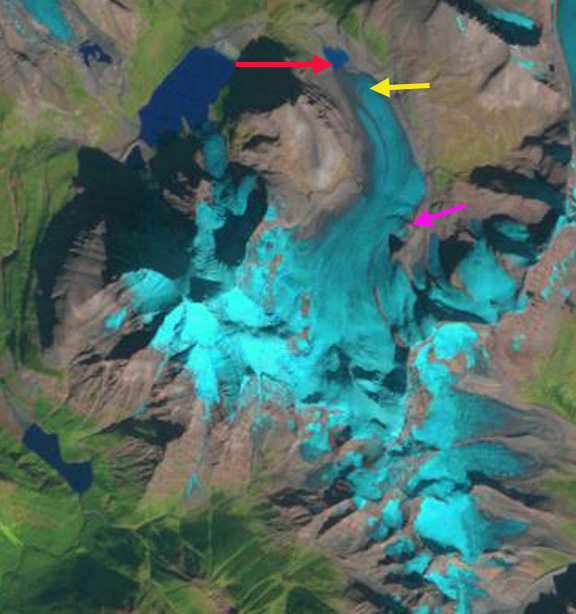
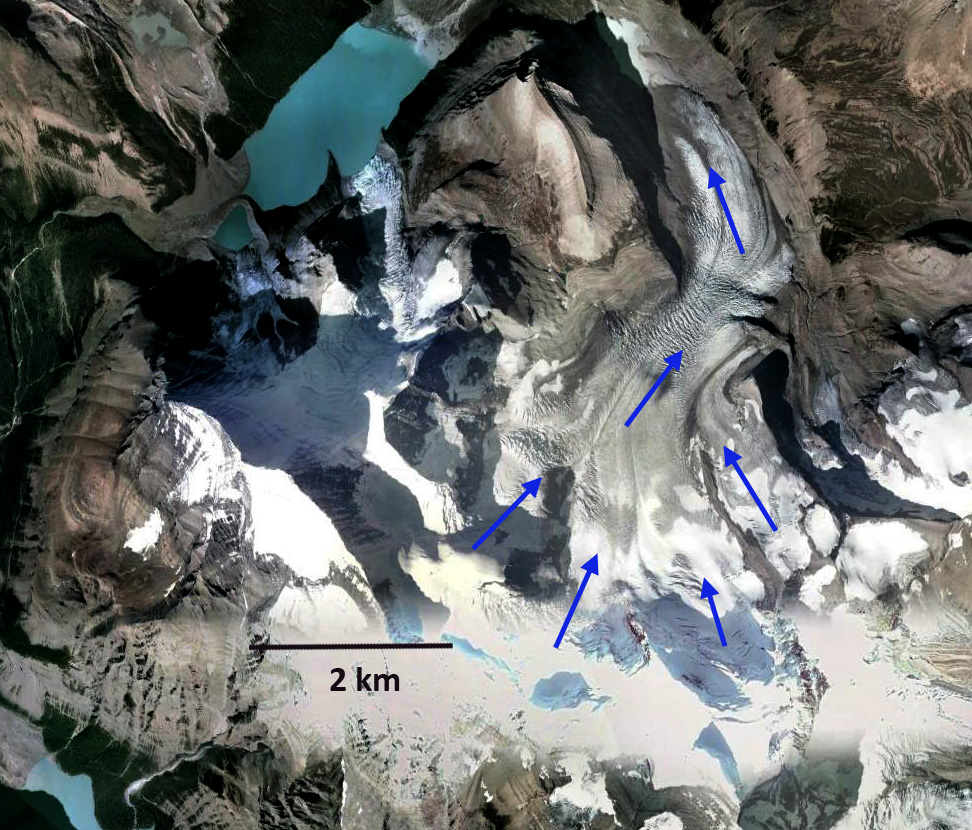
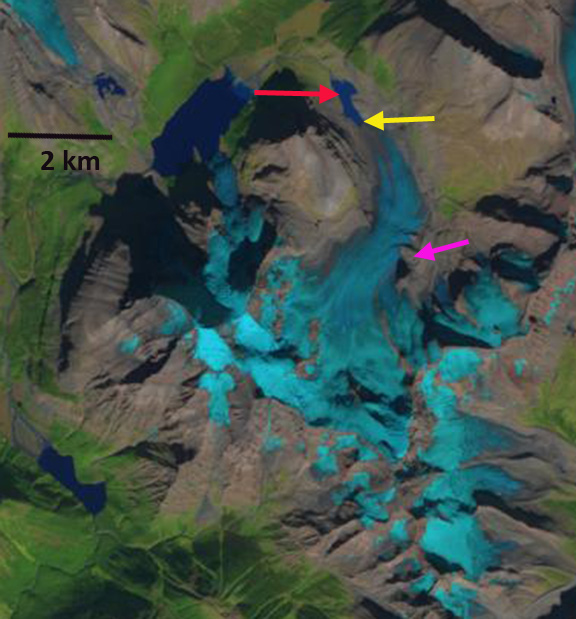
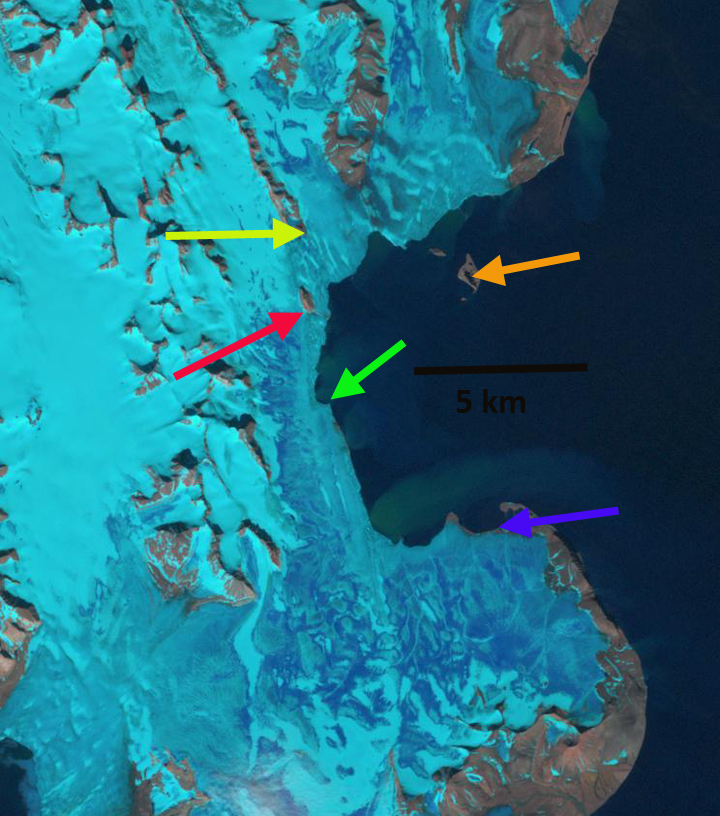
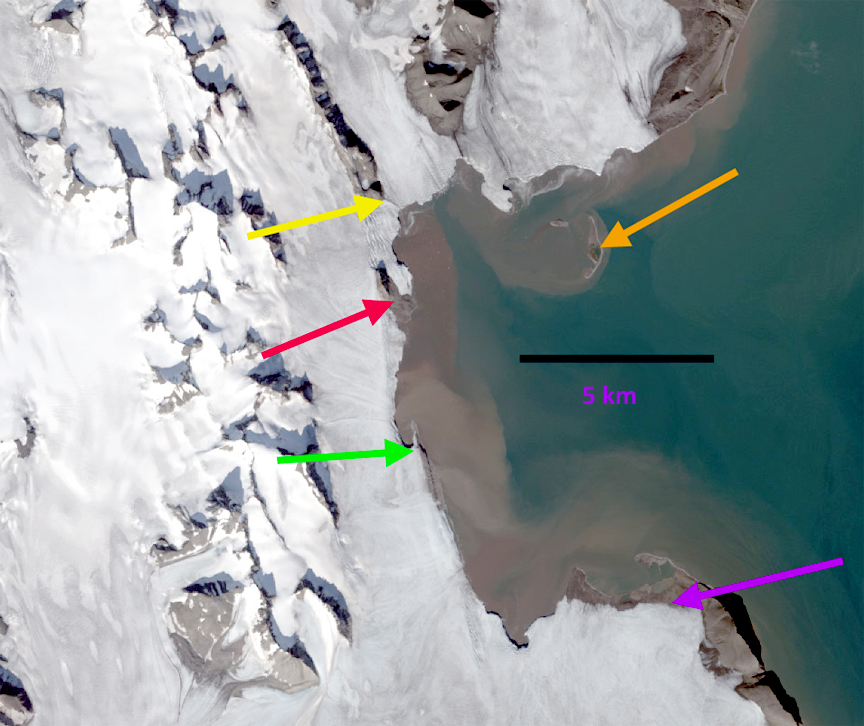
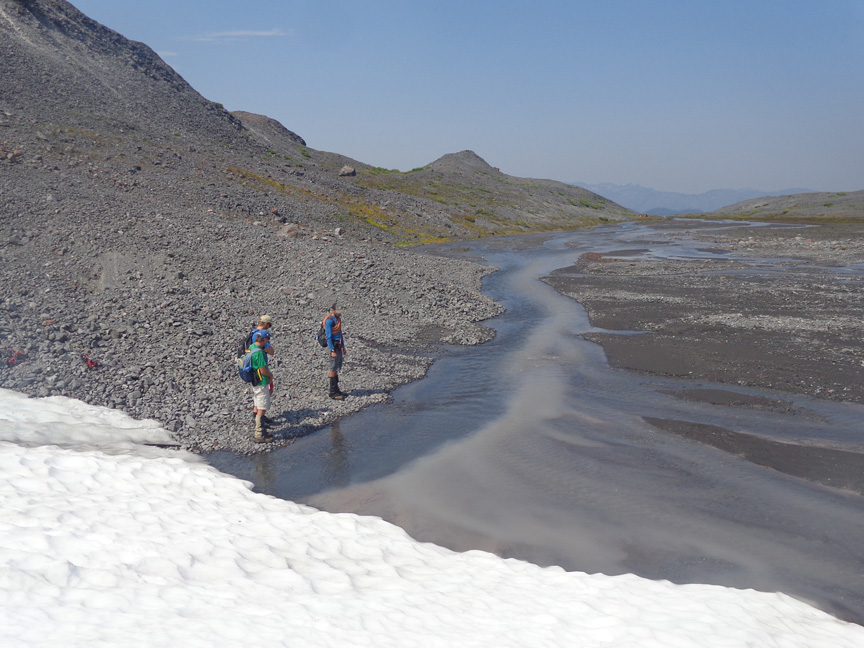
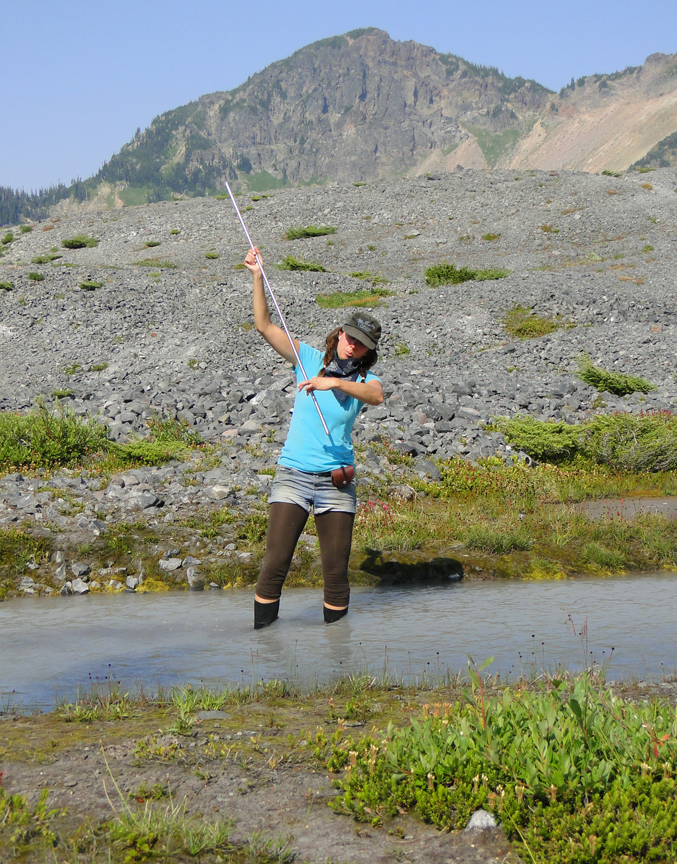
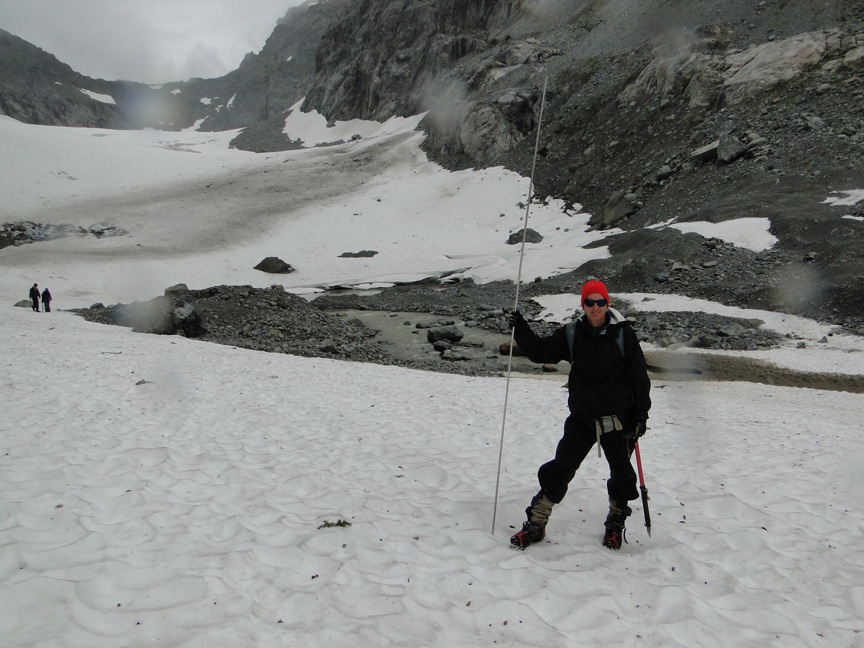
Continued warm dry weather led to records numbers of hikers at Artists Point as we headed out Ptarmigan Ridge on the northeast side of Mount Baker to work on Rainbow Glacier and Sholes Glacier. During our first day the east wind pushed forest fire smoke into the area eliminating views. We surveyed the mountain goat herds as usual seeing three herds and a total of more than 60 different goats. With the high temperatures and forest fire haze the number of iceworms emerging at sunset during our population count was also an all time low. Rainbow Glacier had snowpack that was 1.25 m below normal. With typical late summer conditions mass balance will be -1.5 m on Rainbow Glacier. Sholes Glacier already had 15% blue ice exposed, on August 7th. This had expanded to 25% by August 12th. This rapidly expanded to 50% by August 23rd, note Landsat comparison below. It will be 60% by the end of August and then likely close to 80% loss by the end of the summer. With typical late summer conditions mass balance will be -1.6 m on Sholes Glacier. Remember glaciers in this area need 60% snowcover at the end of the melt season to balance their frozen checkbook. On Sholes Glacier we completed 118 measurements of 2014 snowpack depth via probing in this relatively crevasse free glacier.
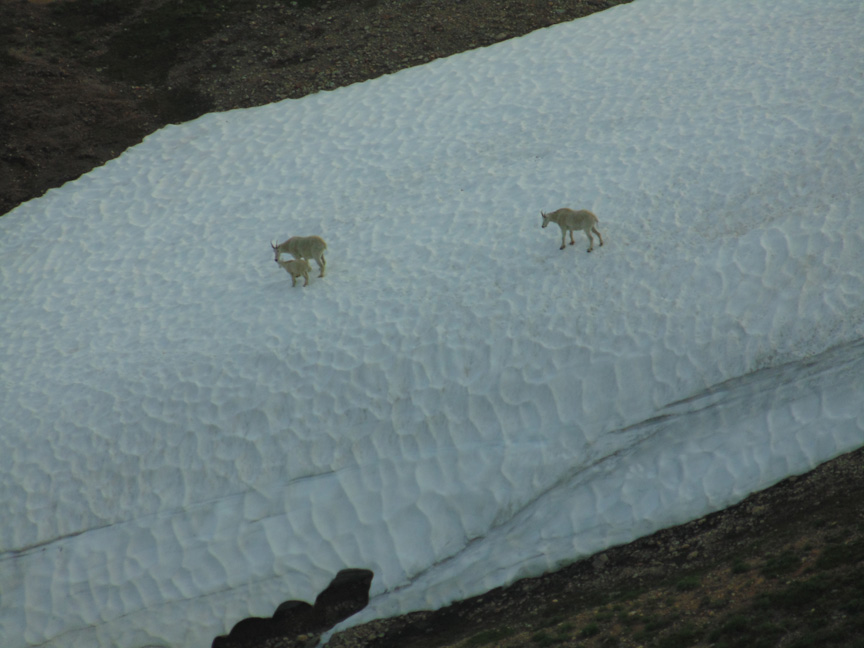
 A herd of 48 mountain goats.

Snowpack probing on Sholes Glacier.
 Looking at Sholes Glacier from outlet where stream gage is installed.

Sholes Glacier outlet with the clearer surface melt runoff versus the turbid basal meltwater stream.
 Ashley Edwards measuring streamflow.

Landsat 8 iamges from 8/7/2014 and 8/23/2014-red line is boundary of bare blue glacier ice where the 2014 snowpack has been lost.
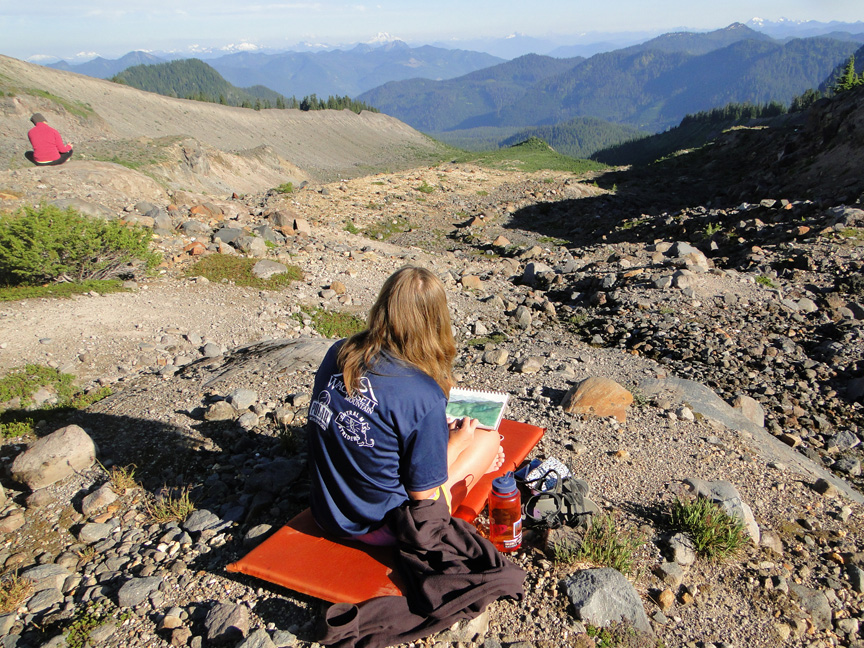
 Jill Pelto sketching in camp.
 Megan Pelto sketching in camp.
 Jill’s field sketch of glacier runoff with Penstemon in foreground.
 Megan’s field sketch of glacier input to rising sea level.
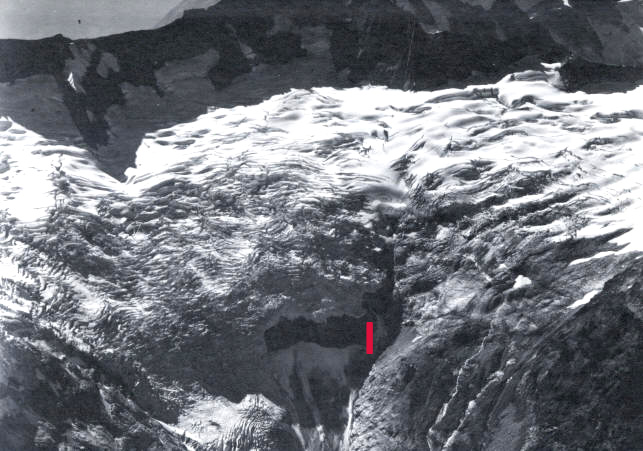
We then headed to Lower Curtis Glacier, on Shuksan where the rain gods had their turn. That night we had one of the top three heaviest rainstorms I have experienced during my 31 years and 600+ nights camping in the North Cascades. Totals by morning exceeded 4 inches. Rain continued lightly during the day, making for a foggy day on the glacier. The avalanche danger was too high due to the warm temperatures even with the rain to survey the terminus. The main basin of the glacier had limited areas with snowpack over 2.8 m, which is how much is needed in mid-August to survive to the end of the melt season. With typical late summer conditions mass balance will be -1.1 m on Lower Curtis Glacier
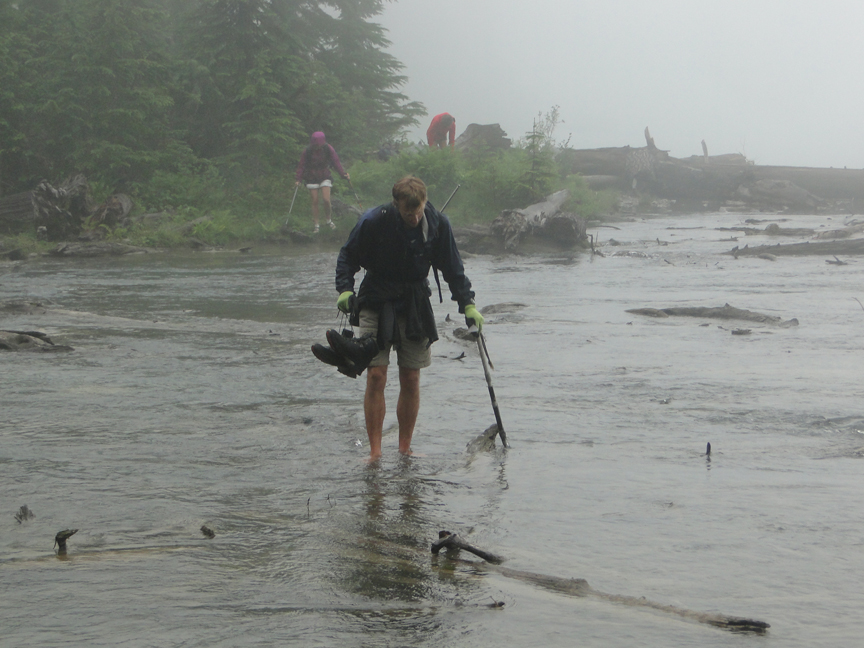
The forecast of a one day rain event was now extended to two more days. We hiked up to Blanca Lake in the rain, woke up in the rain, hiked to the glacier in the drizzle and completed our measurements. The rain returned during the hike around the lake to camp. Snowpack was low around the lake, on the trail in and seemingly everywhere but on the glacier. Strong avalanching made this the first glacier even close to average in its snowpack. Snowpack was low in the highest basin of the glacier that is not as heavily avalanche fed. With typical late summer conditions mass balance will be -0.6 m on Columbia Glacier. The warm weather was evident in the temperature of the water being much warmer than usual in the stream ford that is required to reach the glacier.
 Annual layers of the Lower Curtis Glacier terminus.
 Surface stream assessment, Ben Pelto
 Ben Pelto in his tenth year working on the glaciers, fording stream in wet weather to access Columbia Glacier.
 Snowpack on Columbia Glacier limited blue ice.
 Blanca Lake and Columbia Glacier.
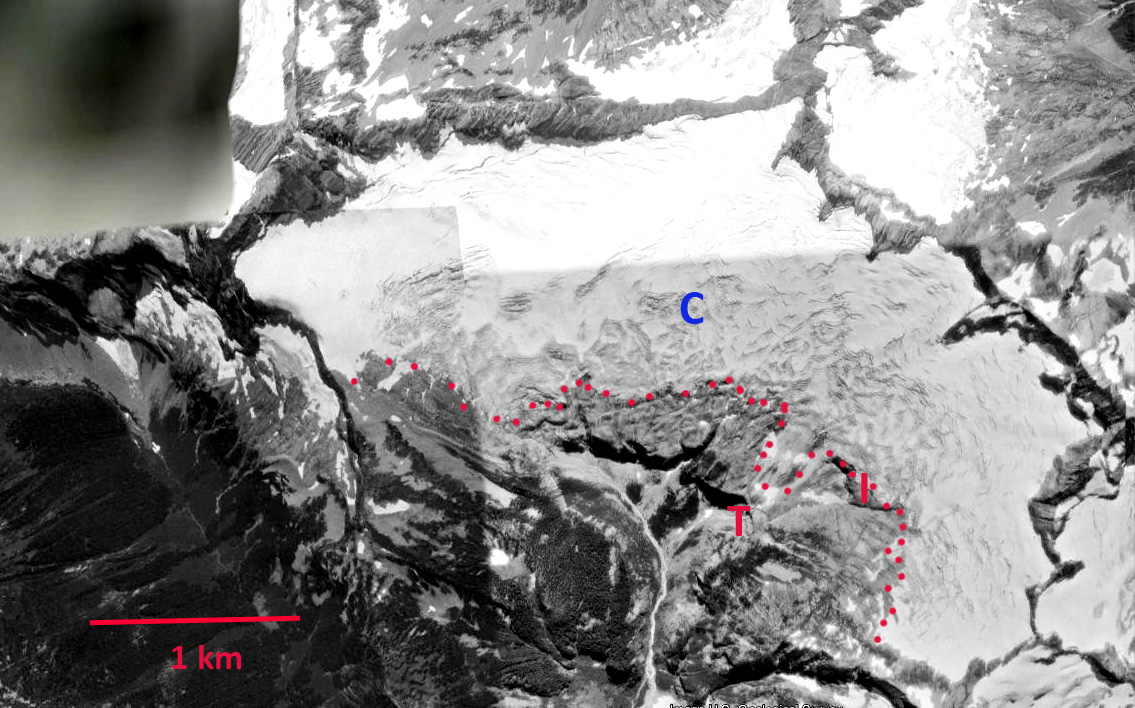
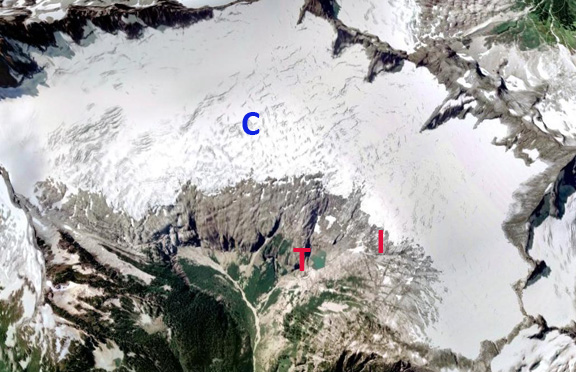
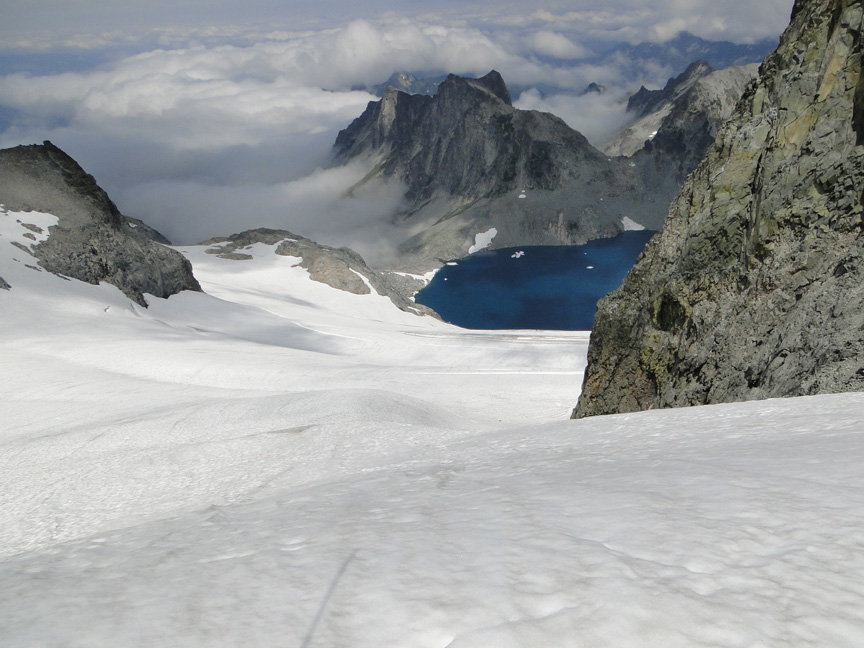
On Mount Daniel the first surprise was that Deep Lake had changed from the normal blue to a jade green. This was due to the heavy rain, even east of the crest, the previous three days, which also caused the Cle Elum River to be quite high, though the water was also warm. Having hiked passed this lake each of the last 30 years this is the first time it was not a deep blue color. It will be interesting to see how long it is until the color reverts to normal. We hiked up the Daniels Glacier to the main summit of Mount Daniel, then descended the Lynch Glacier before reascending the Lynch Glacier. Both glaciers had below normal snowpack and considerable blue ice exposure. With typical late summer conditions mass balance will be -1.2 m on Lynch Glacier and -1.1 m on Daniels Glacier. Neither glacier receives much avalanche snow. The following day on Ice Worm Glacier snowpack was above normal on the lower half of this small glacier, clearly because of unusually large amounts of avalanche accumulation. The top half of the glacier had 1-2 m of snowpack that will be lost by mid-September. With typical late summer conditions mass balance will be -0.5 m on Ice Worm Glacier 
View down the Lynch Glacier.

Daniels Glacier vieww
 Ice Worm Glacier viewed across terminus melt pond

Marmot near camp.
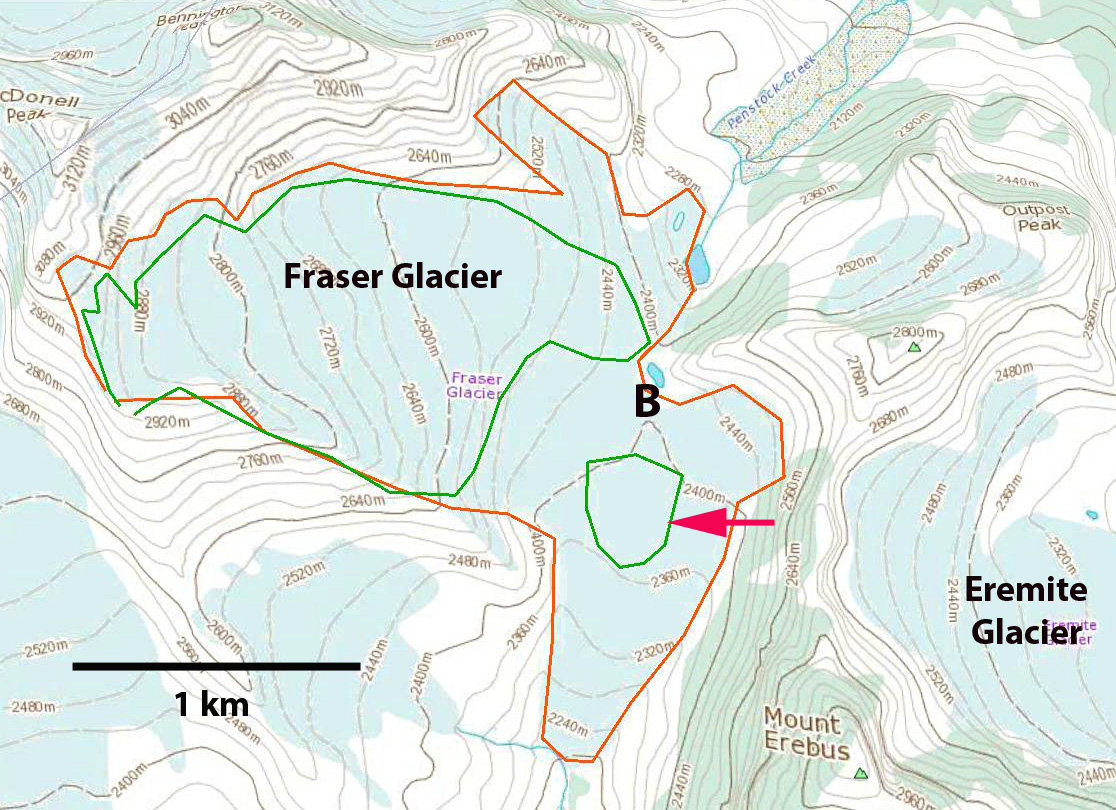
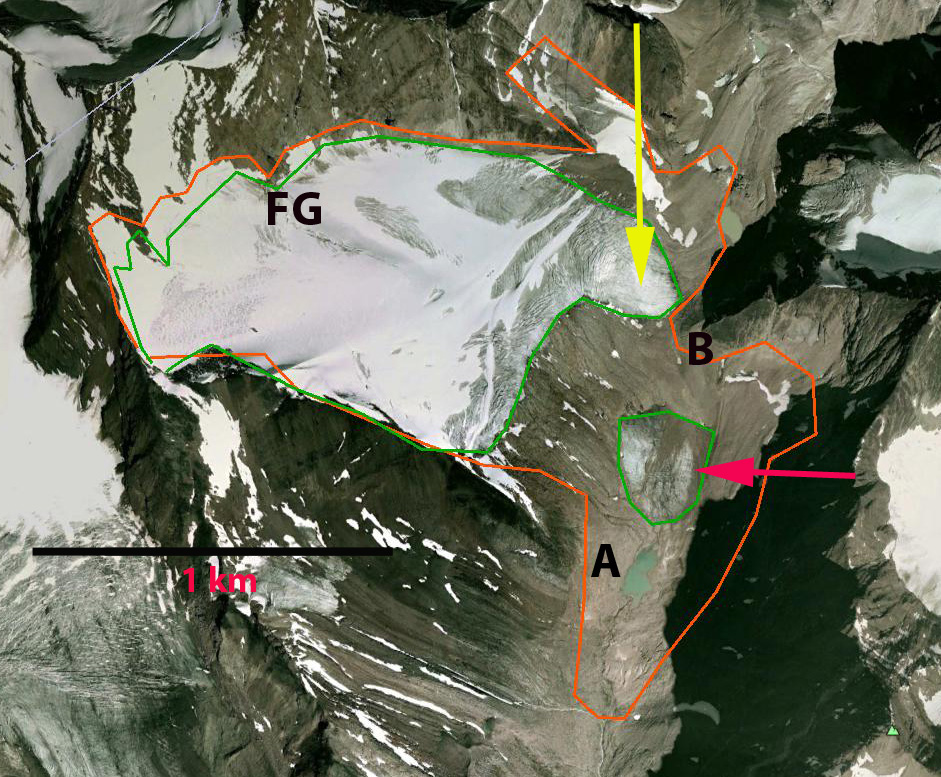
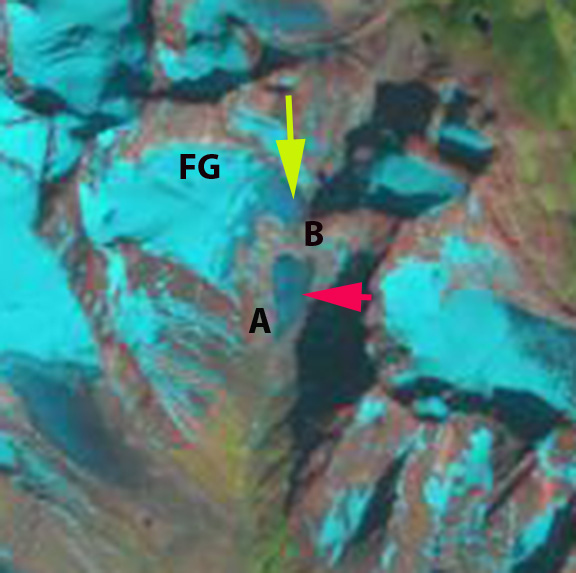
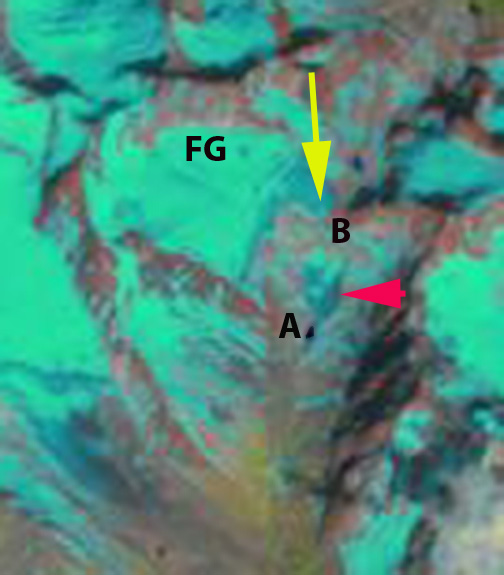
Overall North Cascade glaciers will lose considerable volume. The volume lost is less on glaciers in the southern portion of the range and those with high percentages of avalanche accumulation.

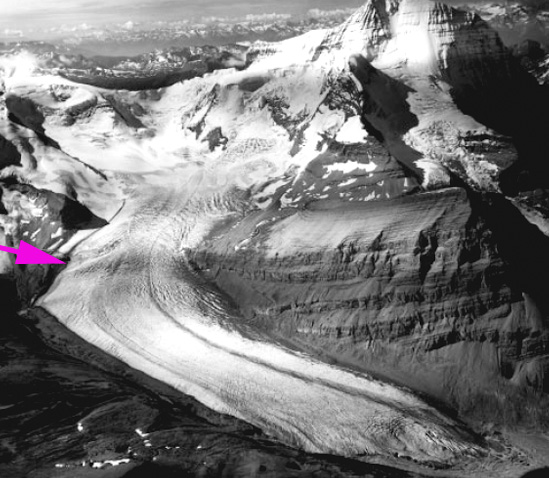
Easton Glacier profile.

Easton Glacier icefall

Melanie Gajewski and Megan Pelto below icefall.