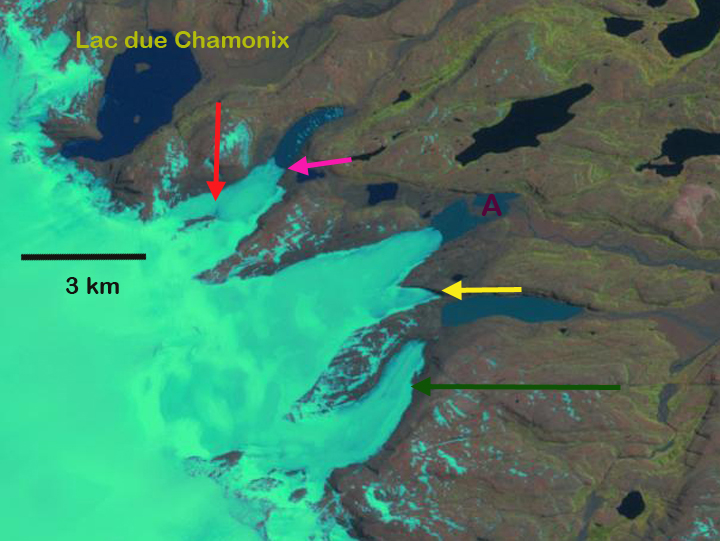
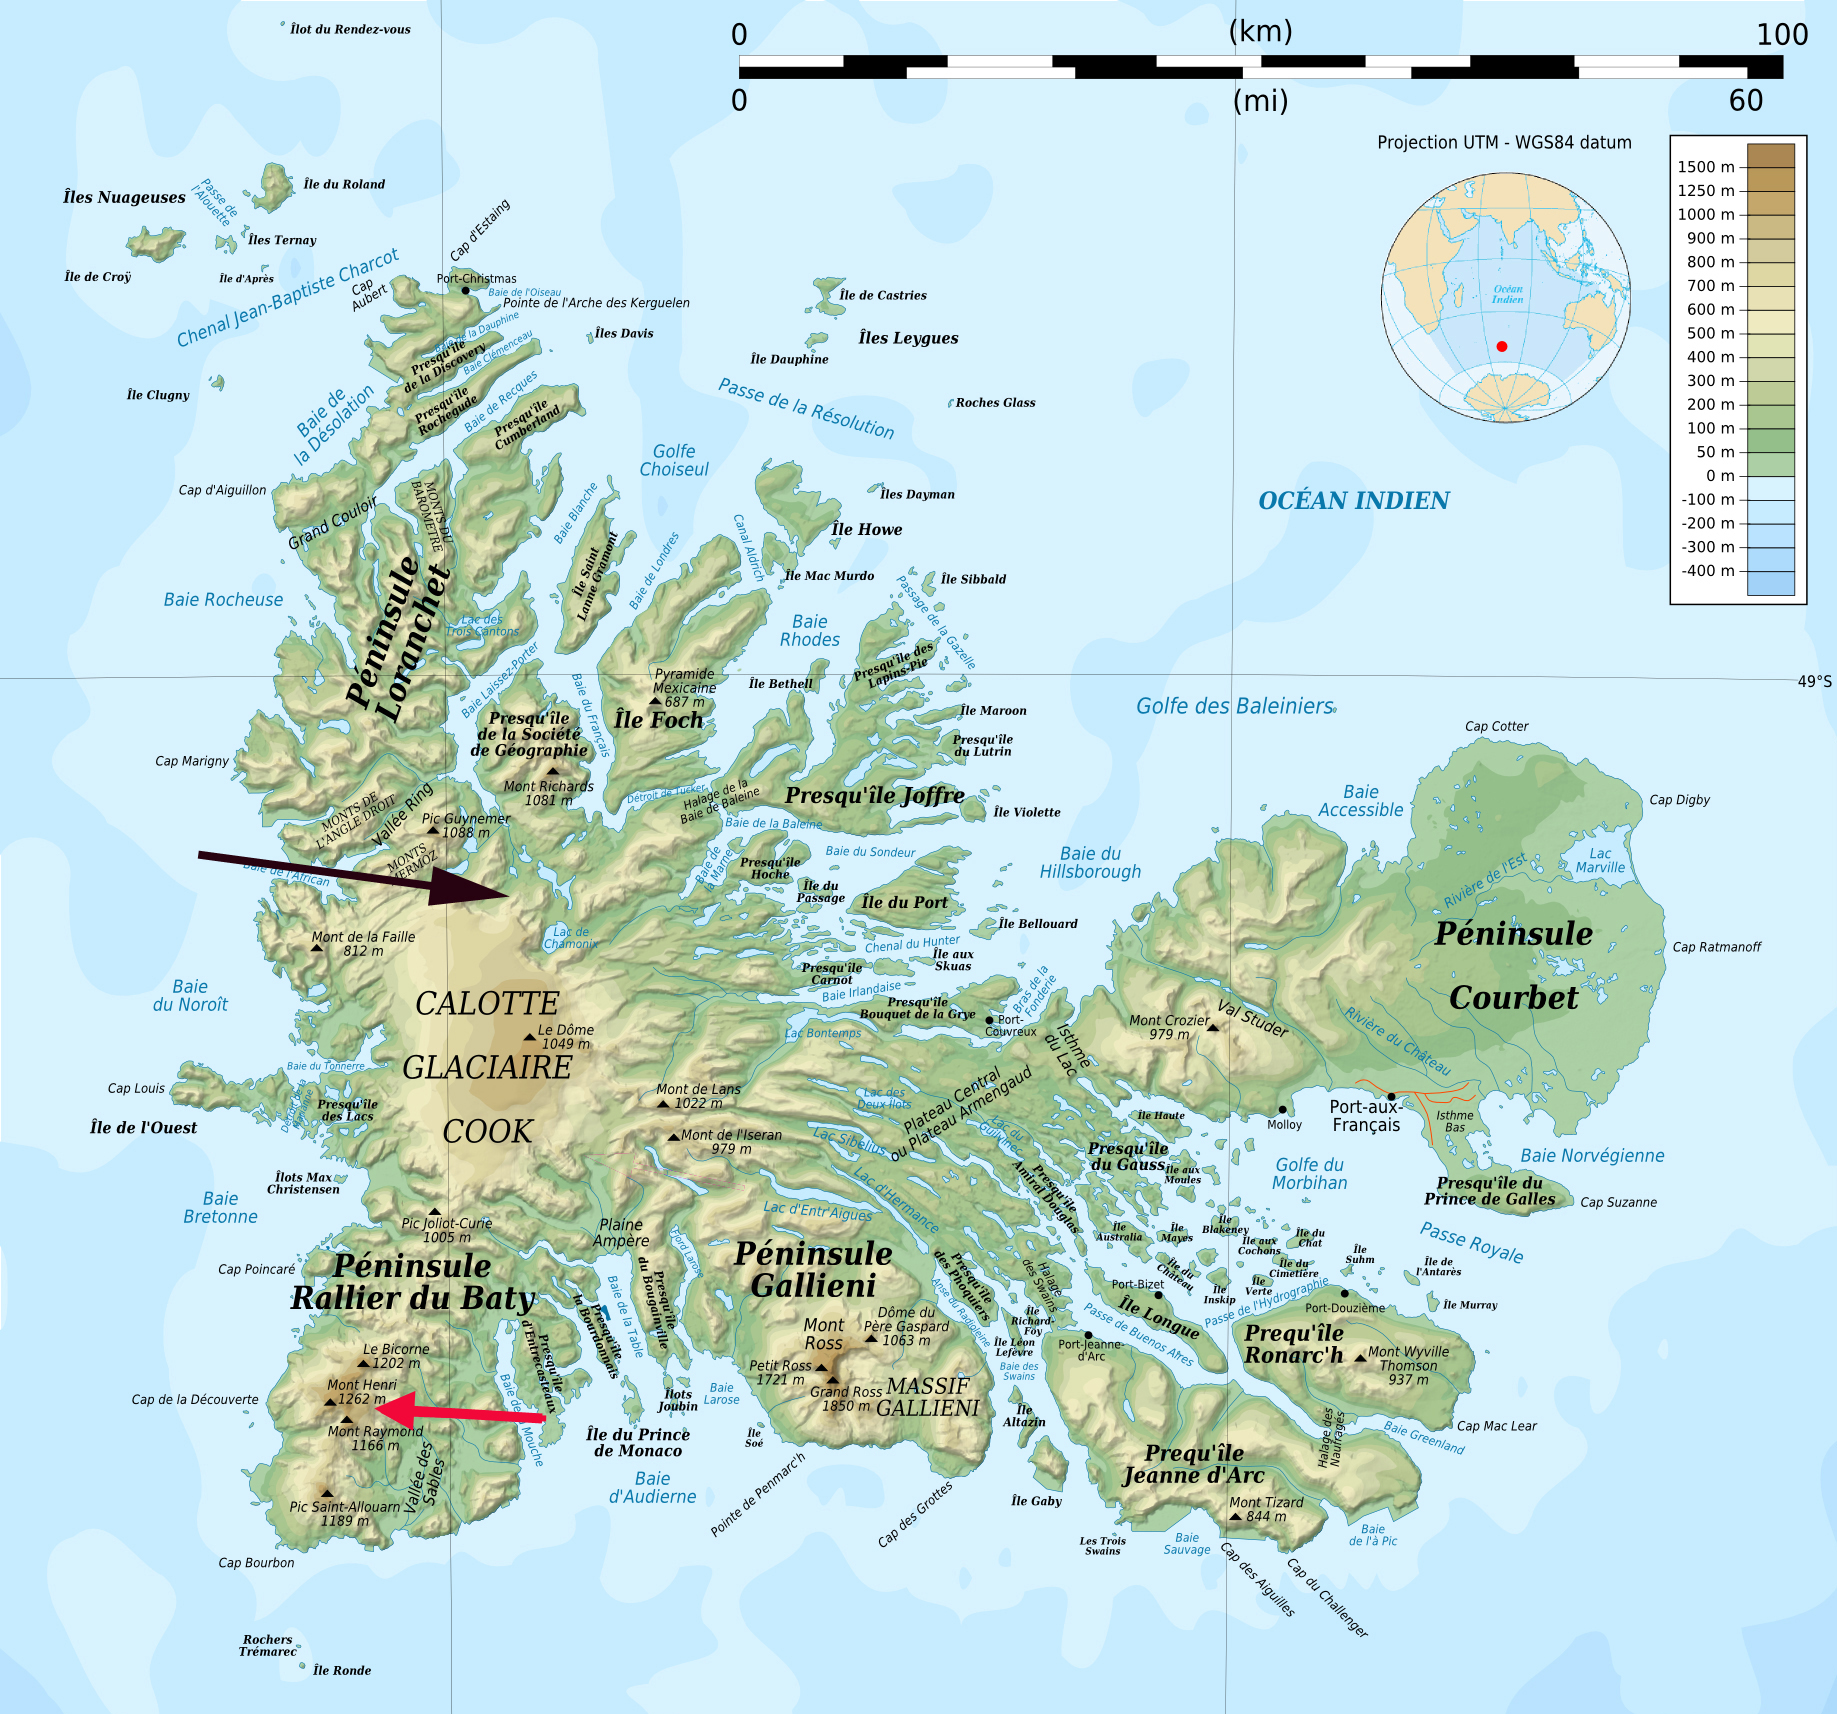
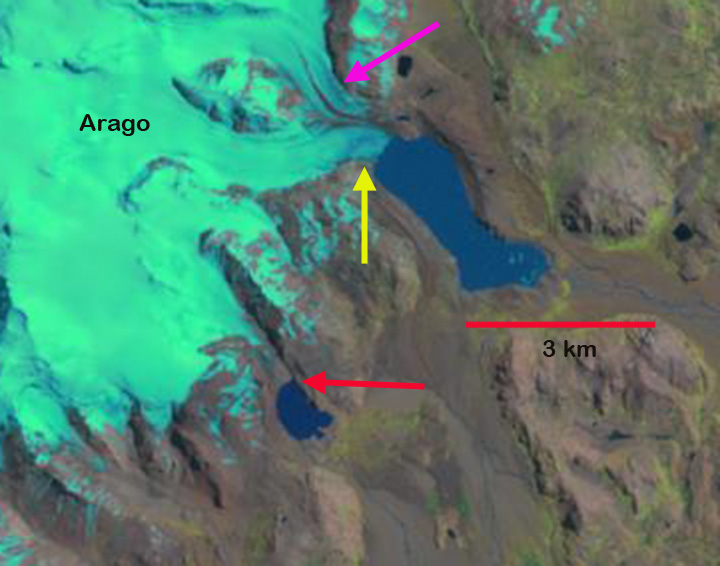
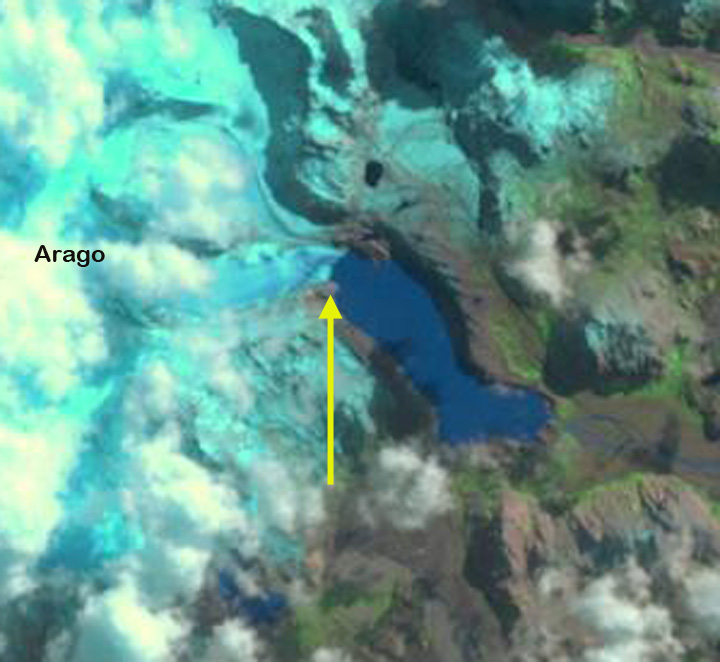
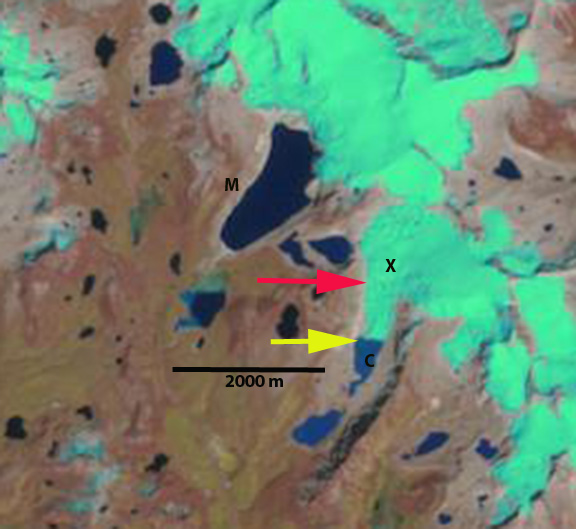
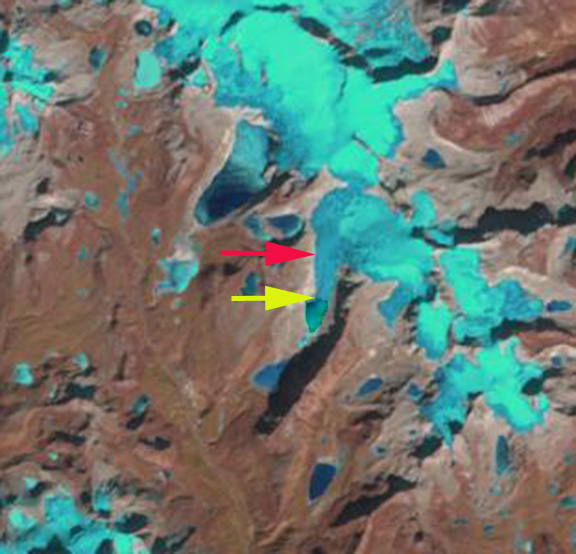
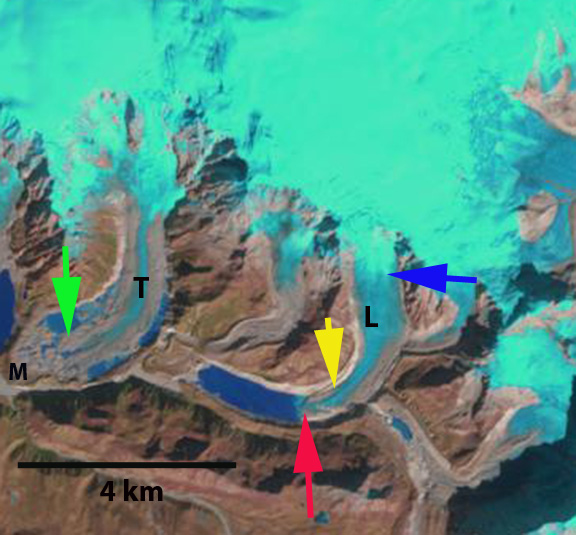
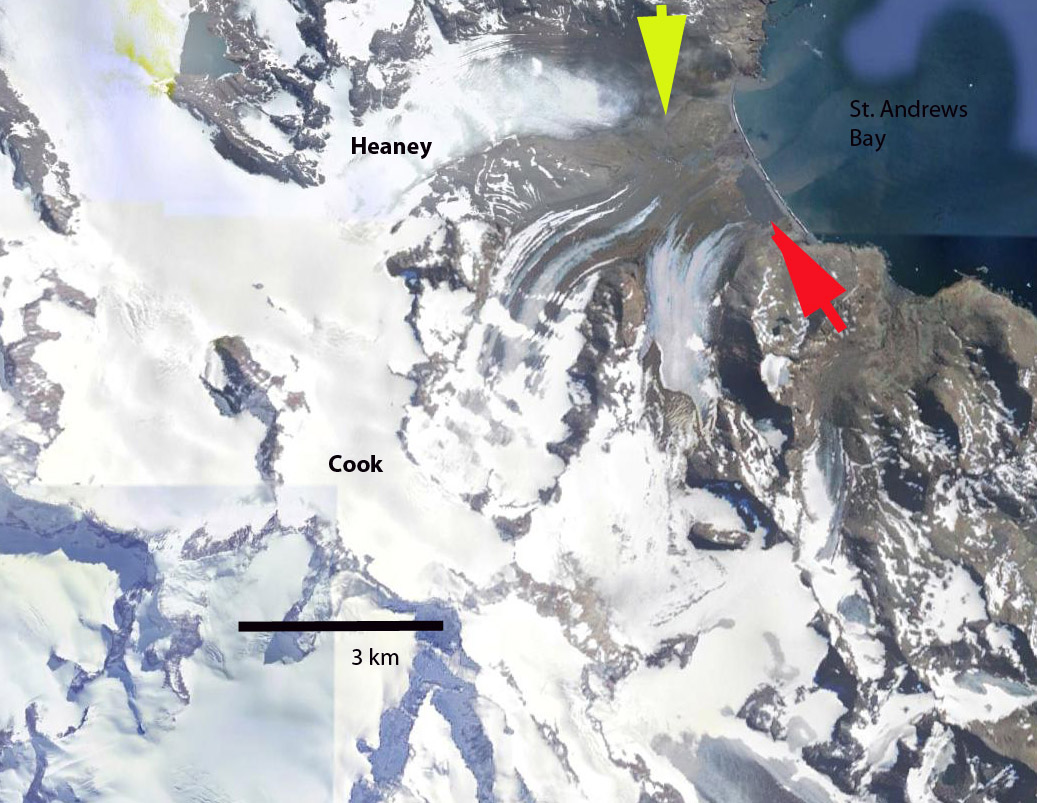
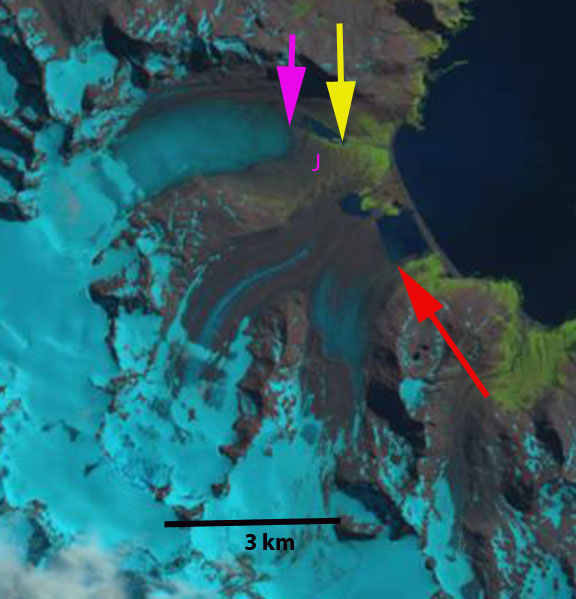
On the east side of the Cook Ice Cap on Kerguelen Island a series of outlet glaciers have retreated expanding and forming a new group of lakes, red arrow. This area is just south of Lac du Chamonix which has existed. Here we examine the changes from 2001-2014 along using Landsat imagery. This is a retreat examined by Berthier et al (2009), and exemplified by the retreat of Ampere Glacier and Aggasiz Glacier from the same ice cap. 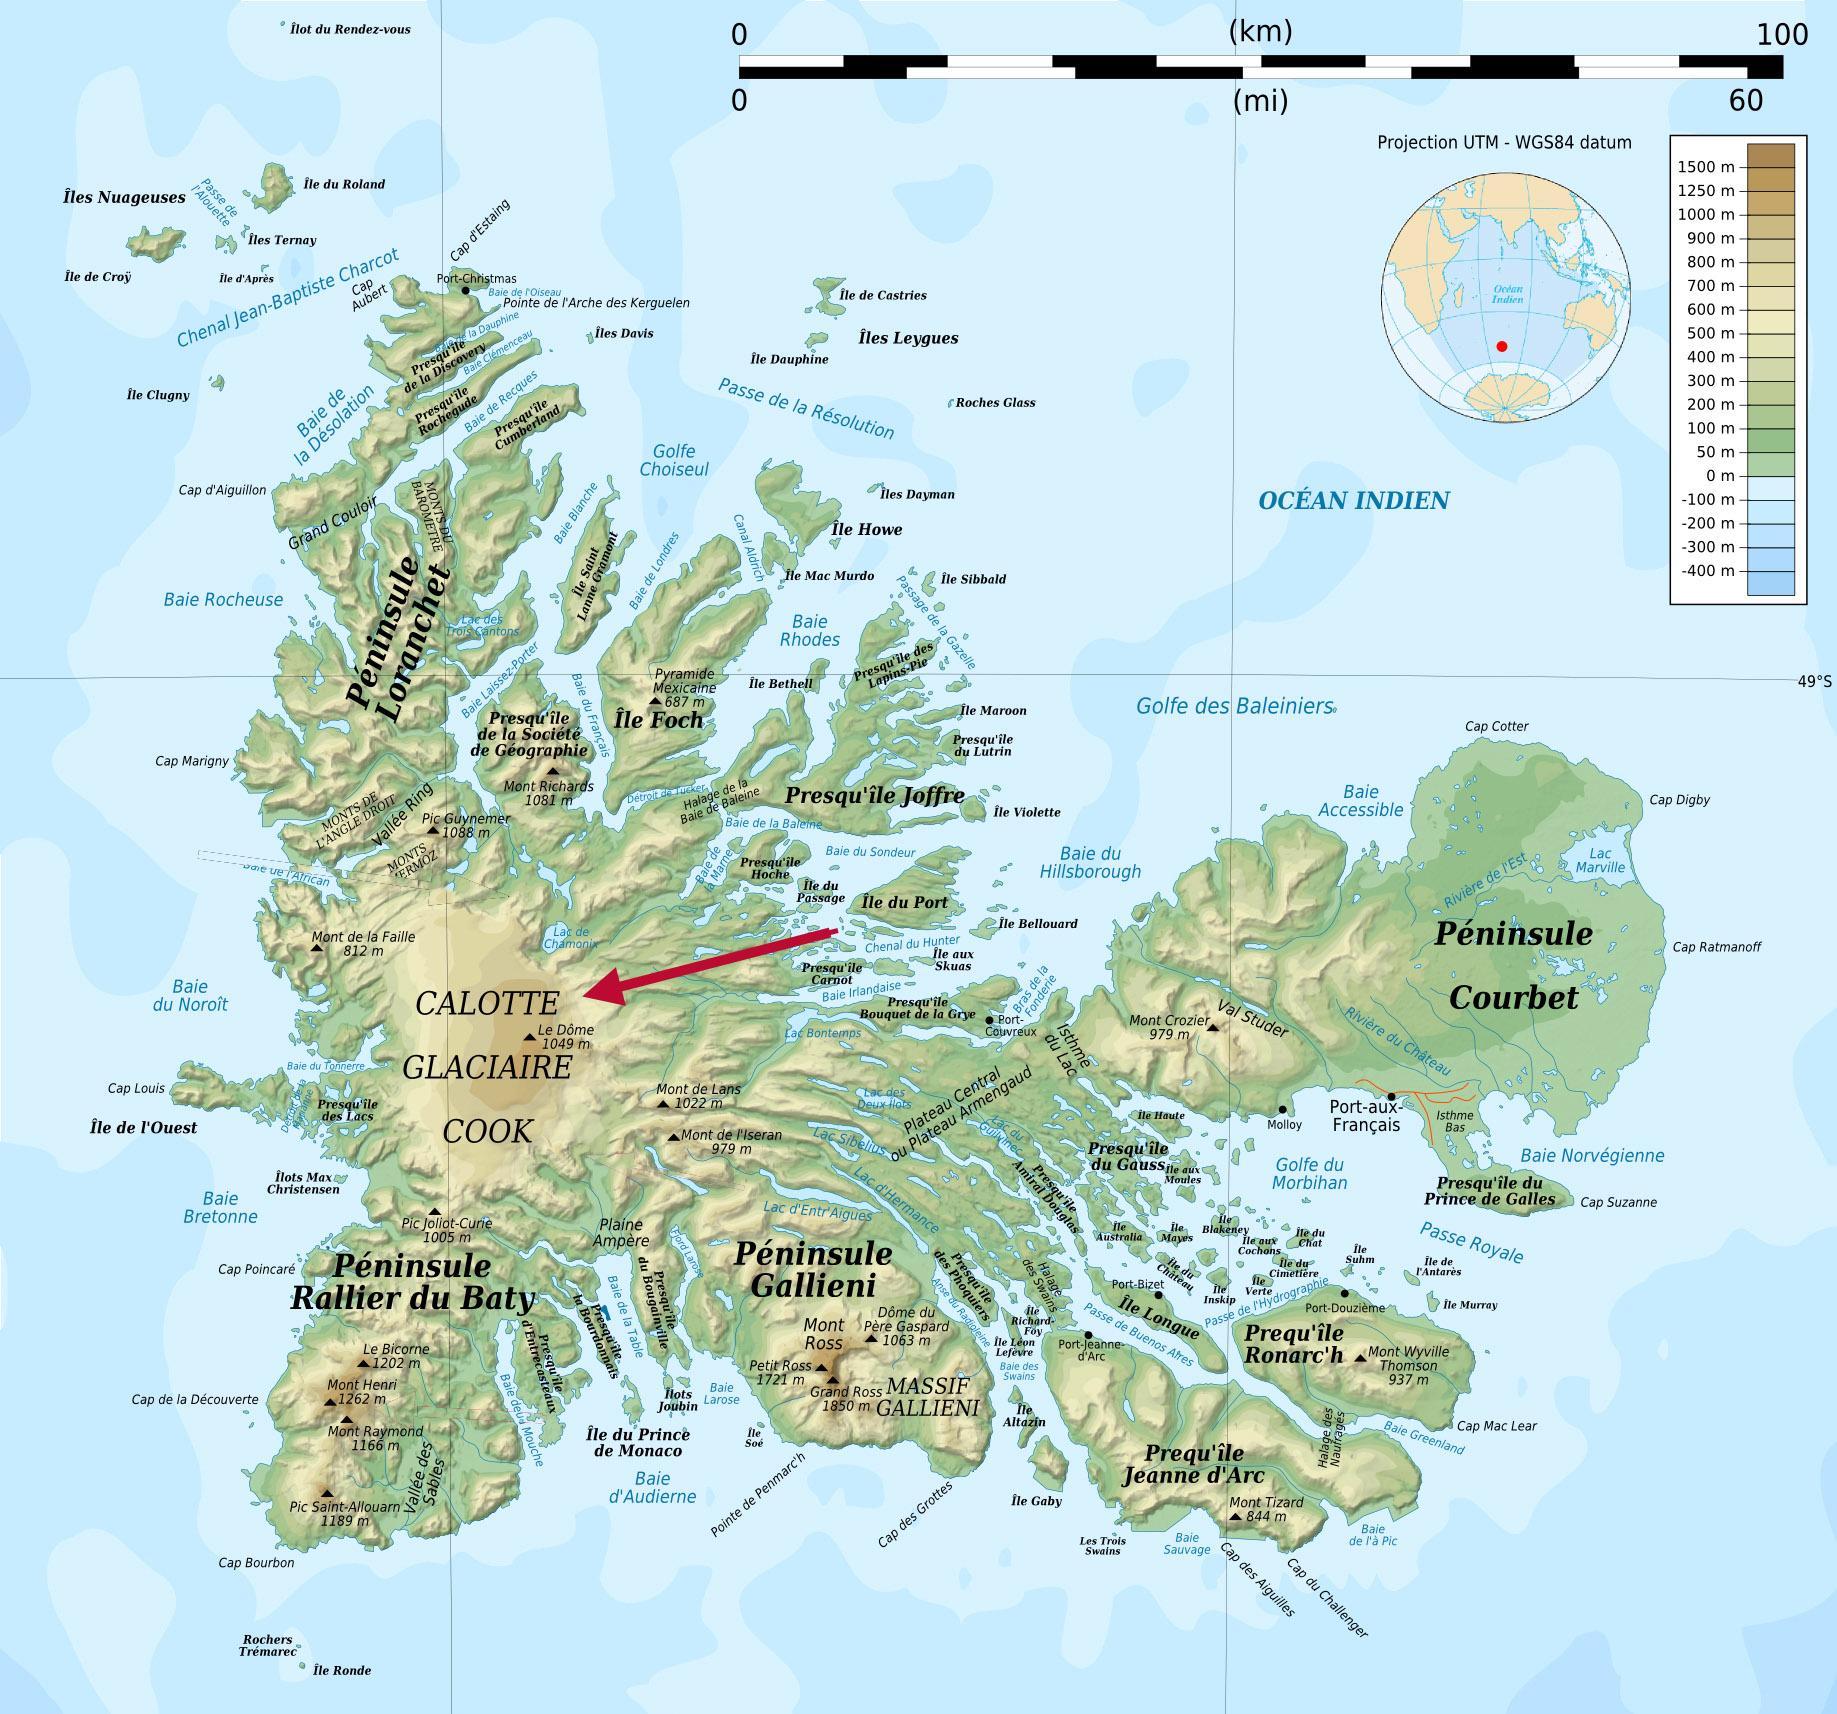
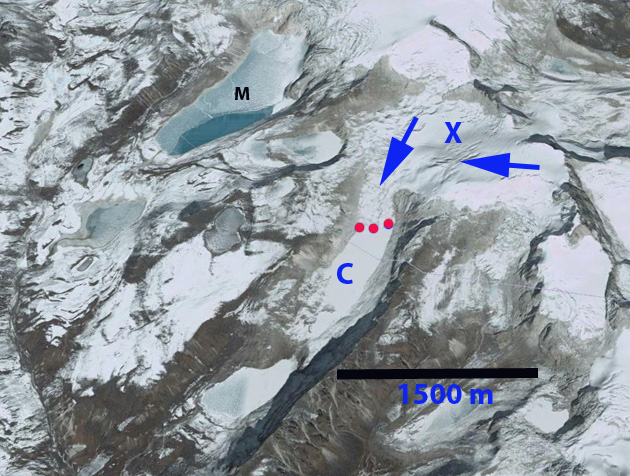
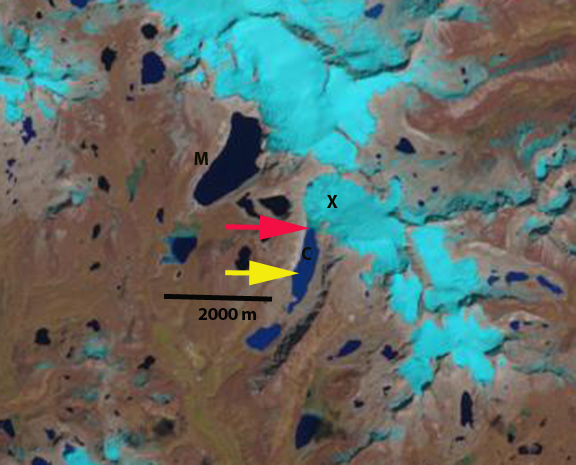
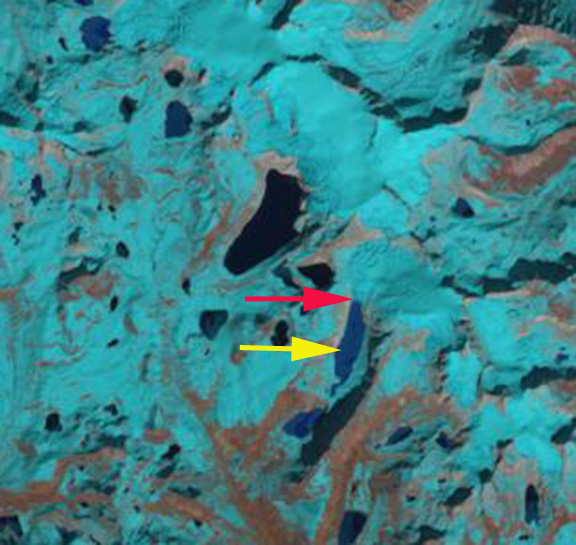
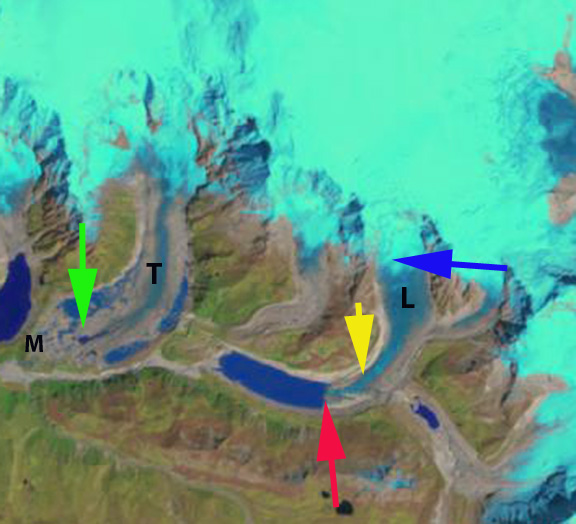
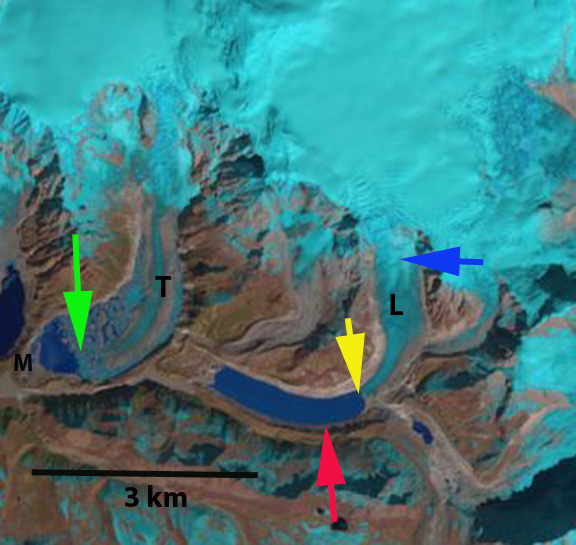
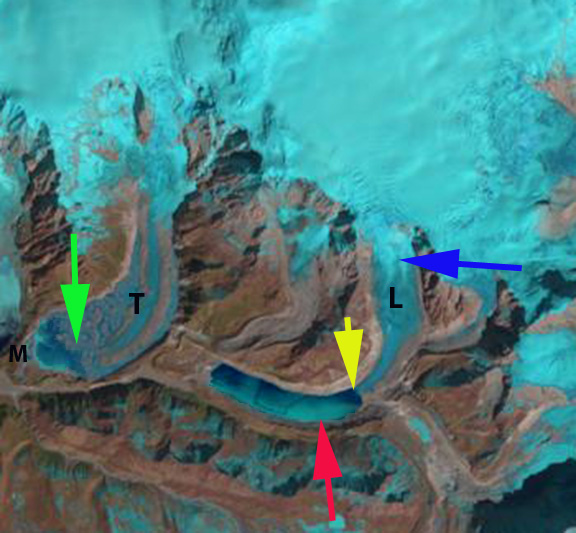
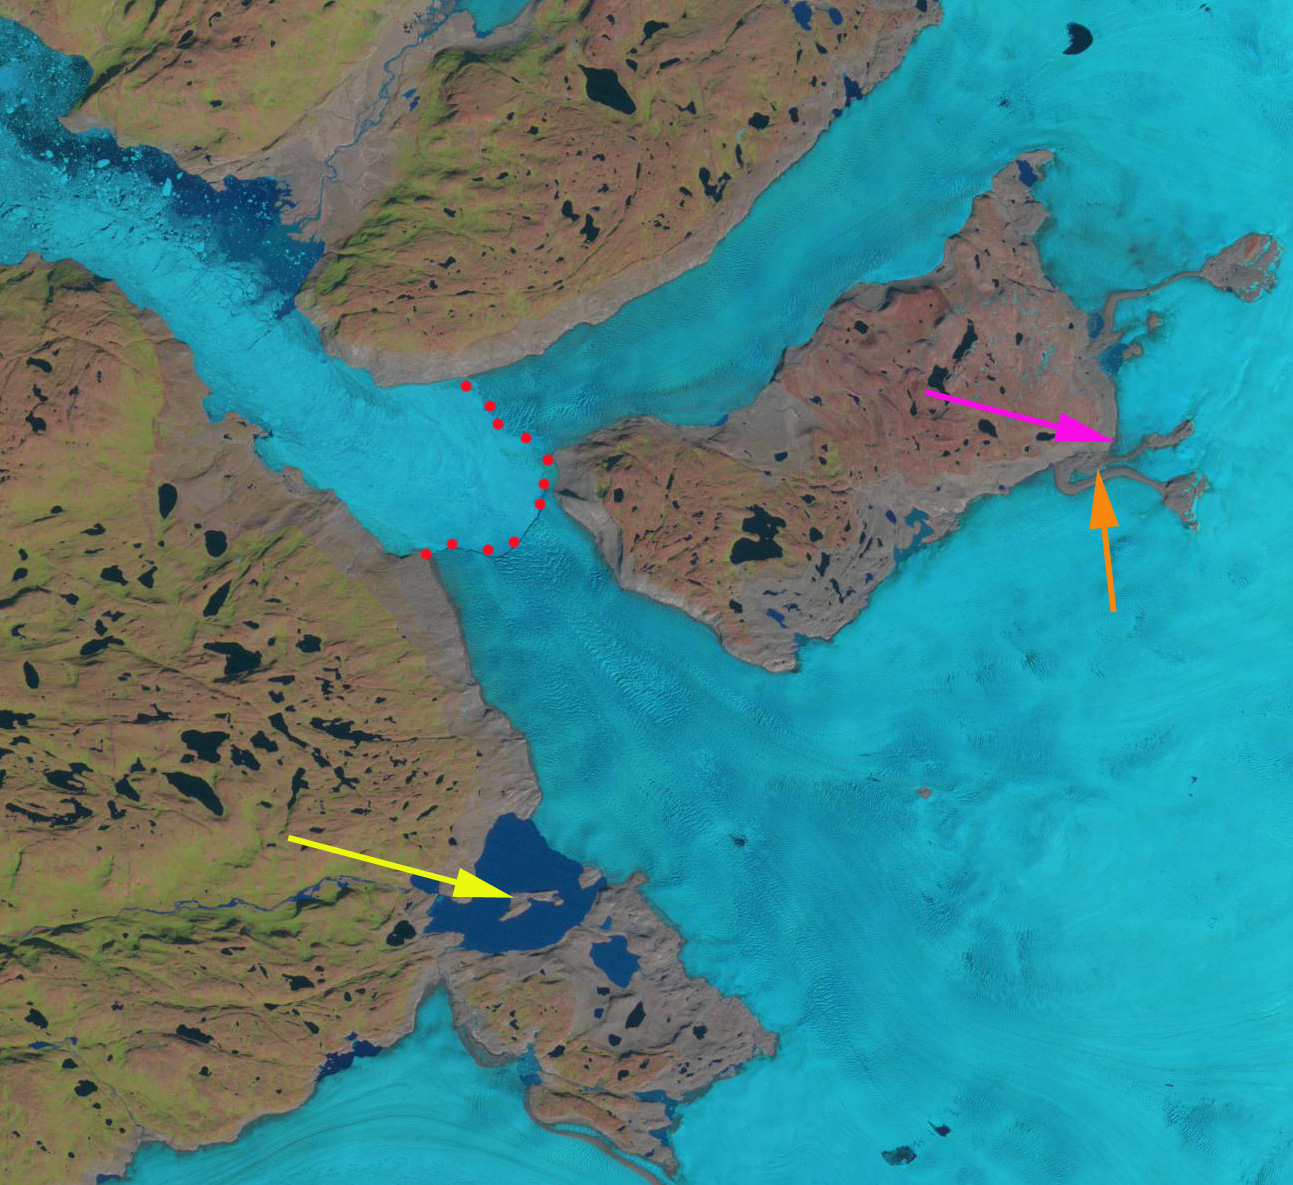
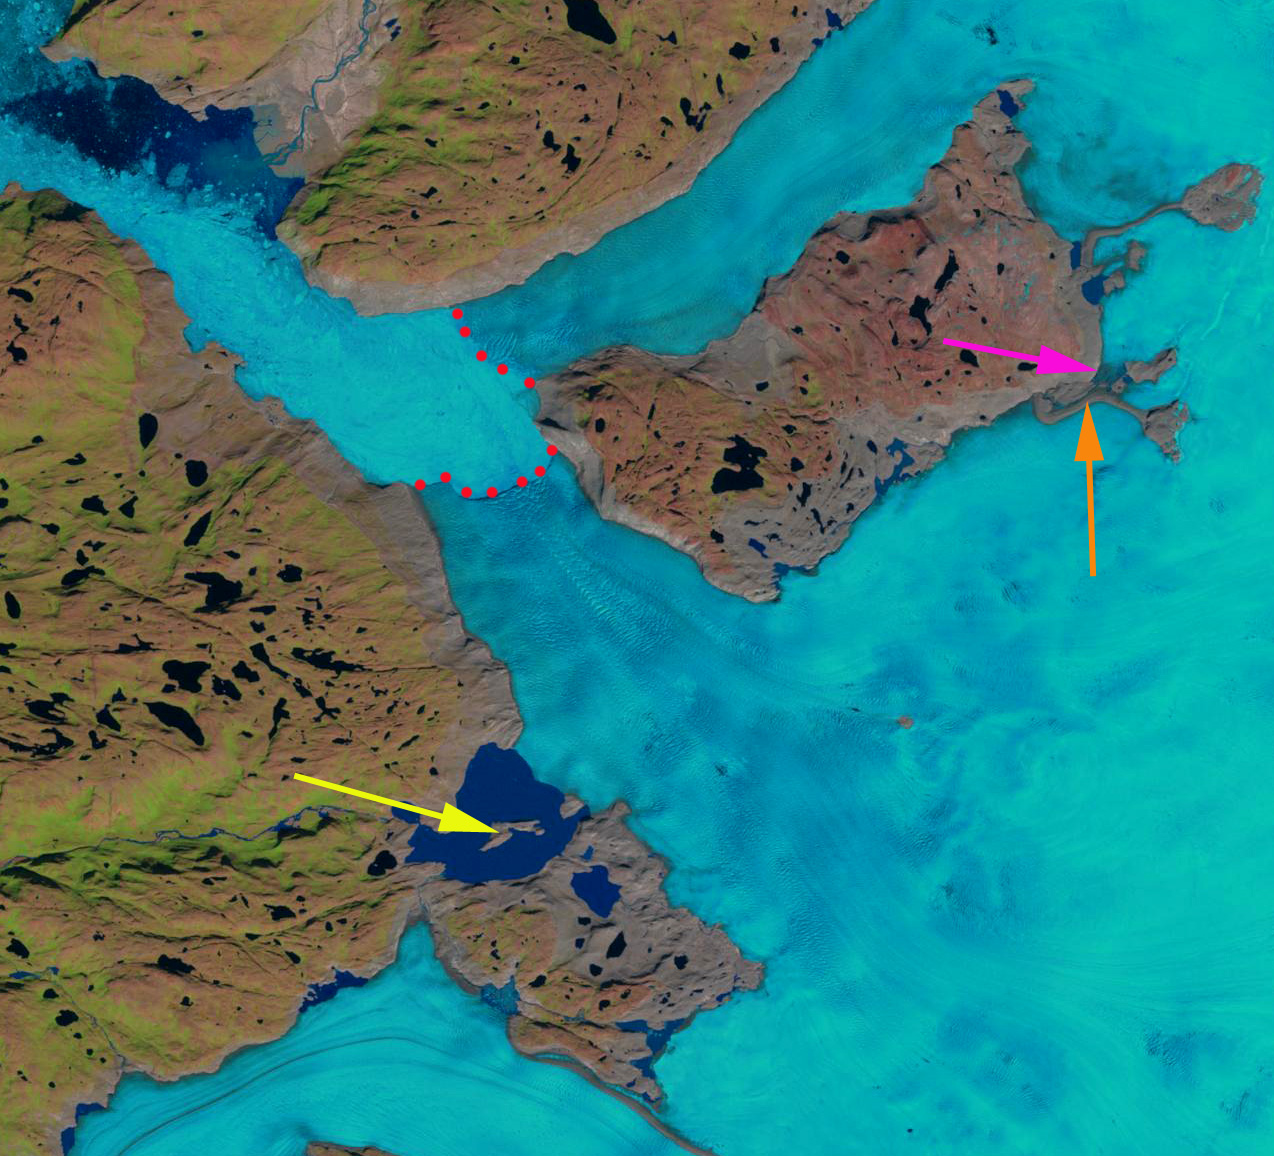
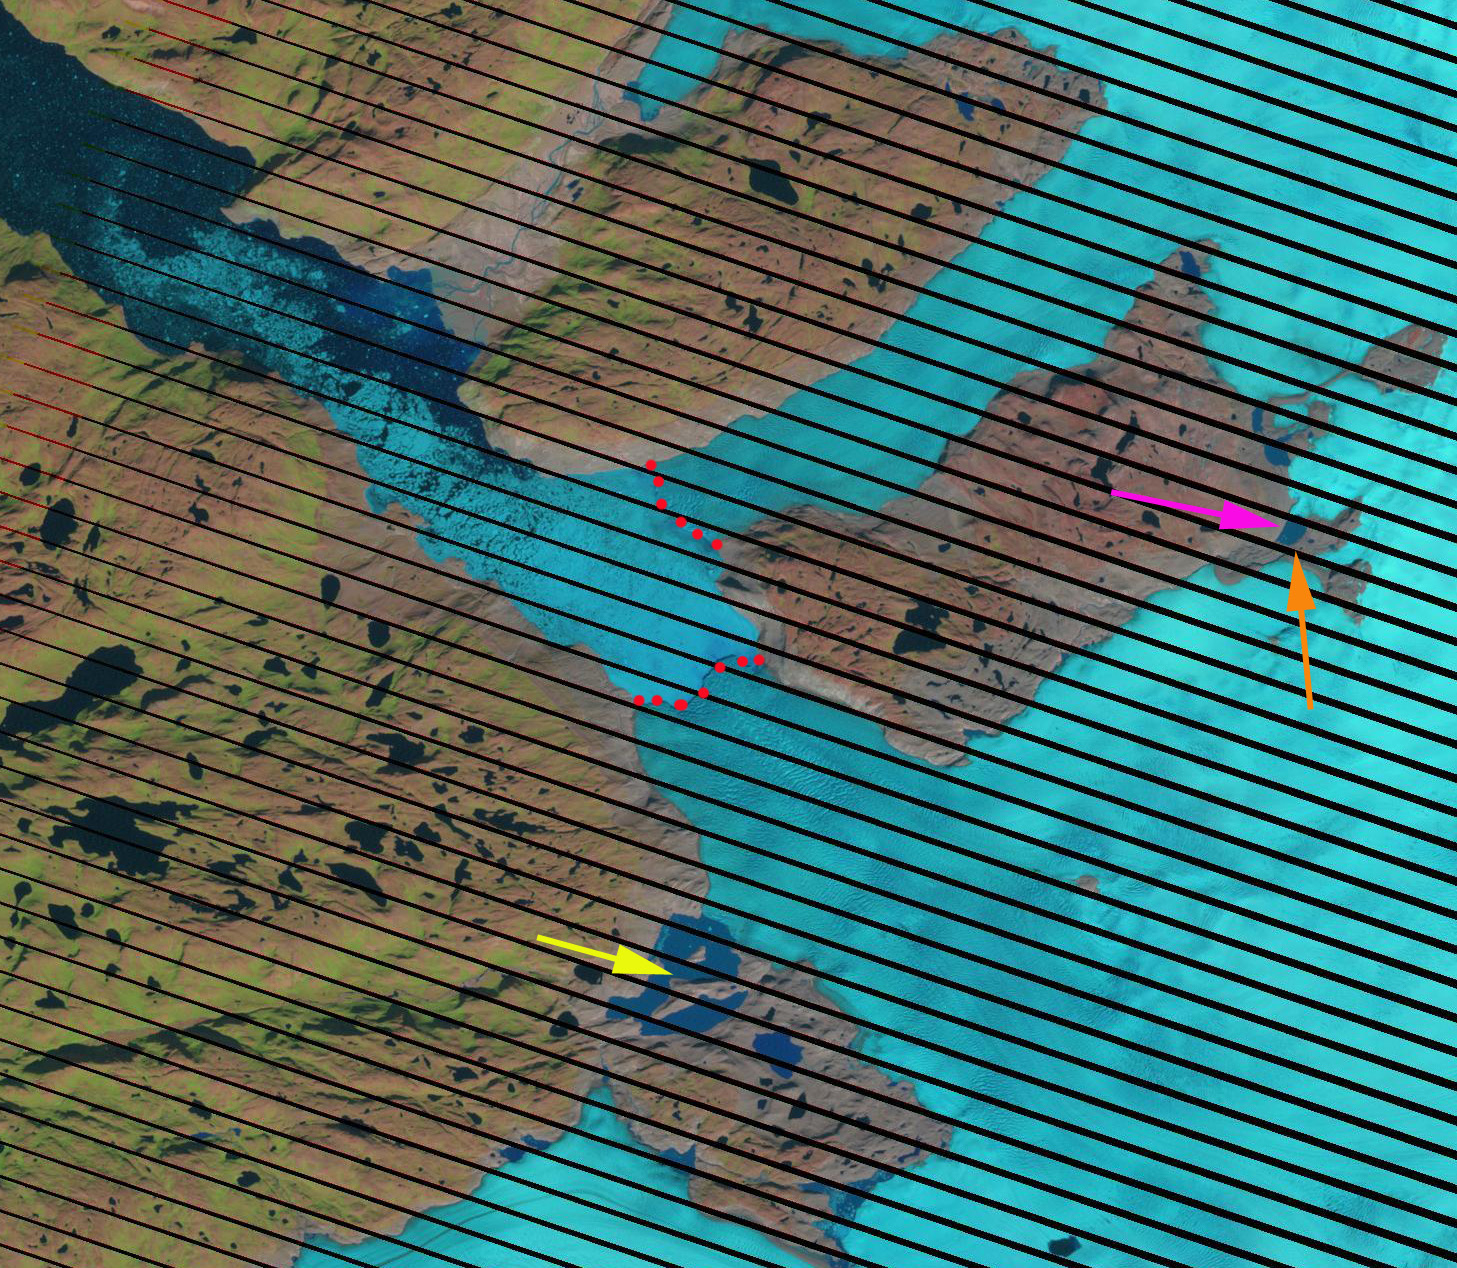
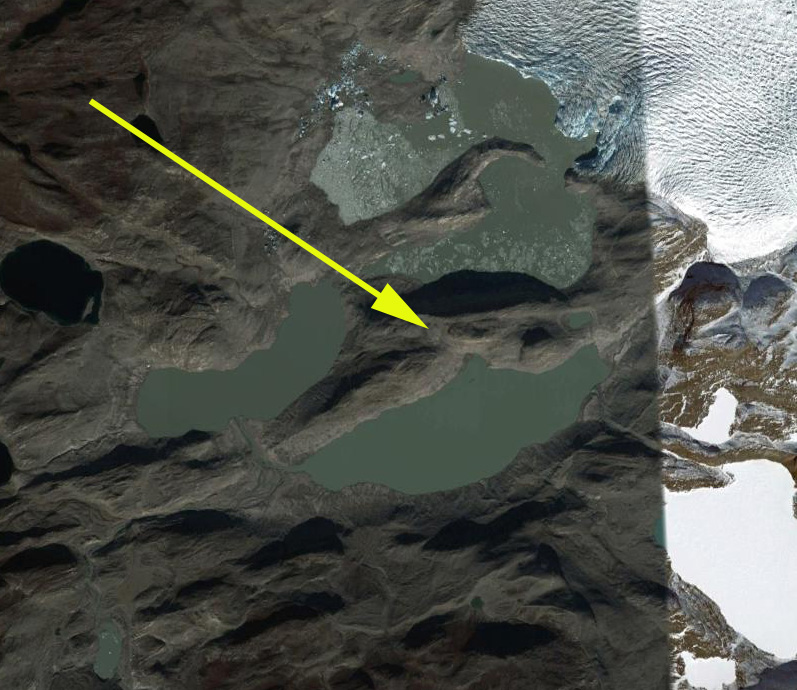
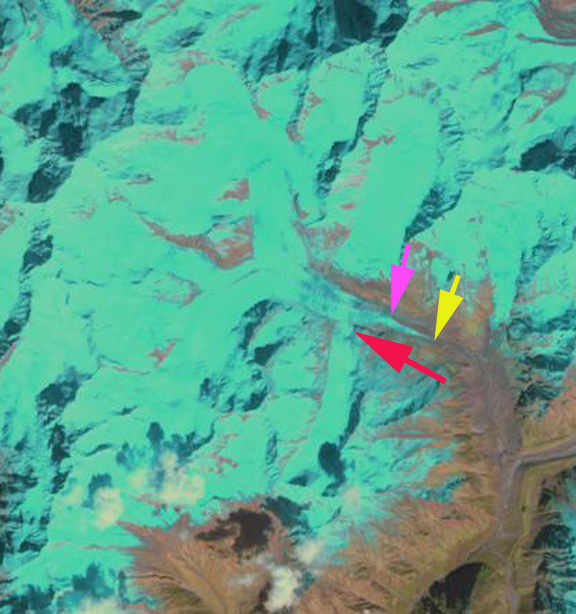
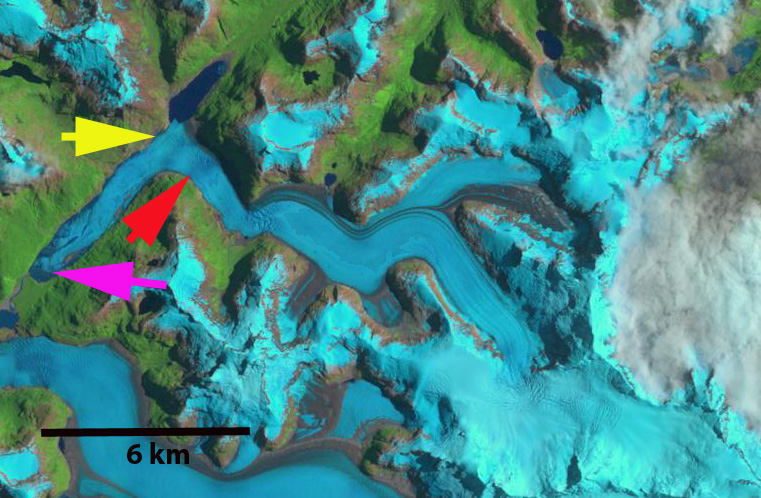
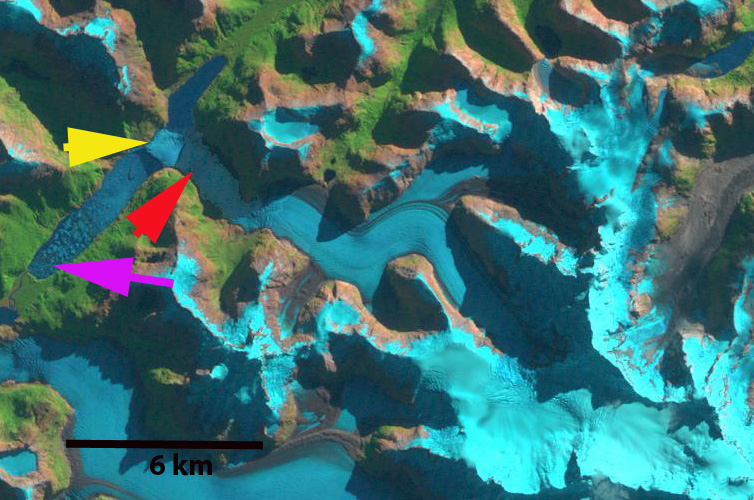
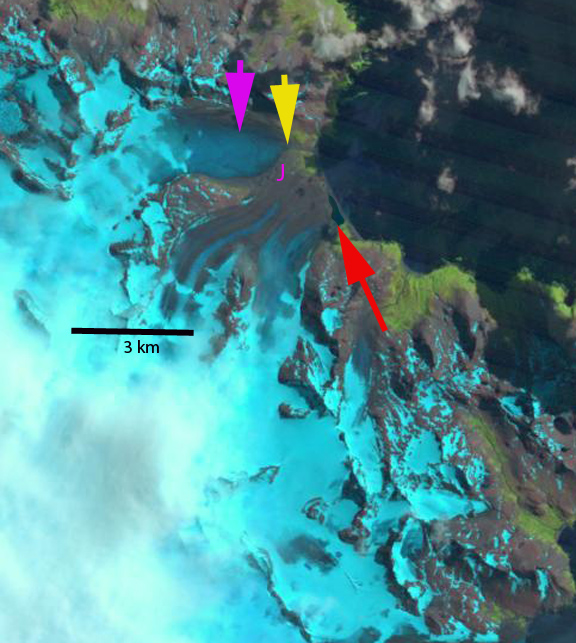
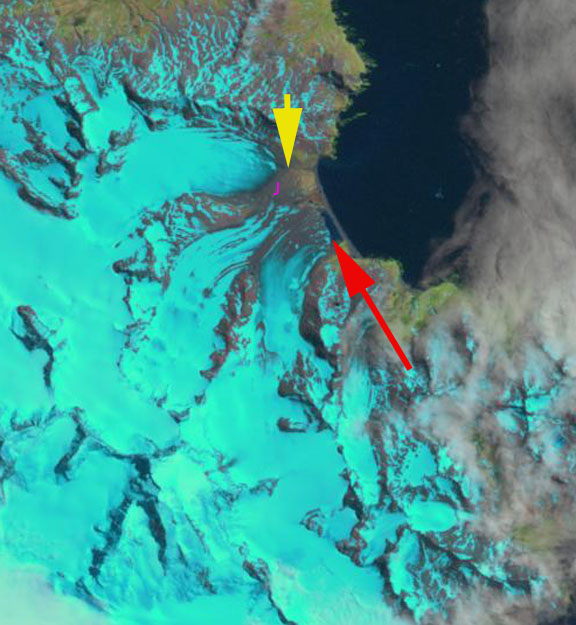
In 2001 at the red arrow is the north tributary of a glacier ending in the northernmost lake at the pink arrow. In the second lake is an island, marked with point A, this glacier has a secondary terminus ending at the yellow arrow. The southernmost glacier examined at the green arrow has retreated from one lake and does not end in a lake. By 2011 the northern tributary is starting to separate losing its connection with the Cook Ice cap, red arrow and retreating from the pink arrow. The distance from the island for the middle glacier has increased. A lake is forming at the yellow arrow. For the third glacier a lake has formed at the green arrow. The 2013 Landsat image still has snowcover obscuring the glacier boundaries. In January 2014, it is evident that at the red arrow the northern tributary has lost all connection with the Cook Ice Cap. The main terminus has retreated 700 m, expanding the lake it terminates in. With the loss of the northern tributary the retreat will continue. The distance from the island at Point A to the terminus of the middle glacier has increased 900 m indicating the retreat since 2001. The glacier is nearly at the western end of the lake it terminates in. At the yellow arrow the new lake is now 900 m long indicating a retreat of slightly less than this. The green arrow marks the 2013 terminus in each image of the southern of the three glaciers. This glacier has retreated 800-900 m leading to the continued expansion of a new lake. In just a decade we see the formation of two new lakes and the expansion of two others at the terminus of the three eastern outlet glaciers of Cook Ice Cap.