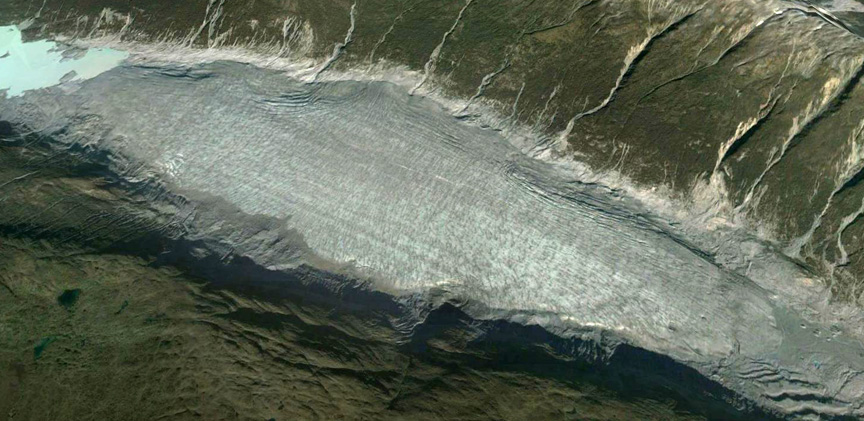
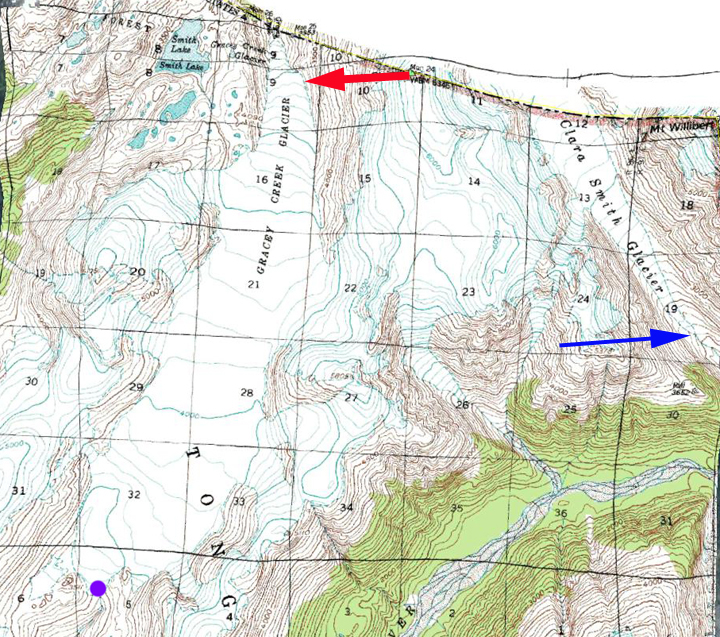
The Lyell and Ramsay Glaciers are the northernmost substantial valley glaciers in the Southern Alps of New Zealand. Their combined run-off is the chief source of the Rakaia River. The Lyell glacier was first observed by Dr.von Haast in 1862, from Mein’s Knob (M), at the time the glacier was 9 km long and ended close to Mein’s Knob. In 1949 Lyell glacier extended east from Rangiata Col some 7 km, and Lyell Lake (L) had not yet formed. (Gage, 1951). The Lyell Glacier has been the combined flow from the easterly tributary near Rangiata Col (E) and a northern tributary, Heim Plateau (H). Here we examine Google Earth Imagery and Landsat images from 2000-2013 to identify changes in the Lyell-Heim Glacier complex. 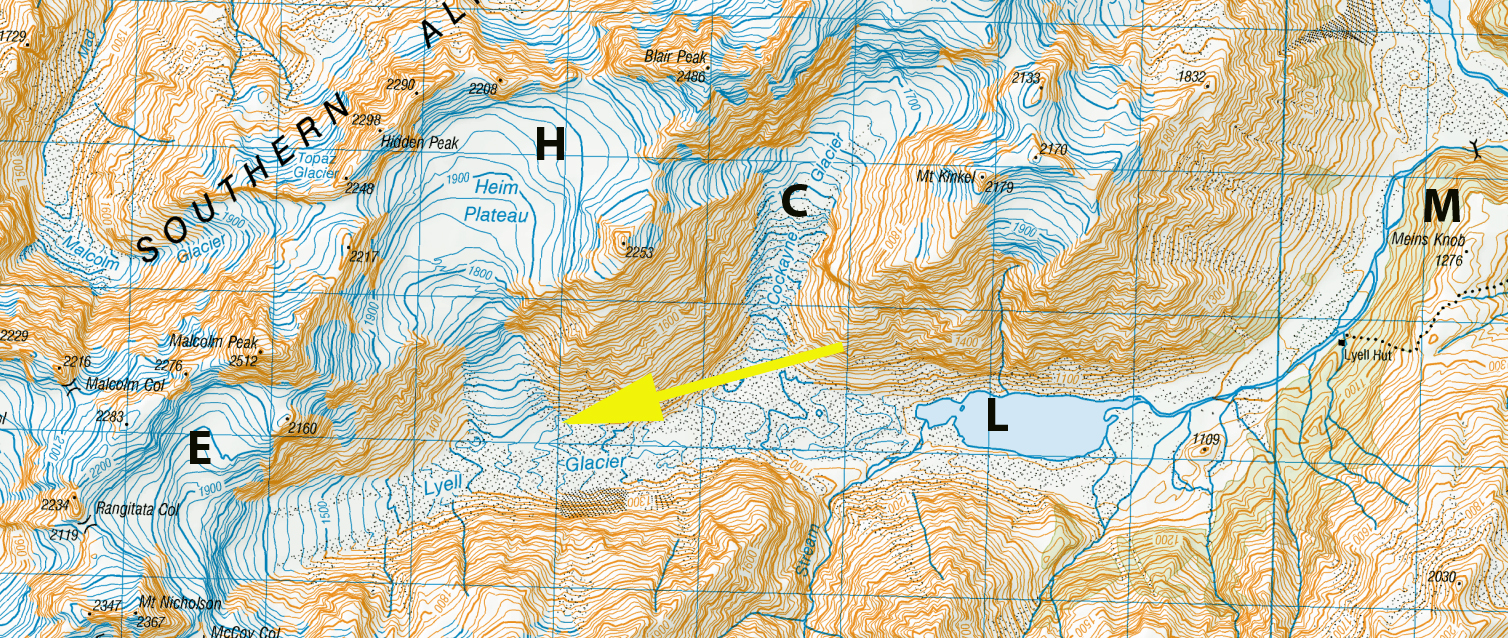
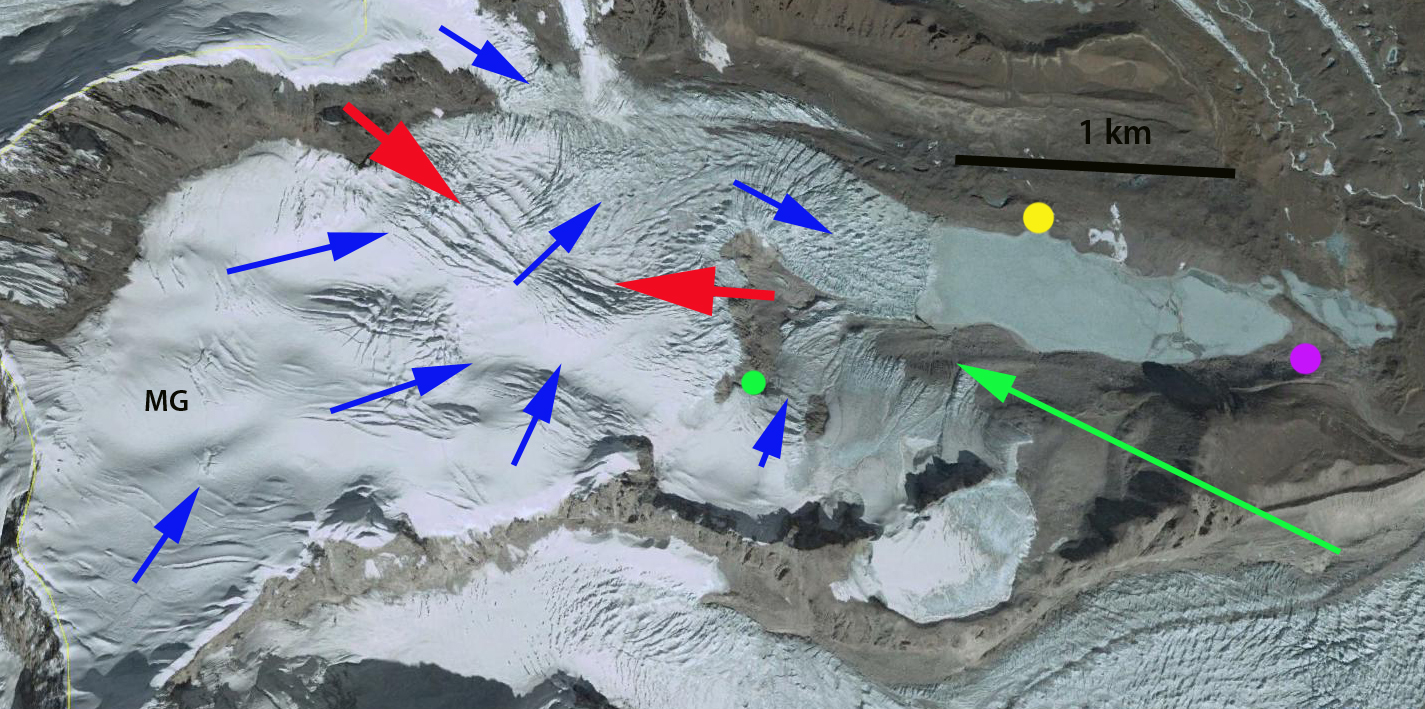
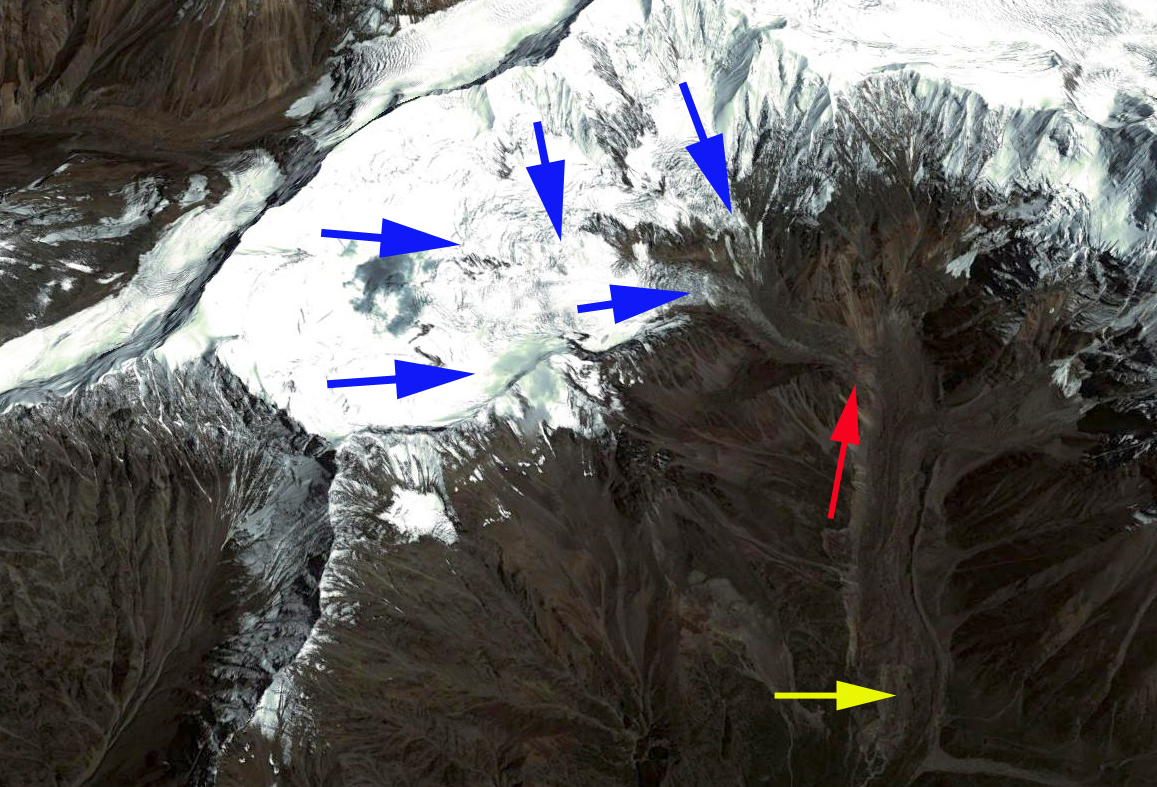
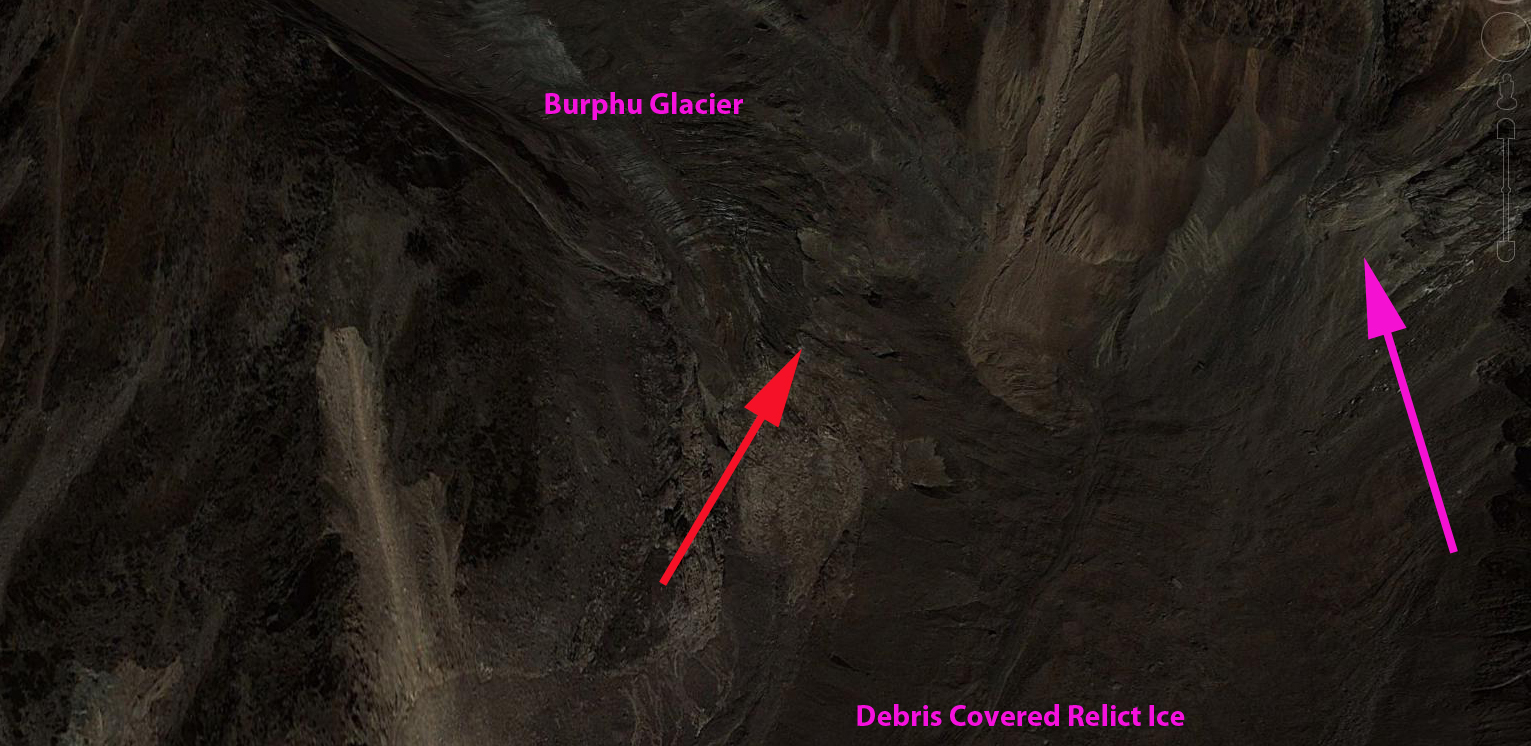
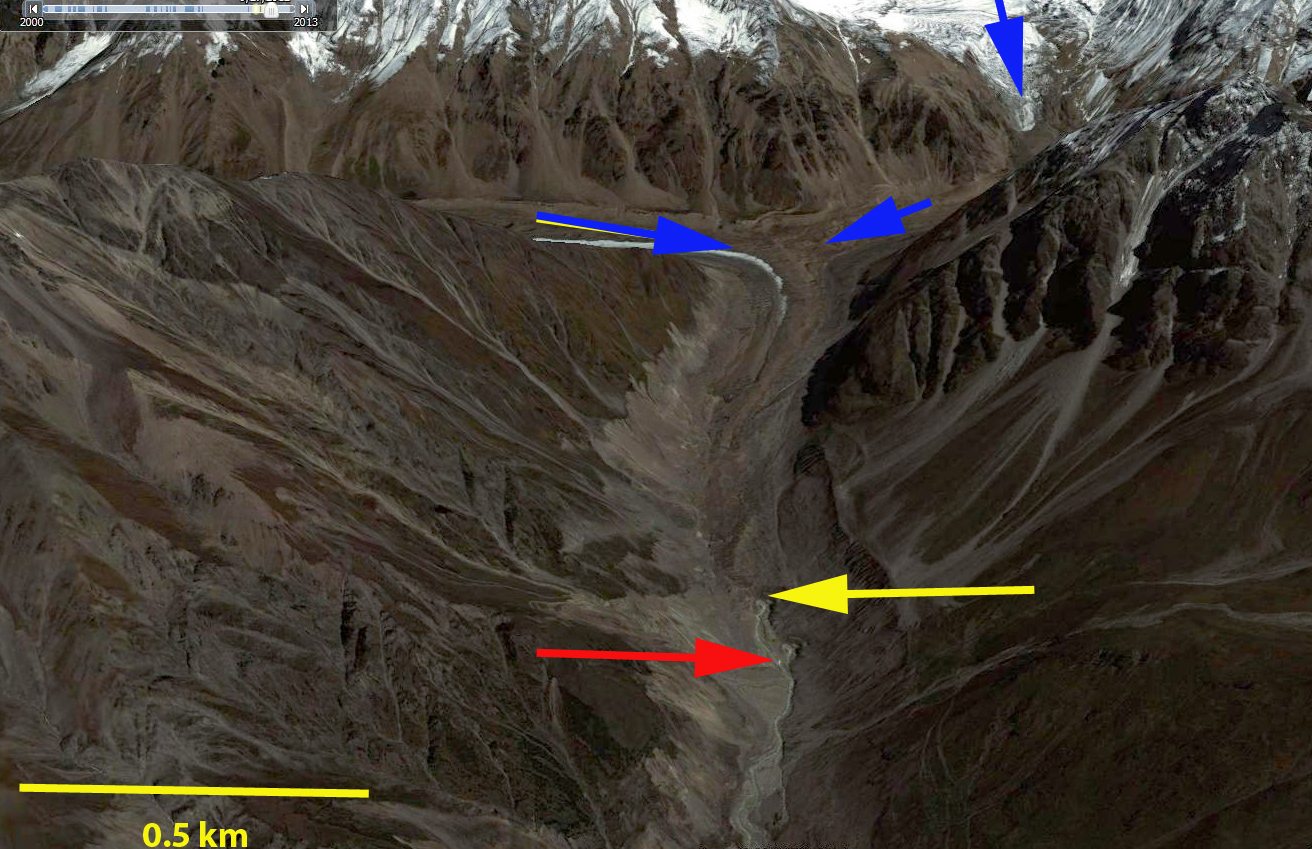
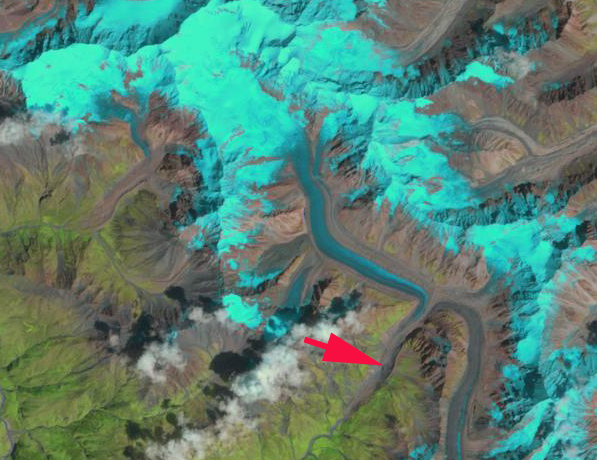
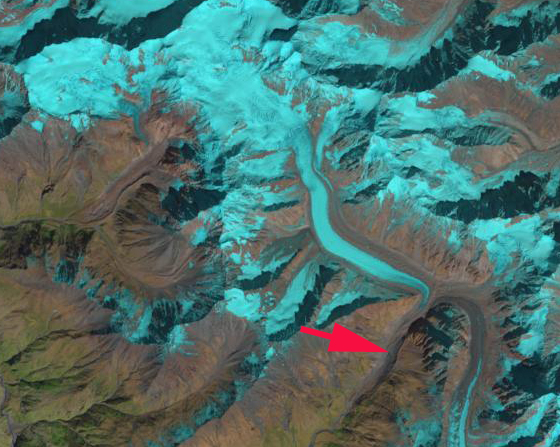
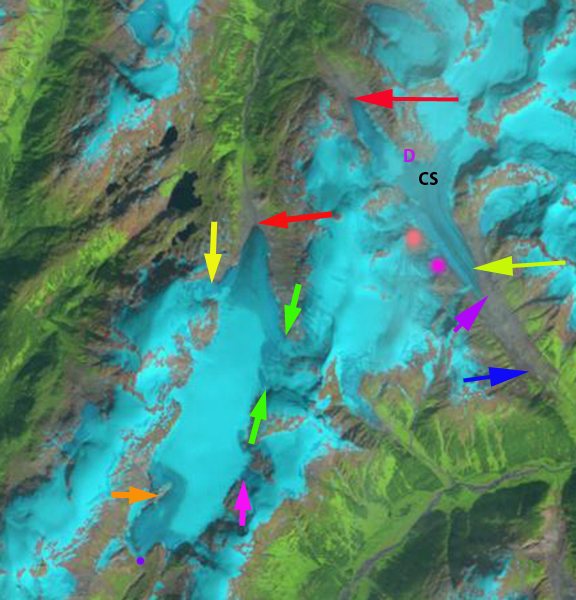
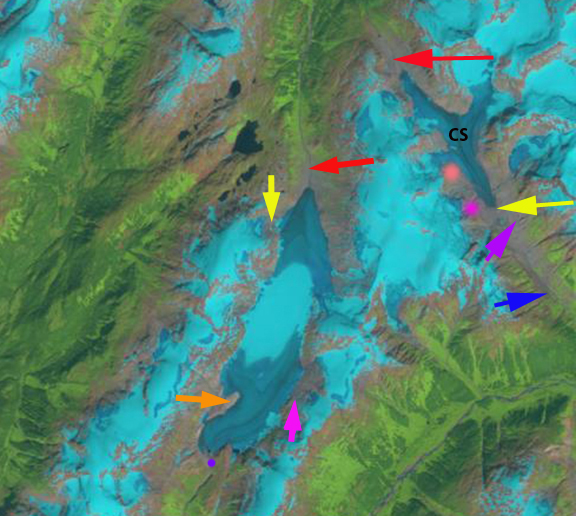
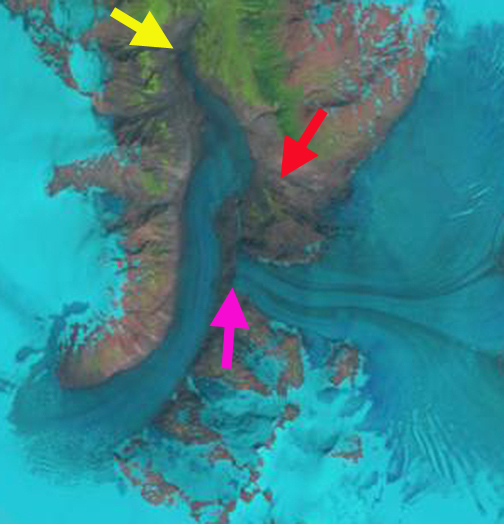
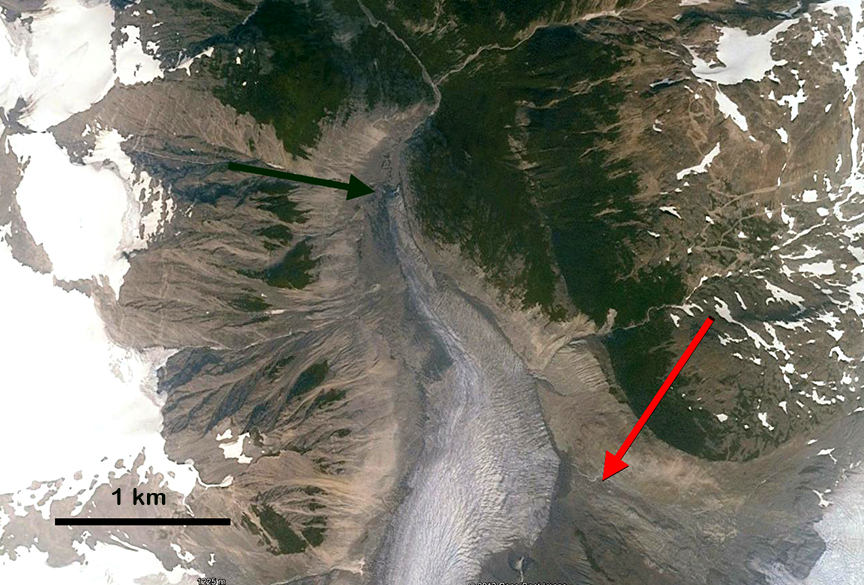
In 2000 the Heim Glacier (H) reached onto the Lyell Lake valley floor, yellow arrow. In 2001 this is evident along with the fact that Lyell Lake is a single lake. The terminus of the Lyell Glacier is obscured by thick glacier cover, and does end near Lyell Lake at the time, the end of the blue ice of the E tributary is not indicative of the terminus location. By 2013 Heim Glacier has retreated from the Lyell Valley and no longer is connected to the Lyell Glacier. A second small lake has formed as the terminus of Lyell Glacier has melted and retreated, red arrow. The terminus of Lyell Glacier does remain buried by debris, but it is stagnant and melting away. Both the Lyell Glacier and Heim Glacier have retreated 400 m from 2000-2013. The Lyell Glacier will likely experience a more rapid retreat in the near future as the debris covered tongue melts away. The 2013 austral winter featured record warmth, and the early melt season has also been warm in New Zealand, the impact on this glacier can be assessed in March or April as the melt season ends. The NIWA snowline surveys will document the impact on glaciers across New Zealand. The glaciers of New Zealand lost 15% of thier volume from 1976-2008 (Chinn et al, 2012). The retreat is like that of most all New Zealand glaciers today, Donne Glacier, Gunn Glacier, Tasman and Murchison Glacier
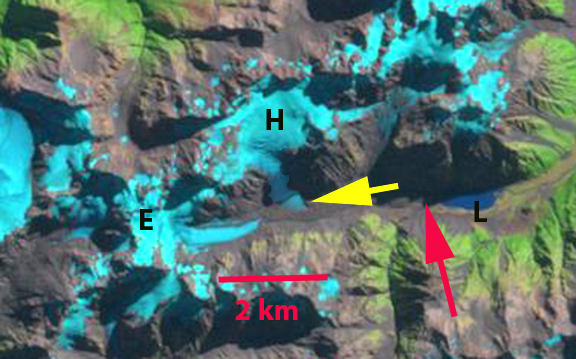
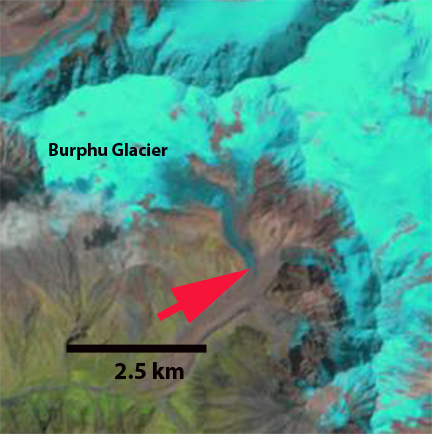
2000 Landsat image
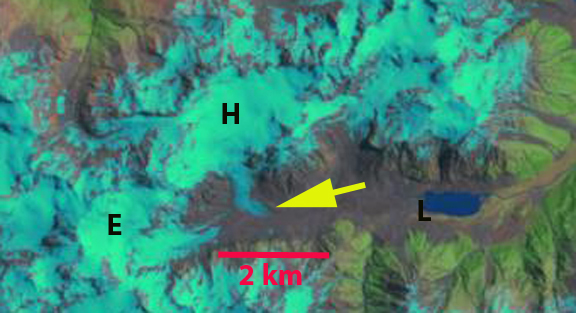
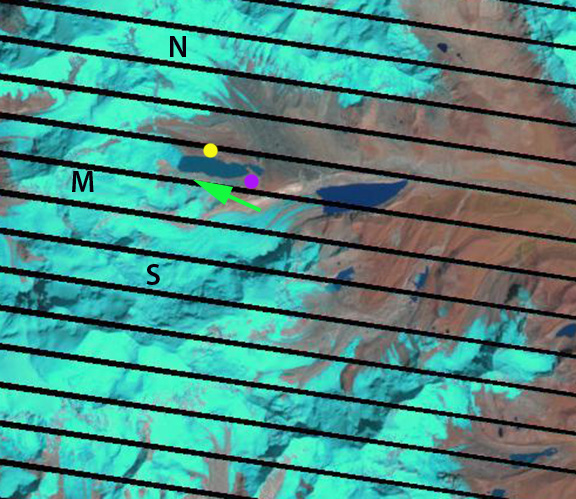
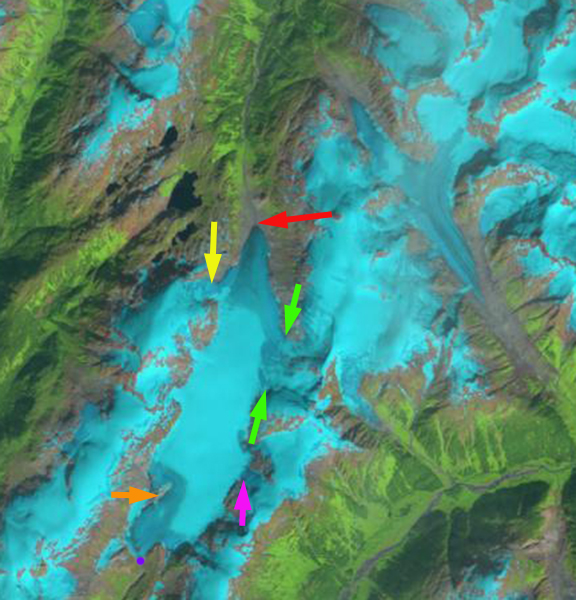
2001 Landsat image

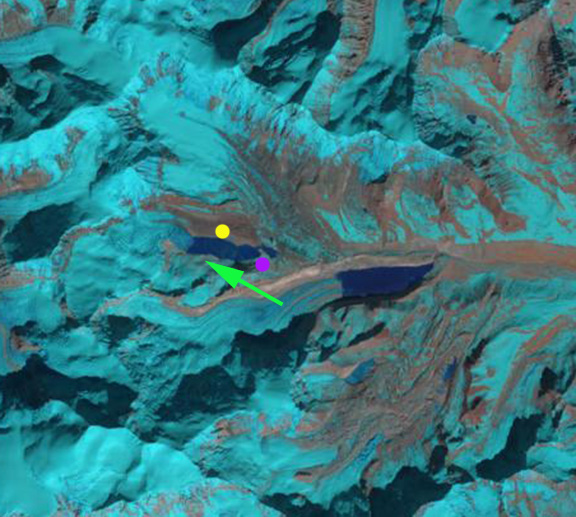
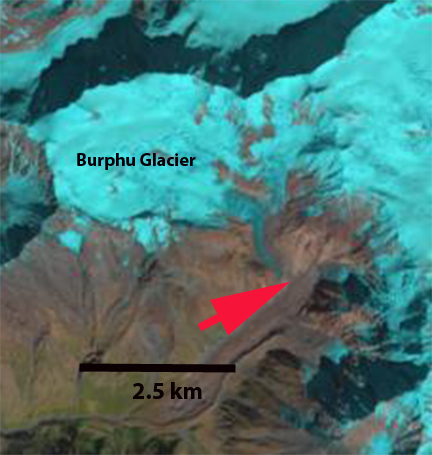
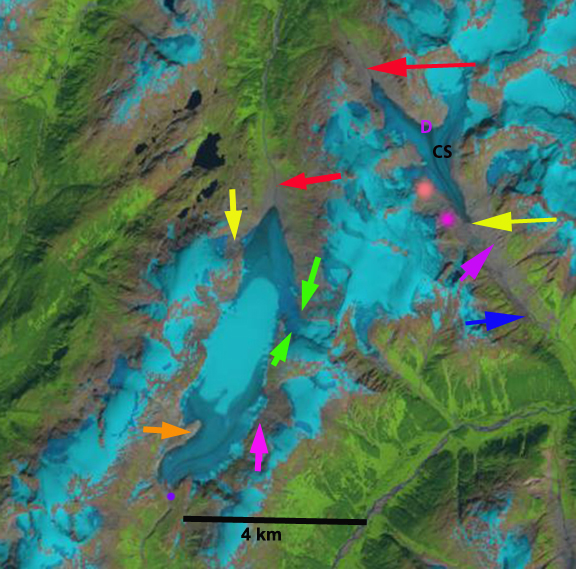
2013 Landsat image
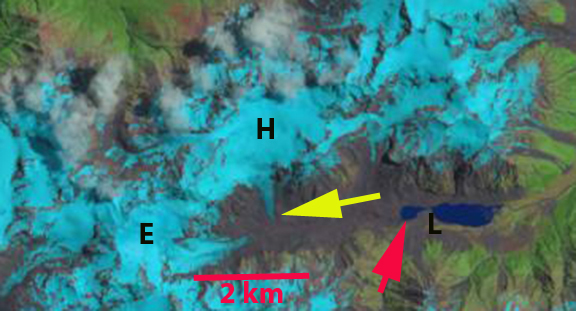
Landsat image 2013

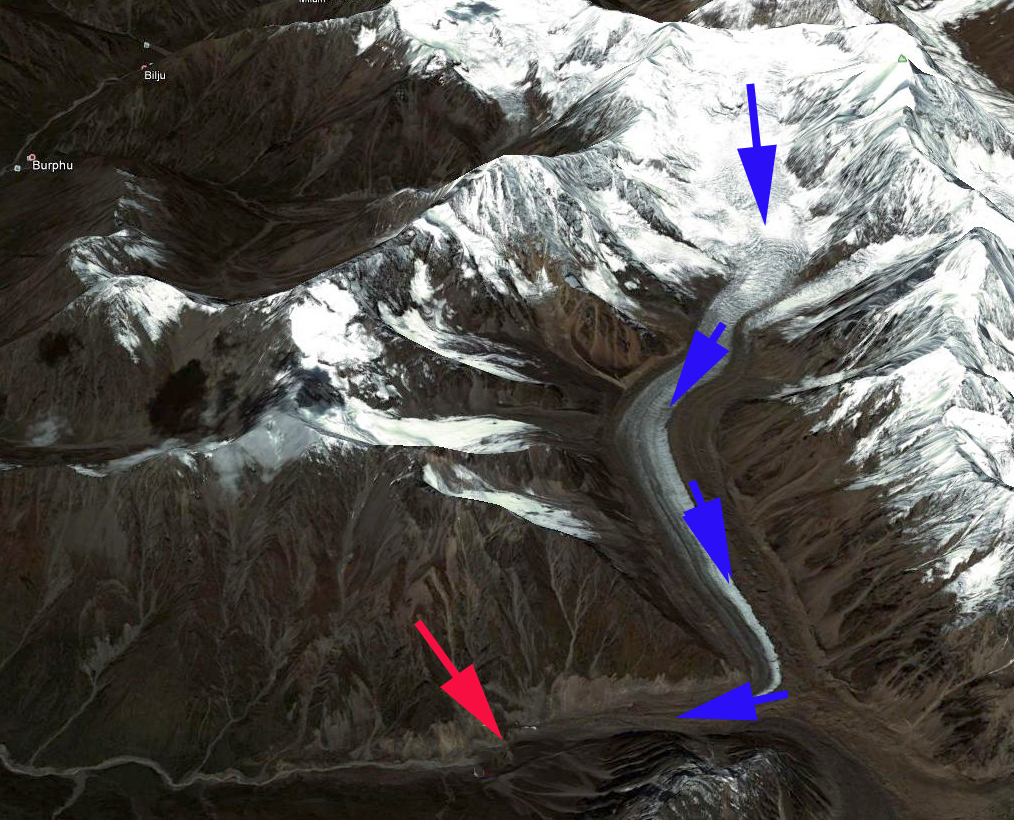
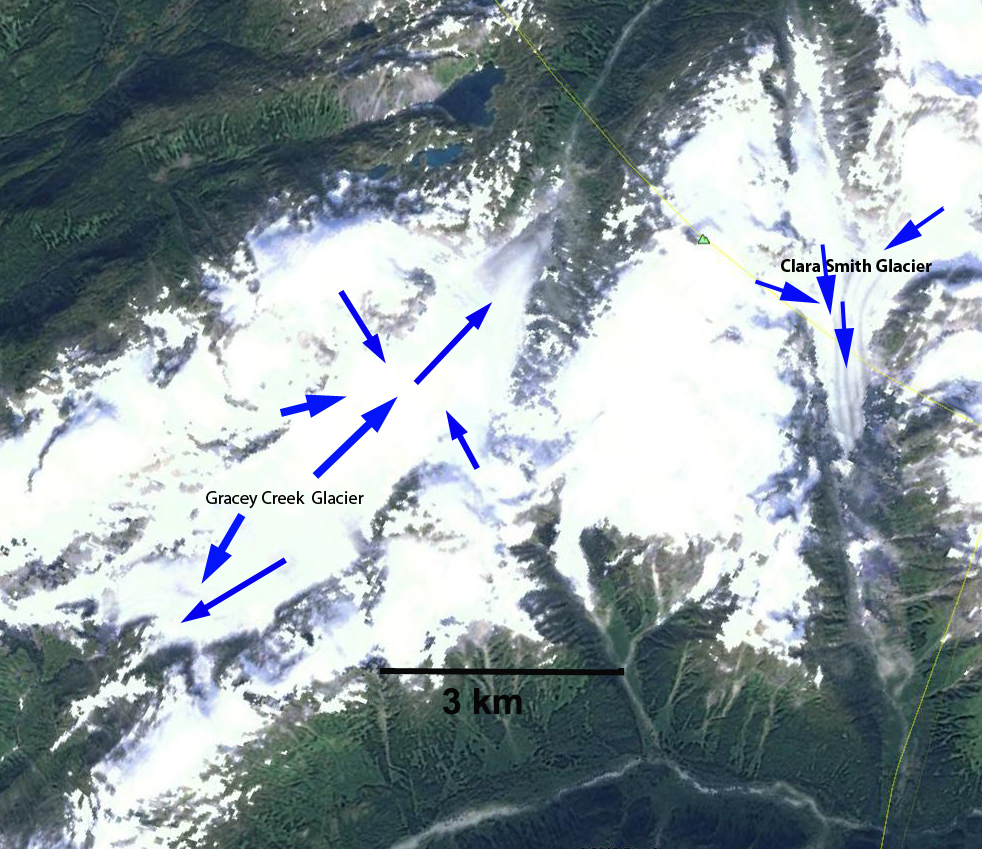
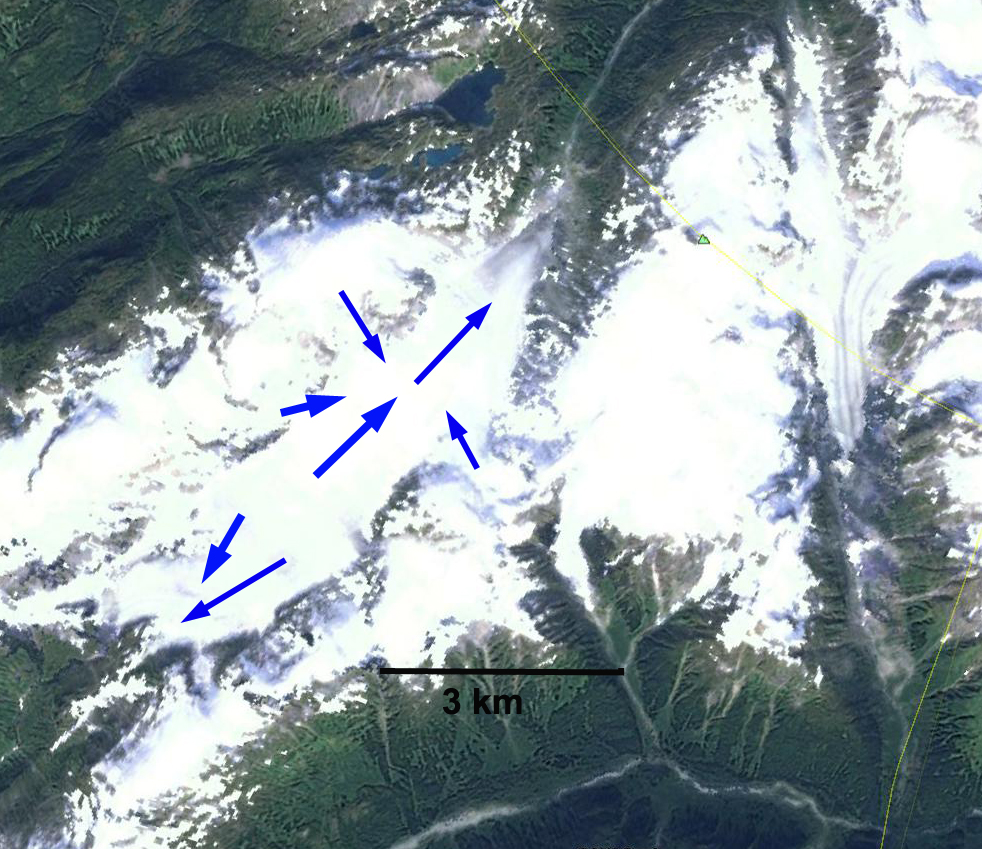
Google Earth image
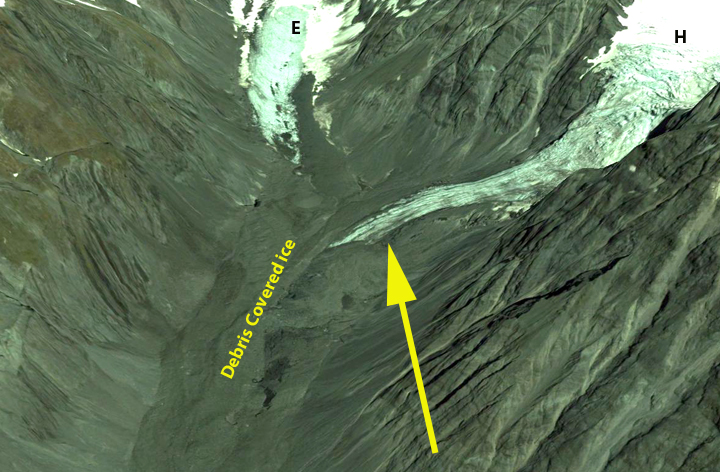
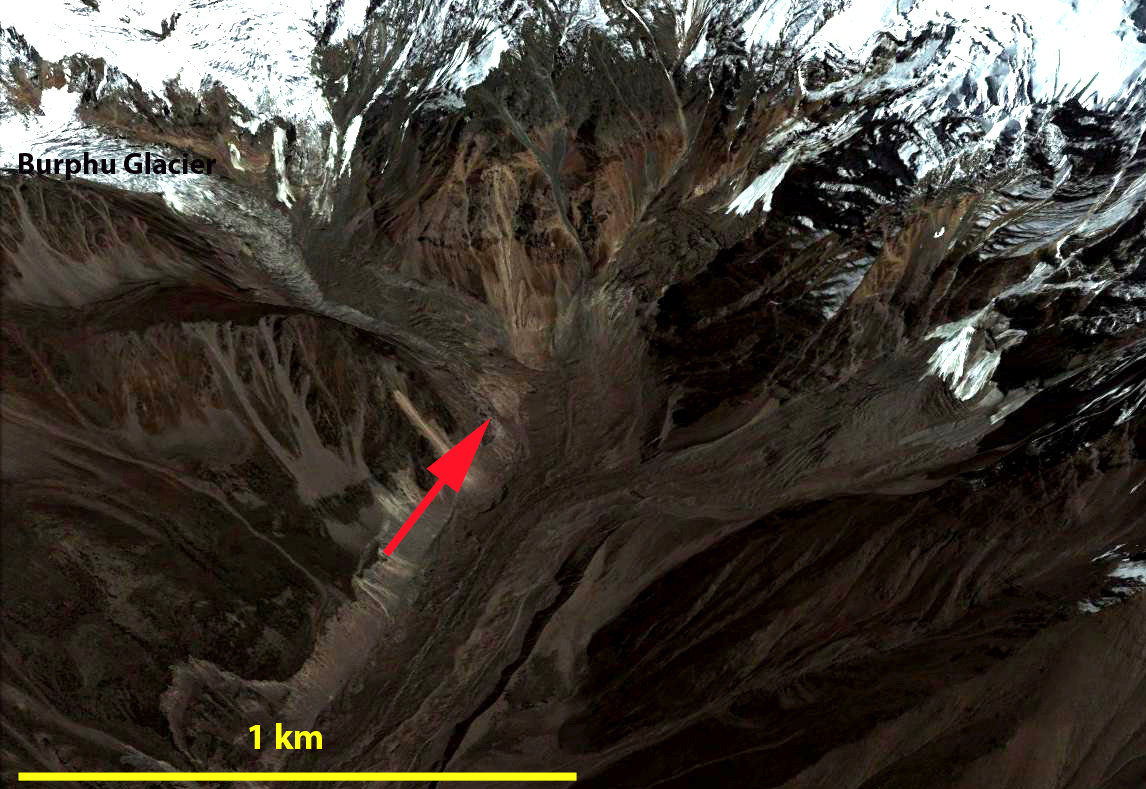
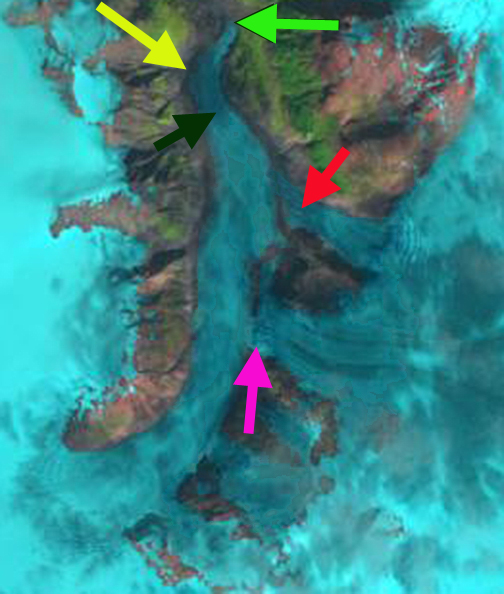
Google earth image of terminus