North Dawes Glacier Retreat, Alaska

North Dawes Glacier reached the Endicott Arm as a calving glacier when visited by John Muir in the 1880’s. By 1923 the glacier had retreated a half kilometer and was no longer tidewater. The American Geographical Society under the leadership of William O. Field observed the glacier several times from 1941 to 1961 observing a retreat of 1.8 km from 1923-1961. Here we examine the retreat of the North Dawes Glacier from 1990-2013 and observe some disquieting signs on upper portions of the glacier. The first image is a 1929 image from William Cooper an ecologist from the Univ. of Minnesota of the glacier in 1929 when it was still near Endicott Arm. The second is from Google Earth with the blue arrows indicate the flow direction for the glacier, the lighter blue arrows tributaries that no longer reach the main glacier. northdawes1929North Dawes glacier ge. When I first saw the North Dawes Glacier in 1982 from a plane a small lake had formed at the terminus. In the 1990 Landsat image the glacier ended in a lake that is 1.2 km long, yellow arrow. By 2005 the glacier had retreated another 1.3 km and the lake was long 2.5 km, red arrow. In 2013 the glacier has retreated out of the lake, pink arrow and terminates at a small new developing lake orange arrow. The lake is 2.8 km long, but will likely become shorter as glacier sediments infill the upstream end. There are some stagnant ice cored moraine areas between the 2013 terminus and the lake. The terminus retreated 3.1 km between 1990 and 2013. north dawes Glacier 1990
1990 Landsat image
north dawes glacier 2005
2005 Landsat image
north dawes glacier 2013
2008 Landsat image

The retreat of the terminus of North Dawes Glacier is the result of diminished accumulation higher on the glacier and increased melt. Two indicators of the impact on the upper glacier is the separation of one of the former tributaries, black arrow, from 1990 to 2013. A second is the tributary higher up on the glacier that was formerly a snowcovered basin feeding the main glacier, green arrow. In 2005 and 2013 it is evident that this basin is no longer a location where snowpack is retained. The result is thinning and exposure of new areas of bedrock, indicating the demise of this tributary even though it is 7 km above the terminus. The basin is mainly at 950-1100 m which is now below the end of the summer snowline (ELA) most years. This glacier is retreating at approximately the same rate as nearby Sawyer Glacier, but is losing a greater percentage of its total area and length. North Dawes is also retreating much more than nearby Baird Glacier.

Baird Glacier Retreat Initiation, Alaska

Baird Glacier drains the west side of the Stikine Icefield in southeast Alaska. It is the only glacier of the Stikine Iceifield that has not retreated significantly since 1960. This is similar to the Juneau Icefield where only the Taku Glacier has not retreated. From 1887 to 1941, the advance totaled about 1 km and from 1941-1980 it advance another kilometer. The terminus had not changed from 1980-2010. In 1984 I had a closeup look at the terminus, it was heavily debris covered and lacked crevassing. This indicated a limited velocity, yet the ice was clearly quite thick, and it would take considerable melting to initiate retreat. In this post we examine Landsat images from 1990, 2005 and 2013 to see how the terminus is responding to climate change. The blue arrows indicate the glacier flow in the Barid Glacier System. Just above the terminus the main Barid Glacier is joined by the North Baird Glacier. About 15 km upglacier of the terminus are two glaciers Witches Cauldron (WC) to the south and Oasis to the north that the Baird Glacier is flowing into instead of being fed by them. This has been the case for sometime. The purple arrows indicate the 2013 snowline near the end of the melt season is at 1300 m. This is high and will lead to a negative mass balance and volume loss for the glacier in 2013.baird glacier ge copybaird glacier landsat8 In 1990 the Baird Glacier is sitting on an outwash plain, with no lake at the terminus. The North Baird Glacier was 1100 meters wide at the yellow arrow, just before joining the Baird Glacier . The main Baird Glacier is 1350 m wide at the pink arrow. By 2005 the North Baird Glacier is 900 m wide at the yellow arrow, and the Baird Glacier 1200 m wide at the pink arrow. The terminus appears unchanged in 2005. By 2013 the North Baird Glacier is just 700 m wide at its junction at the yellow arrow and the Baird Glacier just 1100 m wide at the pink arrow. The narrowing of both indicates less ice flow to the terminus, which will lead to retreat. In 2013 two lakes have appeared at the terminus, red arrow. The terminus has begun a measurable retreat, the lakes are 400-600 m across indicating. There will be a continued expansion of these two lakes and a significiant retreat of the main terminus will ensue. This will lead to the separation of the North Baird and Baird Glacier. Upglacier in the Witches Cauldron a series of supraglacial lakes have begun to form as well. Larsen et al (2007) using repeat laser altimetry note that North Baird Glacier in its lowest 10 km from the junction with Baird Glacier was losing 2 m per year in ice thickness. From 2000-2009 the thinning rate is even higher, with Baird Glacier main trunk losing 10-20 m in thckness in the lowest 20 km Larsen et al (2009). Baird Glacier is joining the rest of the Stikine Icefield is already in retreat, Sawyer Glacier, Patterson Glacier and Great Glacier.
barid glacier 1990

baird glacier 2005

baird 2013

witches cauldron

Toby Glacier Retreat, Purcell Range, British Columbia

Toby Glacier is in the Purcell Mountains of southern British Columbia, part of the Purcell Wilderness Conservancy Park. Here we examine retreat of this glacier from 1998 to 2014 using Landsat imagery and Google Earth images. The map image indicates the Little Ice Age advance moraine (LIA_on other imagers) at 1960 m, a lower lake (LL)at 2060 m, an upper lake (UL) at 2280 m, the former ELA at a slope change at 2500 m and the recent ELA at 2600-2650 m, all images are oriented with north at the bottom. toby map In the 1998 Landsat image the glacier terminates at the yellow arrow 250 m from the Upper Lake. The snowline in 1998 is at 2650 m and only 25% of the glacier is snowcovered. By 2005 in the Google Earth view from 2005 the glacier terminates 450 m from the Upper Lake. In 2013 the glacier terminates 800 m from the Upper Lake, pink arrow. Yellow arrow marks 1988 terminus for comparison. The snowline is again at 2650 m in 2013 with a month left in the melt season, no more than 20% of the glacier will be snowcovered by the end of the summer. In 2014 on Aug. 18th the snowline is between 2600 and 2650 m with six weeks left in the melt season, purple dots. By the end of the summer little will remain snowcovered. The terminus has retreated additionally from 2013 but not an amount that can be assessed accurately. Typically 60% snowcover is necessary for glacier equilibrium. The result of the substantial negative mass balance that result from the high snowlines and small accumulation zone will be continued retreat. There are significant bedrock areas emerging in the upper portion of the glacier indicating a lack of a persistent accumulation zone indicative of a glacier that cannot survive (Pelto, 2010). A glacier lacking a consistent accumulation zone is experiencing a disequilibrium response to climate and cannot retreat to a point of equilibrium. This is exemplified best in an image from Wildair Photography-image 36. The glacier retreat is like that of Vowell Glacier and Conrad Icefield in the nearby Bugaboos. TOBY GLACIER 1998
1998 Landsat image
TOBY GLACIER 2013
2013 Landsat image
toby glacier 2014
2014 Landsat image
toby glacier tiltview
2005 Google Earth view

toby glacier ge
2005 Google Earth view

Brúarjökull Retreat, Iceland

Brúarjökull is a major, 1600 square kilometers outlet glacier on the northeast side of the Vatnjokull Ice Cap in Iceland. Brúarjökull is a surging glacier that has surged n 1810, 1984 and 1964. During a surge a glaciers basal water pressure increases leading to reduced basal friction, a sharp velocity increase and terminus advance. Surges do not typically reflect climate change. In recent years Brúarjökull has been retreating at about 100 m/year. The glacier advanced 8-10 km during the 1964 surge. In this case an additional factor has been added, with the completion of a dam and the filling of the Hálslón Reservoir in 2007 that is now in contact with the terminus of Brúarjökull. Kárahnjúkar hydro power plant is Europe’s largest dam and a $2 billion project that produces 690 MW of power. Unfortunately with the dam now in operation it has not proved profitable for the Landsvirkjun, Iceland’s national energy company. In 2013 the surface level of the Hálslón Reservoir reached 625 meters above sea level at the end of August which is the spillway elevation.
The Brúarjökull Project has examined the glacier terminus and newly exposed landscape by retreat in recent years. The terminus they observe is quite stagnant. The elevation range of Brúarjökull is 600–1750 m a.s.l. with an equilibrium line altitude of 1200 m and accumulation area ratio AAR of 60%. The mass balance of Brúarjökull measured since 1994 and has been consistently negative, losing 10 m of ice thickness overall, with greater much greater thinning near the terminus. Here we examine Landsat images from 1999, 2008, 2012 and 2013 and Google Earth imagery from 2005 and 2009. The contorted medial moraines, red arrows are indicative of a surging glacier. The purple arrows indicate the snowline which leaves much too large an area of glacier in the ablation zone for equilibrium balances. In 2013 the ELA in late August is 1300 m, it will rise a bit more which will mean a negative mass balance of at least 1 m. bruar 2013
Landsat 2013 image
The terminus in each image is indicated by yellow dots with Points A-E being consistently located for comparison. The first image is a Landsat image from 1999, the Hálslón Reservoir does not exist. The distance from Point B to the ice front is 1 km, from Point C 1.75 km and Point D is 0.75 km upglacier of the ice front to the immediate west. By 2005 Google Earth image the Hálslón Reservoir is still not present. By 2008 the terminus has retreated with Point B now 1.5 km from the ice front, Point C 3.5 km and Point D at the ice front to the immediate west. The reservoir exists and frontage in the reservoir 1.75 km. This is better illustrated in the 2009 Google Earth image of the immediate ice front in Hálslón Reservoir. Numerous small icebergs are seen, read arrows. By 2013 the Landsat image indicates the glacier front is 2.5 km from Point B, 5.25 km from Point C and 0.75 km from Point D. The retreat from 1999-2013 is then 1.5 km at Point B, 3.5 km at Point C and 1.5 km at Point D. In 2013 the glacier frontage in the lake has decreased to 1.5 km, and will quickly diminish to where calving is not longer occurring. This retreat is similar to that of draining the Tungnaarjökull west side of Vatnajokulland Skeiðarárjökull Glacier on the south side bruar2012 terminus
Landsat 1999 image
bruar ge 2005
Google Earth 2005 image
bruar 2008b
Landsat 20008 image
bruar 2009
Google Earth 2009 image
bruar 2013 terminus
Landsat 2013 image

Kintla Glacier Retreat, Glacier National Park, Montana

There continues to be a persistent misperciption that all glaciers in Glacier National Park, Montana will be gone by 2030, I get asked that by journalists frequently, and when I point out that is not the case, they are surprised. The number of glaciers has declined from 150 to less than 30 today, and most of those are doing poorly, however, there are a few that are retreating relatively slowly and not on the verge of disappearing. This week brings another examples from National Geographic. This post focusses on why this is not going to occur using Kintla Glacier as an example. Kintla Glacier is 8 km south of the border with Canada on the north slope of Kintla Peak and drains into Medicine Bow Creek and then Kintla Lake. All of the images from Google Earth and Landsat are oriented with south at the top. kintla areaKintla Glacier is noted by Key et al (2002) and by continuing USGS reseearch to have had an area of 1.7 km in 1966 and 1.15 km2 in 2005. This is the loss of nearly a third in 40 years. Here we examine changes from 1990 to 2013 using three Google Earth images and a Landsat image from 2013 to indicate the changes in the glacier during the last two decades. The margin of the glacier in the sequential Google Earth images from 1990 (red), 2003 (orange) and 2007 (yellow) indicate the limited retreat in this period. Retreat averages 30-40 m with a glacier length averaging 500 m. The width of the glacier changed even less. Hence, this glacier has lost 5-10% of its area from 1990 to 2007. n 1990 Jon Scurlock has some exceptional images of the glacier taken in 2009 and posted Glaciers of the American West. These images indicate a glacier that has less than ideal snowcover, but significant crevassing near the main terminus and insignificant retreat from 2007. In 2013 Landsat imagery from August indicates no major retreat. Thus, this glacier is thinning and retreating, but is not poised despite its small size to disappear by 2030. kintla 1990

kintla 2003

kintla 2007

Kintla 2013

A key indicator of a glacier that will not survive current climate for long, is retreat of the upper margin and appearance of bedrock outcrops on the upper glacier (Pelto, 2010), neither is apparent here. A indicates a cliff below the main terminus, and is a good measure of the lack of retreat from this point. Point B is the end of a buttress that has not changed significantly during the 1990-2007 period indicating a lack of change in the upper portion of the glacier. The last image is a picture of the glacier from 2007 indicating a glacier that is not about to disappear in the next twenty years. This glacier will survive beyond 2030 just as Harrison Glacier will. Other glaciers in this park that continues to lose glaciers are not going to survive as long, such as Grinnell Glacier or Sperry Glacier. All of the glaciers in the region are responding to recent climate change, but not at the same rate. Further warming will certainly eliminate all of them.

Kintla Glacier 2007a

Conrad Icefield Retreat, Selkirk Mountains, British Columbia

Conrad Icefield is at the northern edge of the Bugaboos in the Purcell Range of the Selkirk Mountains in southwest British Columbia. The icefield feeds several terminus tongues primarily the Conrad Glacier and Malloy Glacier, both of these have two arms. In the case of Conrad Glacier the two arms still join above the terminus, while for Malloy Glacier there are now separate termini. conrad icefield map
British Columbia Topographic Map of the Conrad Icefield area

Here we examine the terminus changes of these from 1998 to 2013 using Landsat images from 1998 and 2013 and Google Earth images from 2005. The pink arrow for Malloy Glacier and yellow arrow for Conrad Glacier are in fixed locations on each image. In the 1998 image and map above the west terminus of the Malloy Glacier, pink arrow, reaches to the shores of an unnamed lake at the head of Malloy Creek, the south terminus ends just short of the lake. Conrad Glacier extends past the yellow arrow to end at what is the beginning of a proglacial lake in 1998 that is not in evidence on the map. By 2005 in the Google Earth image the west terminus of Malloy Glacier has retreated a short distance from the lake shore and the southern terminus has retreated 150 m from the lake. Conrad Glacier has retreated upvalley of the yellow arrow. A closeup view of the Malloy Glacier terminus, red arrows, from 2005 indicates that the southern terminus is quite stagnant below the icefall and retreat is continuing. The west terminus is quite narrow and ending on a steep slope, with a buttress paralleling the north side of the terminus ending at the orange arrow. The Conrad Glacier terminus is stagnant beyond the knob at Point A, and is only 200 meters wide from Point A to Point B. The proglacial lake beyond the Conrad Glacier terminus is now 400 m long and the terminus has just retreated upvalley of the lake. In 2013 Malloy Glacier western terminus is at the top of the buttress, orange arrow ending 250 m from the lake, pink arrow. The southern terminus has pulled back 250-300 m from the lake. Malloy Glacier has undergone a 250 m retreat from 1998-2013. Conrad Glacier has retreated a significant distance from the proglacial lake, and now ends on a line between the knob at Point A and B. The proglacial lake has filled in at its upstream end a small amount, hence the distance from the downstream end of the proglacial lake to Point A is a better measure of the retreat from 1998 to 2013. This distance is 700 m, however the retreat is between 600 and 700 m as the lake had begun to form in 1998. Another measure is the distance from where the two arms of Conrad Glacier join to the terminus. The upglacier joining has experienced little change. This distance is in 1.7 km 1998 and just under 1 km in 2013, also indicative of close to 700 m of retreat in 15 years.conrad icefield 1998
1998 Landsat image of Conrad Icefield
conrad icefield ge
2005 Google Earth image of Conrad Icefield
conrad icefield east terminus 2005
2005 Google Earth image of Malloy Glacier terminus
conrad icefield main terminus 2005
2005 Google Earth image of Conrad Glacier terminus
conrad icefield 2013
2013 Landsat image of the Conrad Icefield

Examination of the margins of both glaciers above the icefalls 1 km above the terminus in 2005 indicates thinning and downwasting, red arrows, suggesting reduced flow that will drive continued retreat. The distance to the lake of the Malloy Glacier west terminus is seen in an image from Gery Unterasinger, Vertical Unlimited mountain guide. He also has a nice image showing the stagnant nature of the southern terminus below the icefall, both images are from 2010. These glaciers are retreating faster than Bugaboo Glacier, but not as fast as Vowell Glacier also in the Bugaboos. The retreat observed in the southern interior ranges of British Columbia, has been 15% from 1985 to 2005 (Bolch, 2010). malloy glacier margin

conrad glacier marginmalloy terminus

malloy west

Vowell Glacier Rapid Retreat, Bugaboos British Columbia

Vowell Glacier is the largest glacier of the Bugaboo’s or maybe was. The glacier drains to the north into Vowell Creek has retreated quite rapidly from 1998 to 2013 creating a new lake and then retreating from that lake. Here we use a sequence of Landsat and Google Earth images to identify the changes from 1998 to 2013. In 1998 Landsat imagery shows the glacier to be 5.5 km long ending at 2060 m with no sign of a lake, this is also the size of the glacier in the BC 20,000 scale topographic map. vowell glacier overview
Vowell Glacier Google earth image from 2005 Pink line map-1998 terminus, green line 2005 terminus, yellow line 2012 terminus.
bugaboo map
Topographic map of Vowell Glacier

vowell glacier 1998 ls
Landsat image from 1998

The pink arrow in each image indicates the 1998 terminus and the yellow arrow the 2013 terminus. By 2005 Google earth imagery indicates a 800 m retreat from the map position and the formation of a proglacial lake with numerous icebergs and residual glacier pieces. The lower 500 m of the glacier is stagnant, uncrevassed and thin at this point. By 2012 Google Earth imagery indicates the glacier has retreated from the lake and is now 1500 m from the mapped position. The 2013 Landsat indicates a terminus retreat in 15 years of 1550 m. vowell glacier map overlay
Mapped extent of glacier overlain in Google Earth

vowell glacier 2005
2005 extent in Google Earth image

vowell map overlay
2012 extent in Google Earth image

vowell glacier terminus 2005
Close up of terminus in 2005

A wonderful image from Canadian Mountain Holidays Heli Ski Guide Lyle Grisedale shows the glacier in 2013. The yellow arrows indicate the current terminus, the burgundy arrows lateral moraines, red arrows glacier peices in the lake and the magenta arrow a detached portion of ice cored moraine.The glacier is flowing with some vigor through the icefall that extends from 2400 m to 2200 m. The lower 400 m of the glacier still appears stagnant and poised for retreat. Worse is the fact that the August 22nd image from 2013, with a month of melting to go, shows the snowline at 2600 m. The snowline will likely rise 200 m by the end of summer leaving only 25% of the glacier snowcovered. A glacier such as the Vowell would need about 60% snowcover to have an equilibrium mass balance for the year. This glacier is retreating more rapidly than the more famously named adjacent Bugaboo Glacier. CMH Bugaboos: Aug 25, 2013

North Cascade Glacier Climate Project 2013 Field Report

The 2013 winter season provided close to average snowpack in the North Cascades as indicated by the average SWE at SNOtel stations in the range. The summer melt season has proved to be long, warm and dry. The May-August mean temperature at the station closest to a glacier, Lyman Lake, has been tied for the 2nd warmest in the last 25 years with 2009 and only 2004 warmer. The summer has lacked record periods of warmth and has featured sustained warm temperatures and higher than average humidity, reducing the number of nights when the glacier surface has frozen. The average minimum temperatures at Lyman Lake are the highest in the last 25 years for July and August. The humidity was the strikingly high during our field season, note diagram from a Cliff Mass article on the topic. The net result will be significant negative glacier mass balances in the North Cascades. There is one month left in the melt season most glaciers are close to an equilibrium balance already.

The field team included Stewart Willis and Matt Holland, Western Washington University, Jill Pelto, U of Maine, Ben Pelto, UMass,-Amherst, Jezra Beaulieu and Oliver Grah, Nooksack Indian Tribe research scientists And Tom Hammond, North Cascade Conservation Council. Alan Kearney, Photographer worked with us for the first week capturing time lapse imagery of our work.

After a month of perfect summer weather we arrived to a foggy and wet conditions on the Columbia Glacier. The Columbia Glacier terminus was exposed and has retreated 85 m since 1990. The glacier had a substantial area of blue beginning 200 m above the terminus and extending along the western side of the basin for 400 m. The area of blue ice on August 1 was 50,000 square meters, by Aug. 21 the area had expanded to 200,000 square meters, the shift of the 2013 winter snowline during this period indicates a melt of m during the three weeks.


The Lower Curtis Glacier terminus was exposed early in the summer resulting in a continued retreat of 20 m since 2011, the area of thick seraced terminus lost since 1990 has been 60,000 square meters. The lateral retreat and terminus retreat since 1990 are both in the 125-150 meter range depending on location.
We spent a week observing ablation and resulting glacier runoff on Sholes Glacier. With Oliver Grah and Jezra Beaulieu who work for the water resources section of the Nooksack Indian Tribe we emplaced a stream gage right below Sholes Glacier and one on Bagley Creek which is snowmelt dominated. With the water level gages in we all began work on a rating curve for the Sholes Glacier site directly measuring discharge on 14 occasions, kayak socks helped reduce the impact of cold water. Average ablation during the week was 8.25 cm/day of snowpack or 5 cm of water, discharge measurements identified a mean of 5.2 cm/day of from the glacier during this period. The agreement between ablation and discharge was a nice result. Discharge became notably more turbid after 1 pm, peaking in turbidity around 5 pm. Of equal interest was the change in snowcovered area. On July 19th a Landsat image indicated 100% snowcover for Sholes Glacier. On Aug. 4th our surface measurements indicates a blue ice area of 12,500 square meters, which is also evident in a Landsat image from that day. By Aug. 20th a satellite image indicates that the blue ice area had expanded to an area of square meters. This coincided with the area where snowdepth was observed to be less than 1.2 m on Aug.4. This represents a volume loss of 592,000 cubic meters of water in 16 days.
We measured the mass balance on Rainbow and Sholes Glacier during this period. The snowpack was poor on both, especially above 1900 meters on Rainbow Glacier. Typical depths are over 5-6 m, this year 3.75-4.5 m. The poor snow depths were also noted on the Easton Glacier above 2000 m in crevasse stratigraphy measurements. Each crevasse is approached probing to ensure it is safe and then assessed to make sure the crevasse is vertically walled, this enables a safe but also accurate measure. In some cases layers from mulitple years can be assessed. IN the Lynch Glacier crevasse the 2013 layer will be lost to melt before end of the summer. Easton Glacier had a terminus that was fully exposed by the start of August. The terminus slope has thinned markedly in the last three years as retreat has continued. The retreat of Easton Glacier has averaged 10 m/year from 2009-2013. This year the retreat will exceed that with two months of exposure. The Deming Glacier retreat has been exceptional over the last 12 months with at least 30 m of retreat. The snowline on Easton Glacier was at 1850 m on Aug. 10th. By the end of August the snowline had risen to 1980 m, where snow depths had been 1.5 m three weeks previous. The mass balance of Sholes, Rainbow and Easton Glacier will all be close to – 1 meters water equivalent, that is losing a slice of glacier 1.1-1.2 m thick. Mount Daniels had the best snowpack of any location in the North Cascades. On the small and dying Ice Worm Glacier ablation and runoff were assessed simultaneously. The expansion of the area where 2013 has all melted expanded rapidly from 8/13 to 8/21. The glaciers lower section had is often avalanche buried, this year the snowpack was gone on much of the lower section. However, snowpack averaged 1.7 m across the entire glacier on August 14th. With daily ablation of 7-8 cm/day this will be gone by early September. This will lead to a substantial negative mass balance this year. Lynch and Daniels Glacier both had limited exposed blue ice and firn, and snowpack values that were slightly above average. Both glaciers will have small negative mass balances this year. On Lynch Glacier a large crevasse at exposed the retained snowpack of the last three years, from 2010-2012 5 m of firn remains. ice worm 2013

ice worm 821upelto team
Ben in his 9th year, Jill her 5th year and Mauri 30th year of glacier work in the North Cascades

Storstrømmen Susceptible to Rapid Retreat

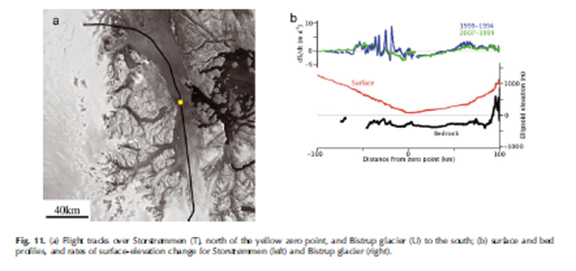
Storstrømmen and L. Bistrup Brae are large outlet glaciers in northeast Greenland that join at their terminus. This joined terminus area is referred to as Bredabrae, though here I refer to the glaciers individually. The calving front is long and has numerous island pinning points. There is a large relatively flat low lying terminus region. The glacier differs from the Zacharaie Isstrom and 79 Glacier in that it currently has quite a low velocity. Storstrømmen surged between 1978 and 1984 (Reeh et al, 1994). The glacier advanced and both terminus regions thickened. Thomas et al. (2009) provide a figure based on a flight over this 60 km long 15-25 km wide low lying, low slope, slow flowing ice plain. The bed of the glacier is 300-400 m below sea level. Joughin et al. (2010) observed the stagnation of the lower portion of this glacier. They further note that the lower 40 km of the Storstrømmen is still slowing and thinning, while further from the ice front the glacier is thickening. Joughin et al. (2010) identify the same drop in speed to near zero near the stagnant front of L. Bistrup Bræ. This thinning and slow down near the terminus and thickening upglacier is typical of a surge glacier.
storstrommen ge

storstrommen-Thomas etal2009
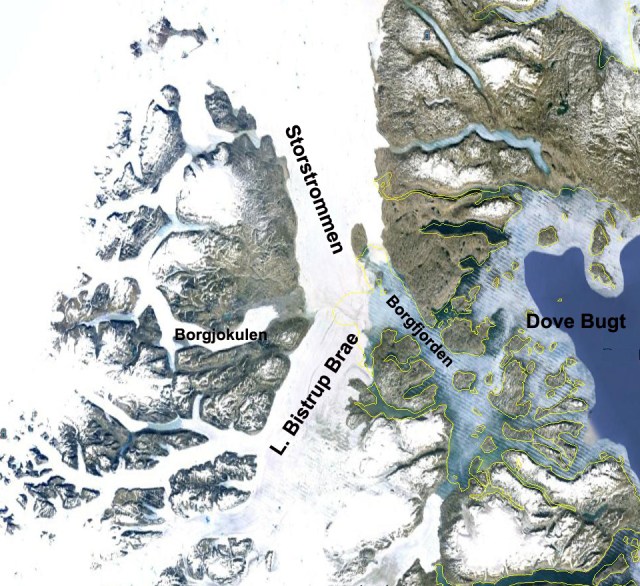
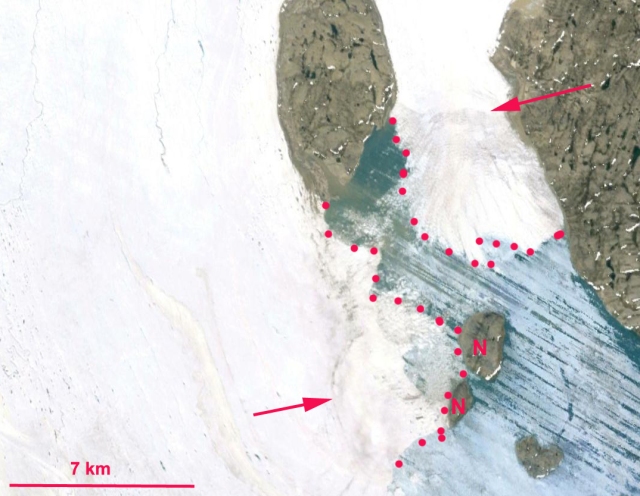
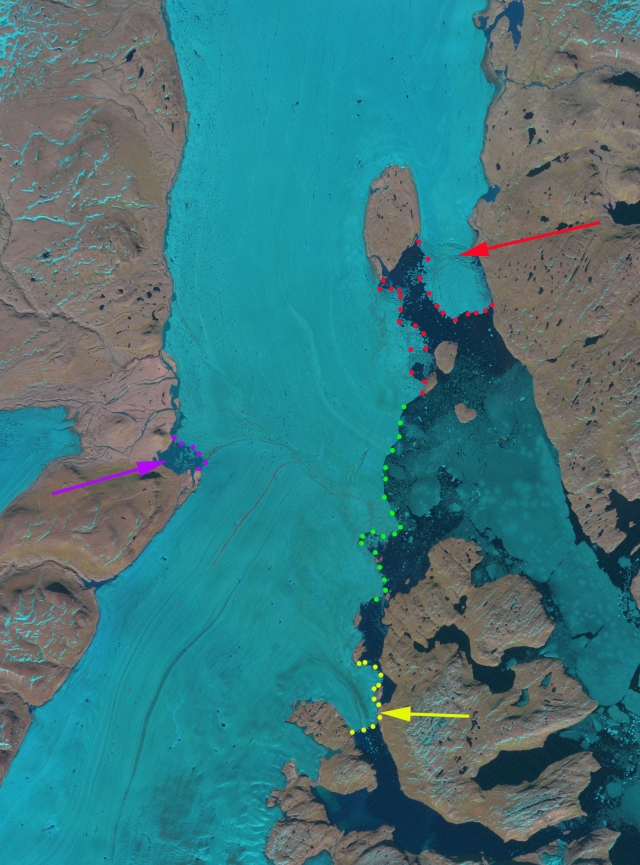
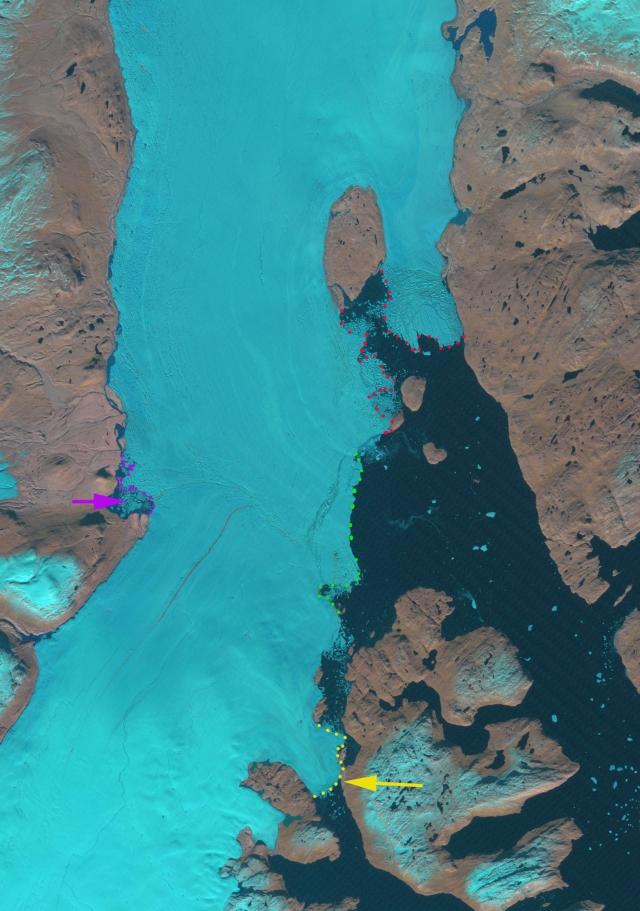
The question posed here is how vulnerable is this ice plain, given the recent years of high melting? Espen Olsen has been examining some potential cracks that could be indicators of weakening ice. Here we examine Landsat images from 2002, 2006, 2009, 2012 and 2013 to identify changes. In addition recent Google Earth images are used. In each image the yellow dots and arrow indicate the terminus of L. Bistrup Brae and its main pinning point. The red dots indicate the terminus of Storstrømmen. The green dots the main calving front that extends across both glaciers. The purple arrows and dots indicate a proglacial lake, Randsøen, on the inland side (western) of the ice plain near where the two glacier meet.

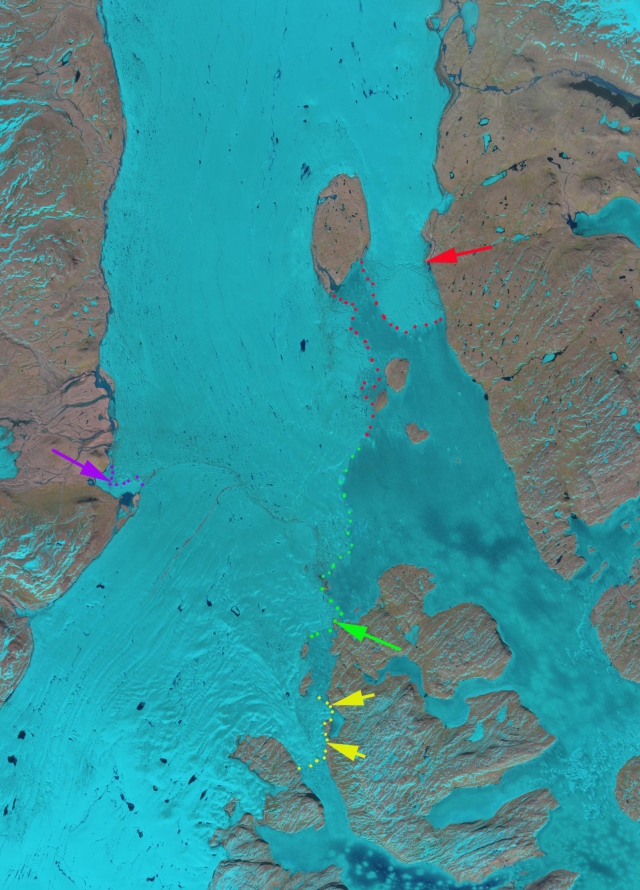
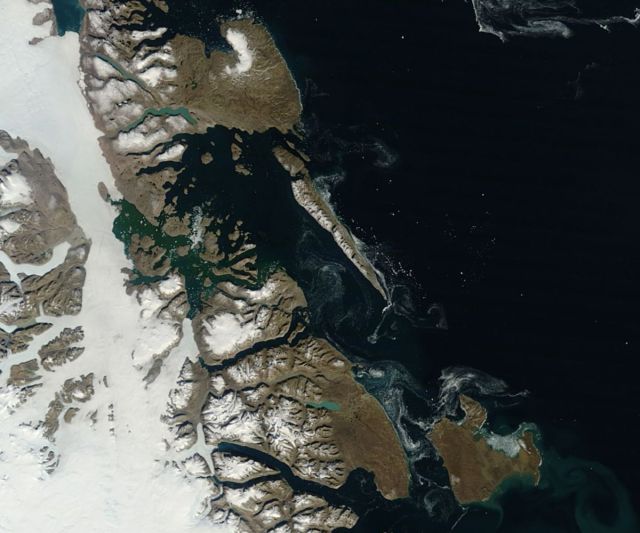
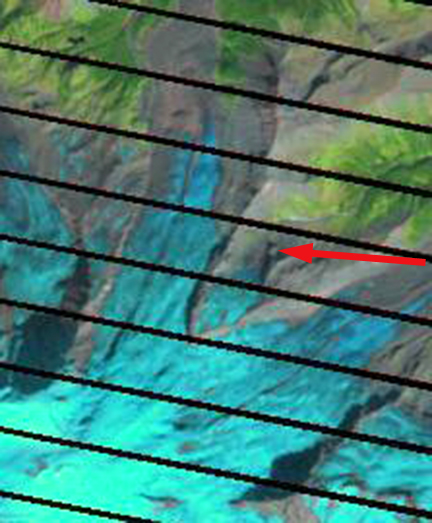
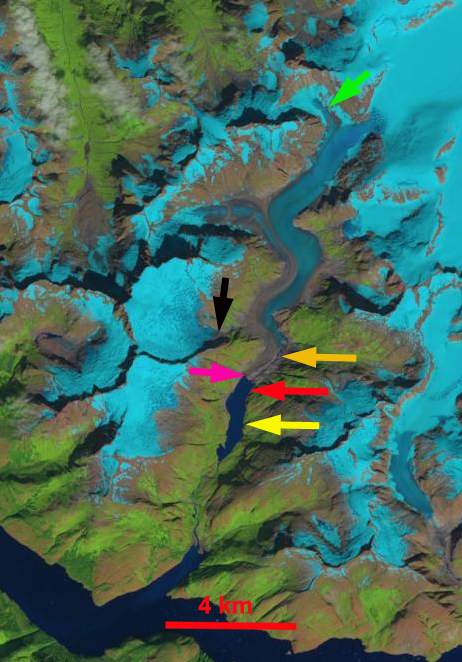
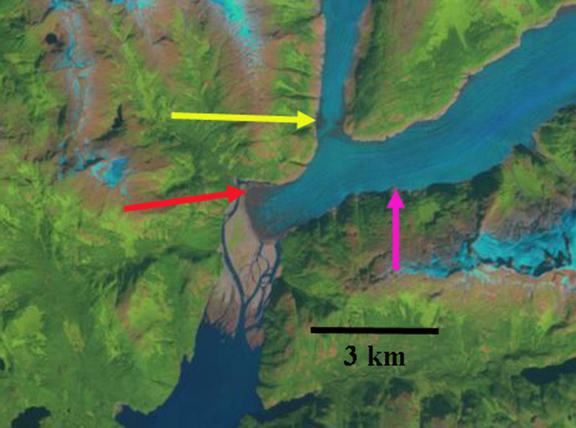
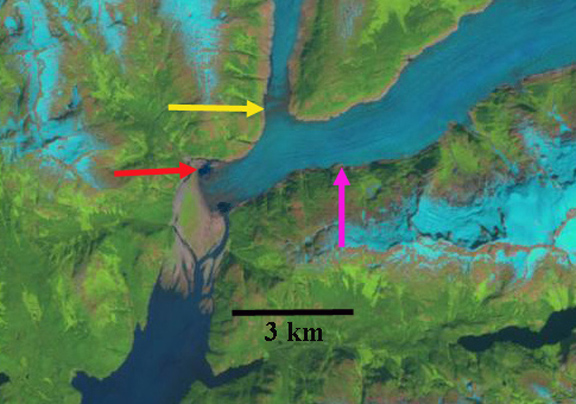
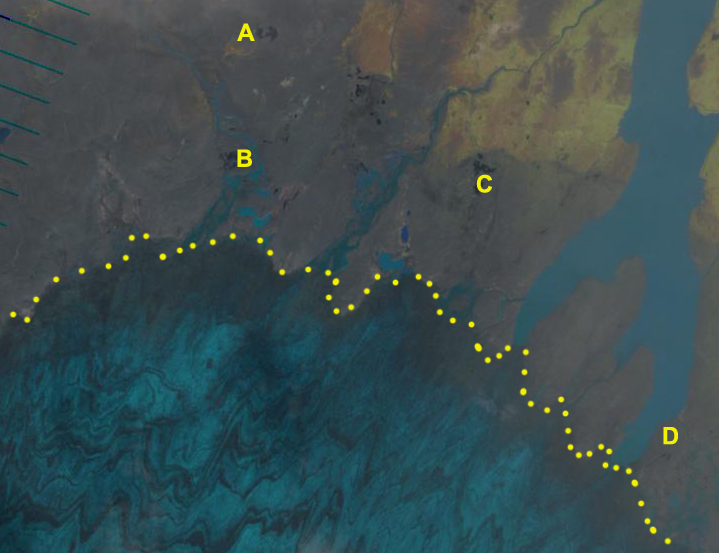
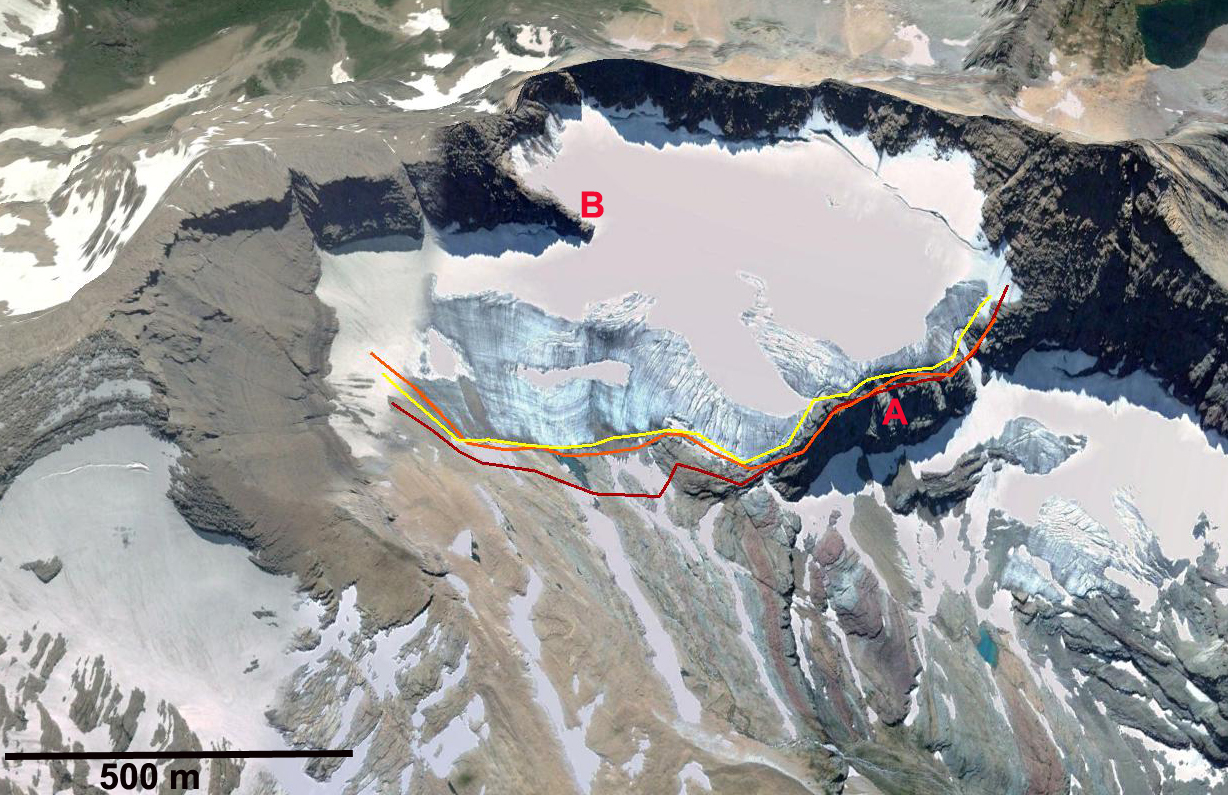
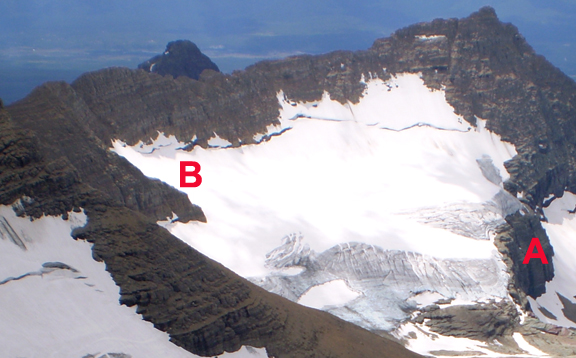
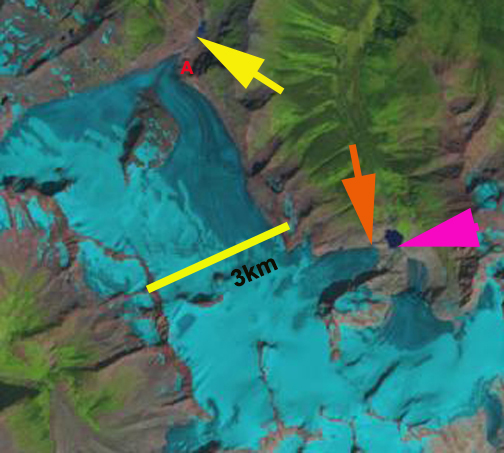
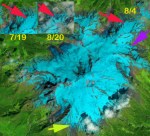
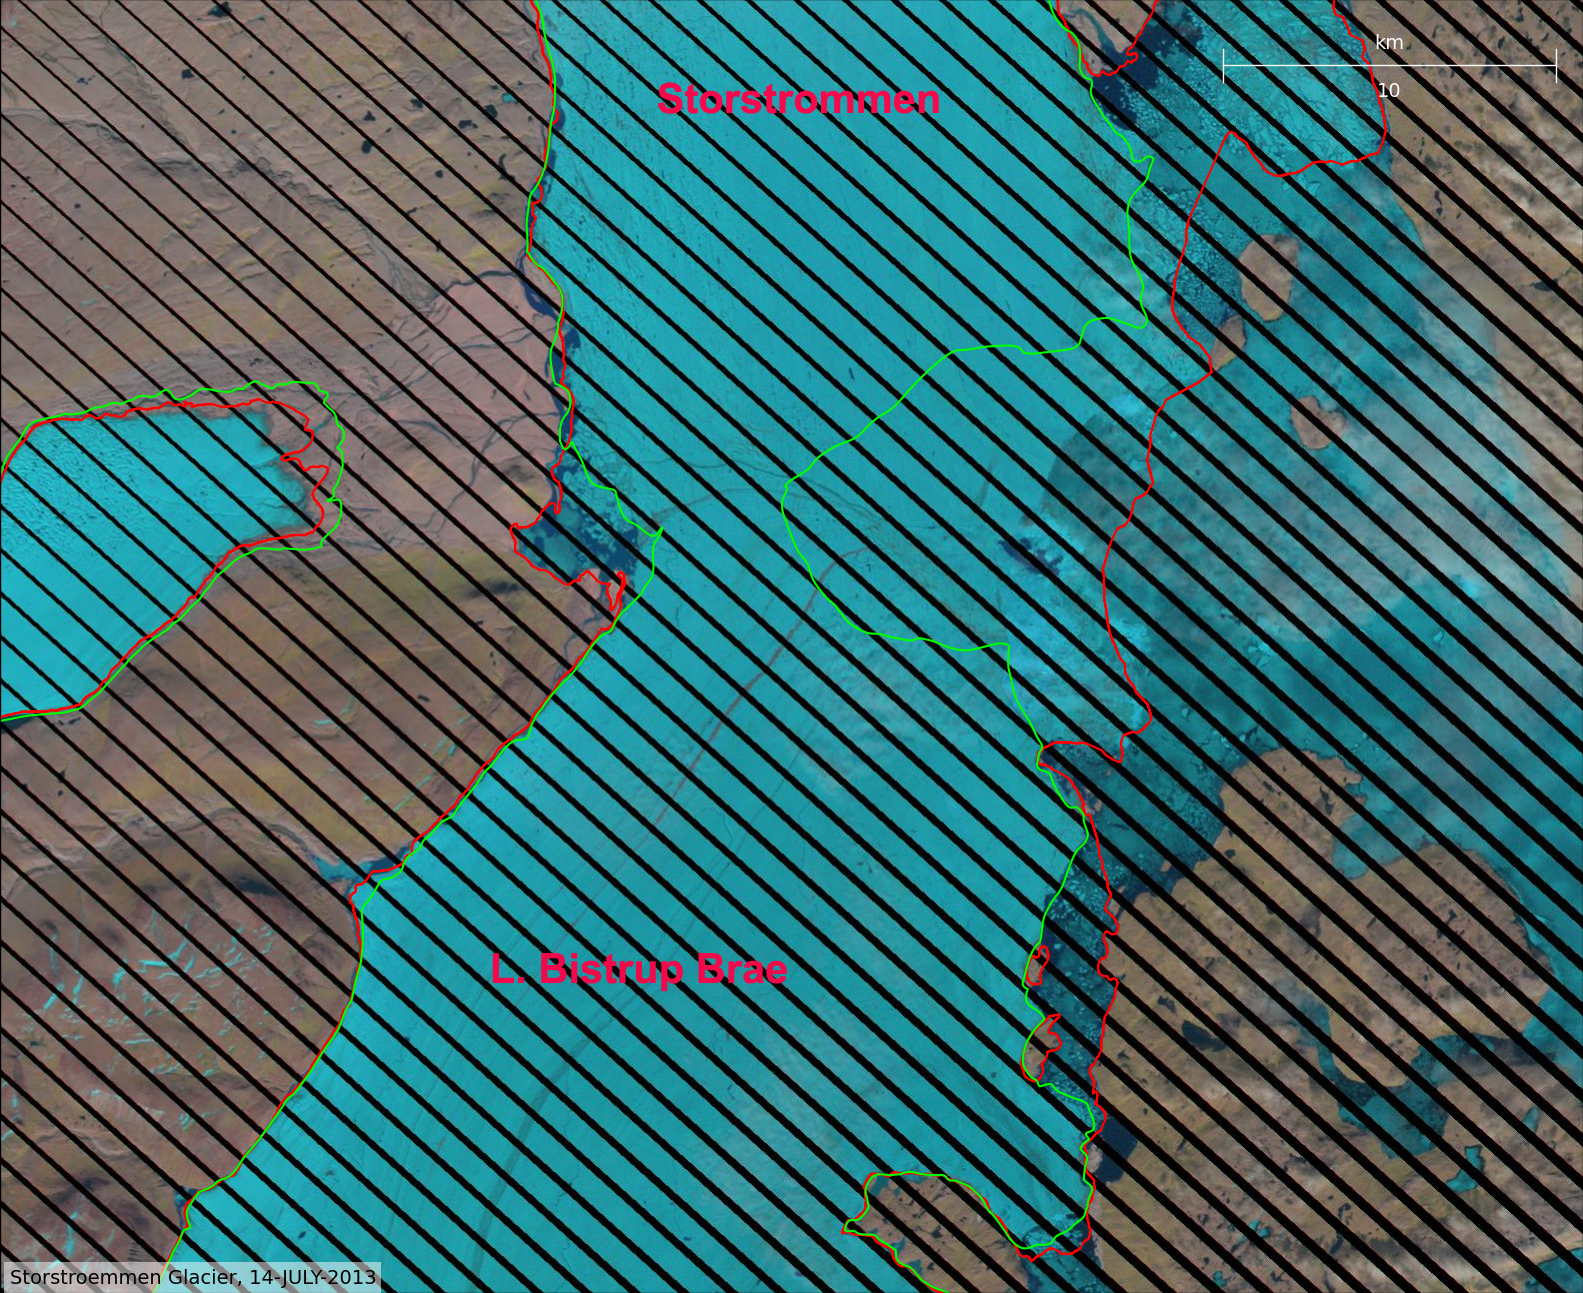
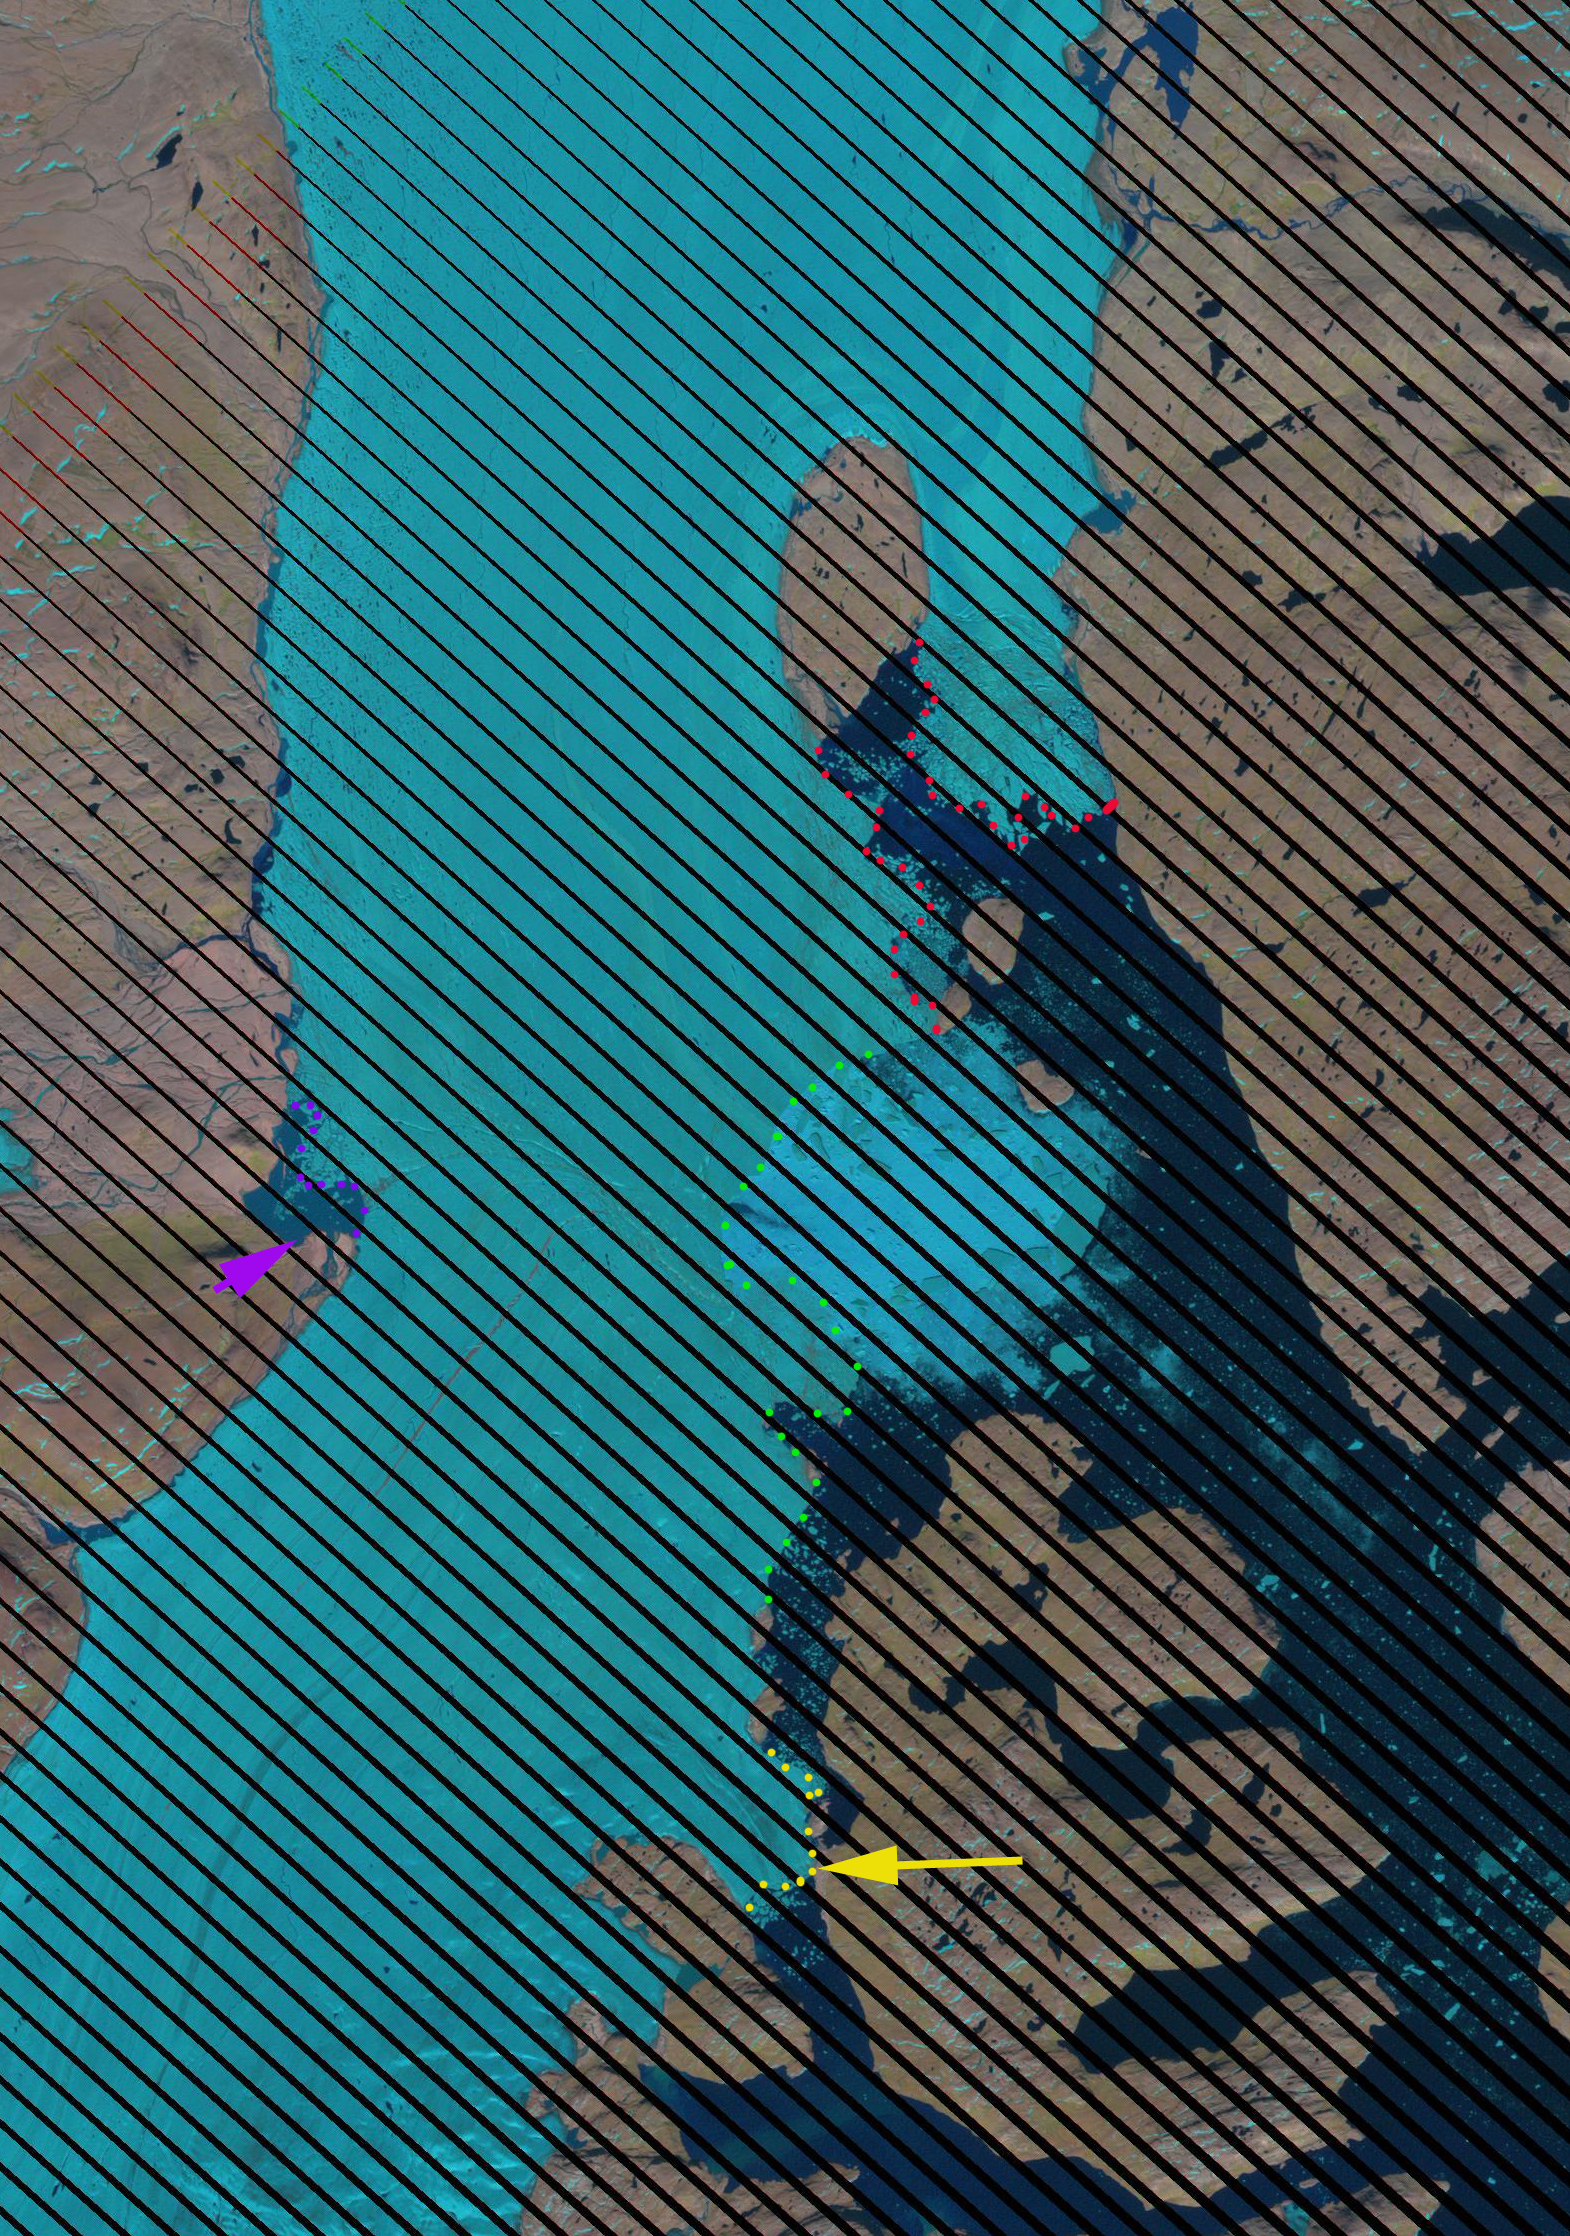
The first image below is from the Polar Portal indicating the terminus of the glacier in the mid-1980’s green and 2000 red on a 2013 Landsat image. The advance from the surge, post 1980’s image, is evident particularly in the main calving front between pinning point islands. The next two images are from 2002 and 2013. Terminus change is limited in the red dot region of Storstrommen. The red arrow indicates a rift on the eastern arm of Storstrommen that has remained in the same place for the last decade. The melange of ice in front of the rift has lost some area, but is largely intact, the stability indicates the lack of glacier velocity, but also suggests a limited water flux in the fjord here and limited melting. The L. Bistrup Brae margin, yellow dots, has retreated from one of the two key pinning points, yellow arrows. The main retreat is in the green dot section where the main advance had occurred, here the front has gone from convex in 2002, to concave in 2013 with 4 km of retreat. At the southern edge of the green dot section the glacier has pulled back from a island pinning point leaving an open water passage 1.6 km wide, green arrow. Another change is the expansion of the lake Randsøen at the western margin of the glacier downstream of the outlet streams from Borgjokulen, purple dots and arrow.

storstrommen portal

storstrommen 2002a

storstrommen 2013a

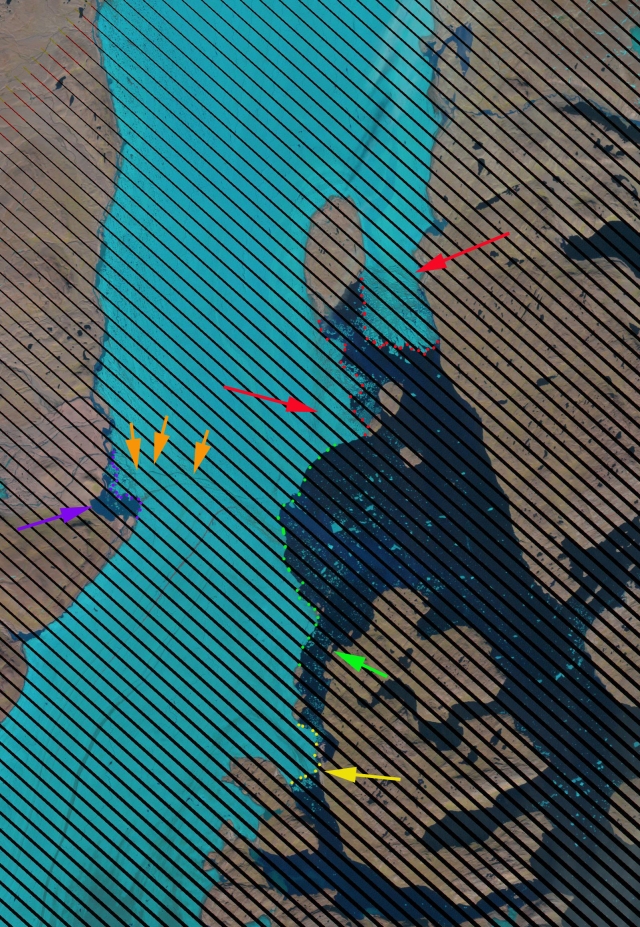
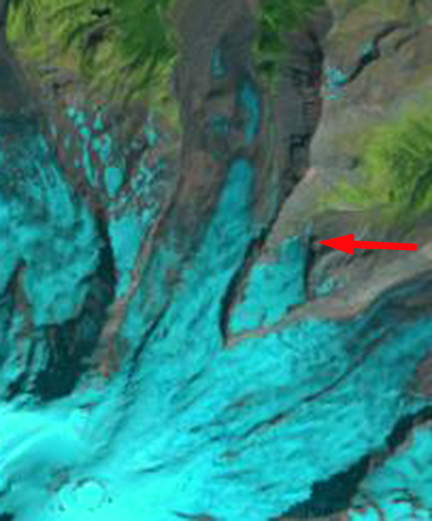
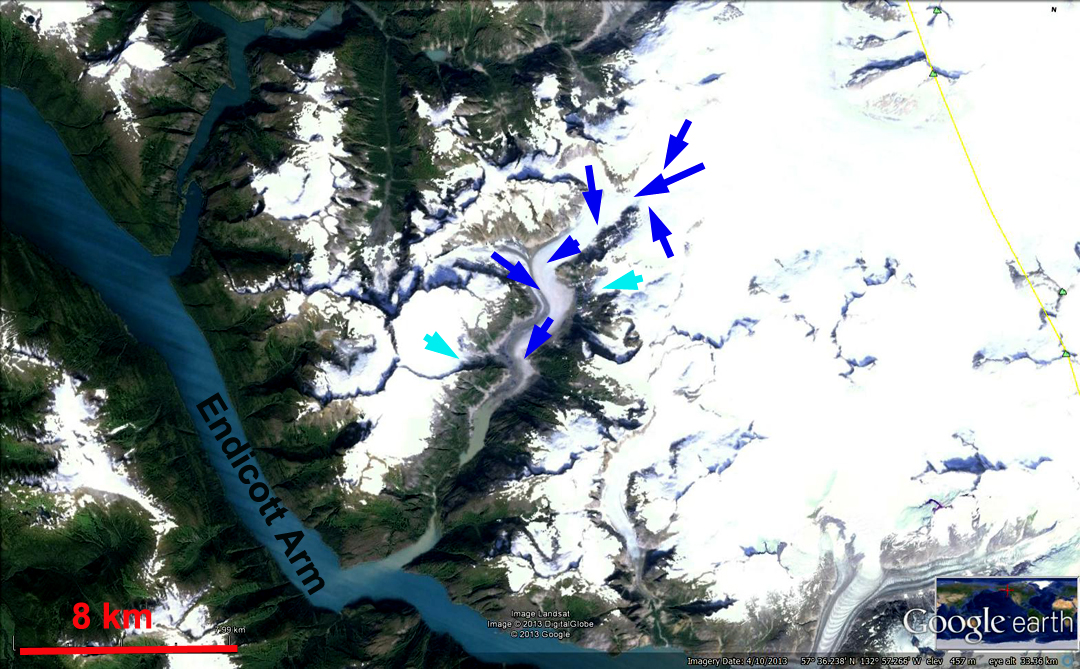
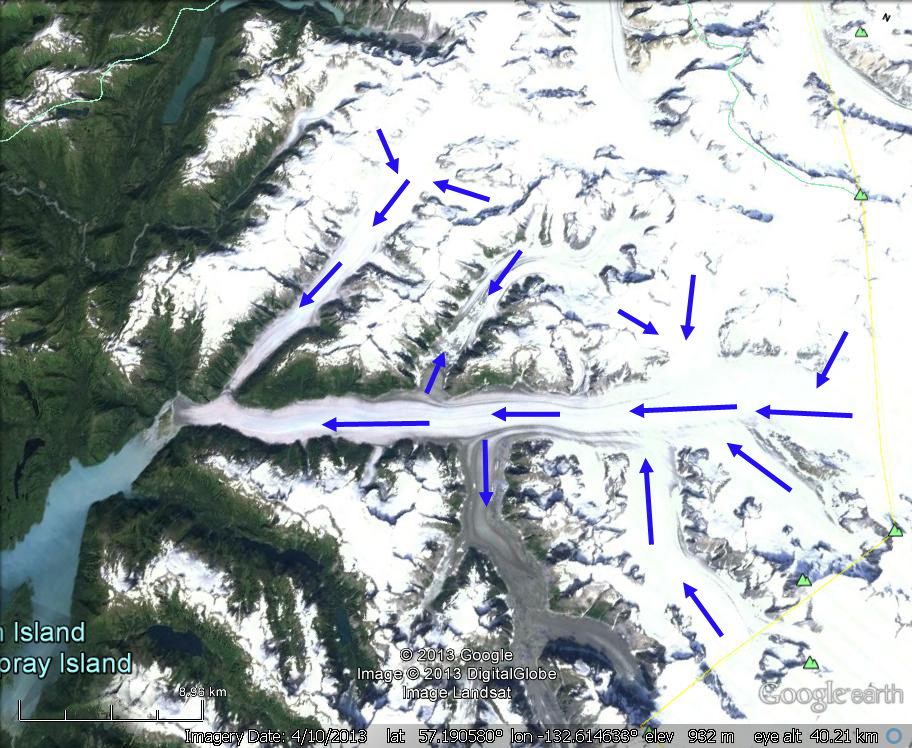
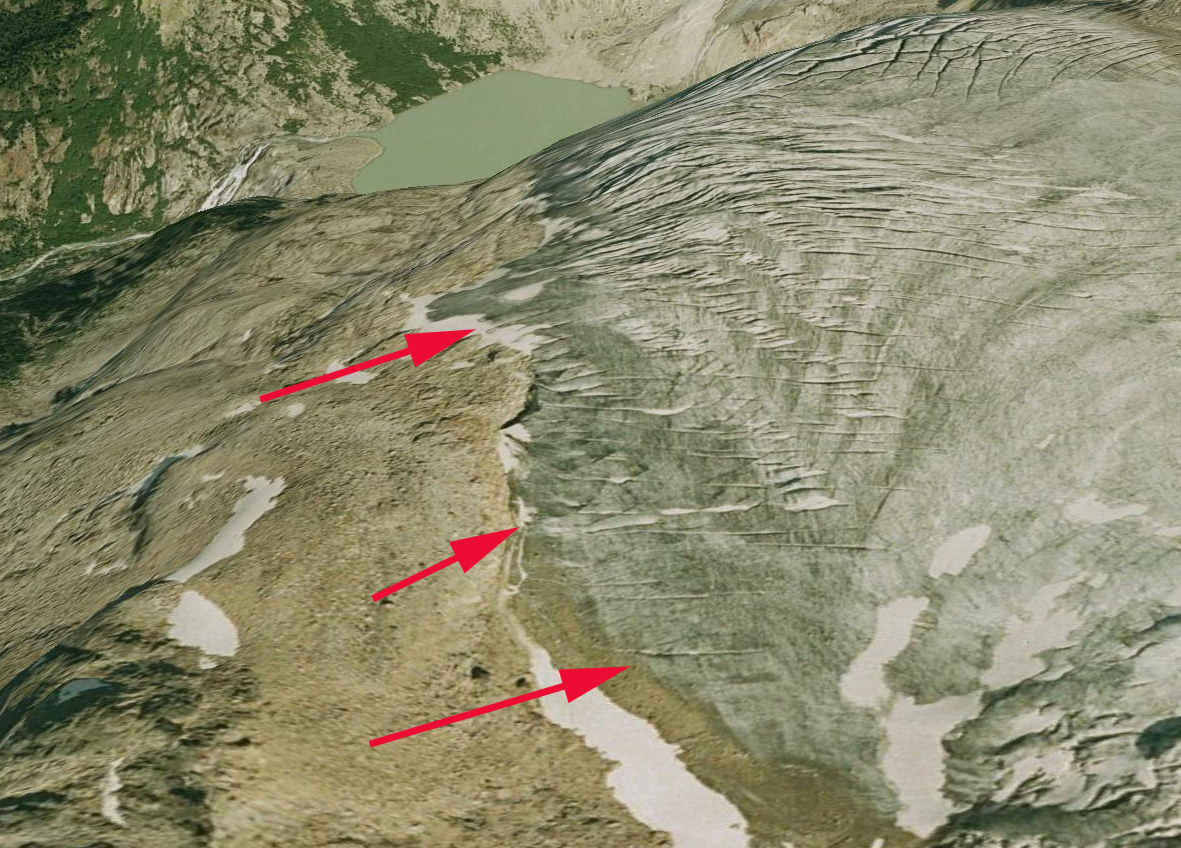
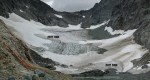
A closer look at various locations from Google Earth provides more detail, the image indicates it is from 4/10/2013 which is incorrect, however, it is quite recent. The first is the calving margin of Storstrommen, the two red arrows indicate substantial persistent rifts, with ice melanges beyond the rifts. Both the rifts and melanges have been pretty stable over the last decade. The area of coastline exposed in the midst of the margin along the south coast of the island has expanded slightly.

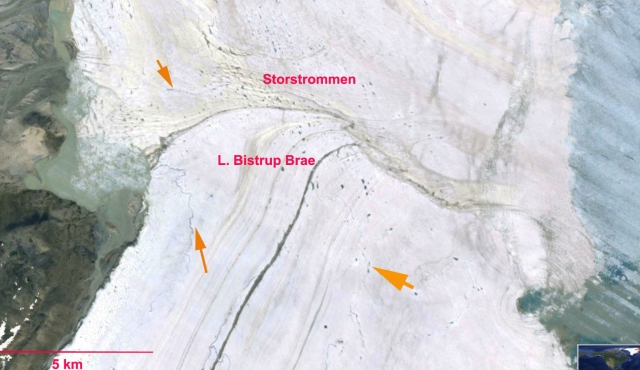
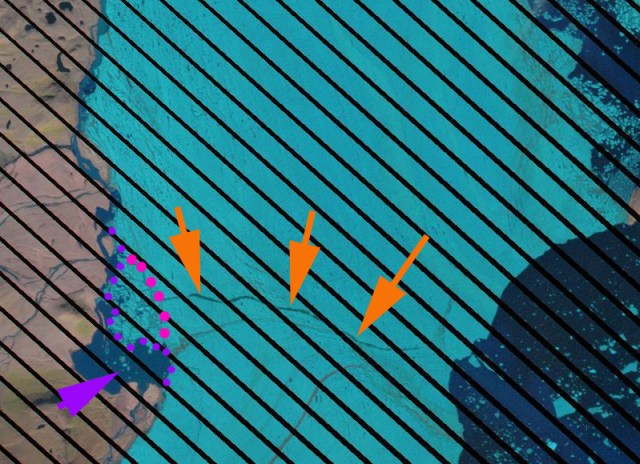
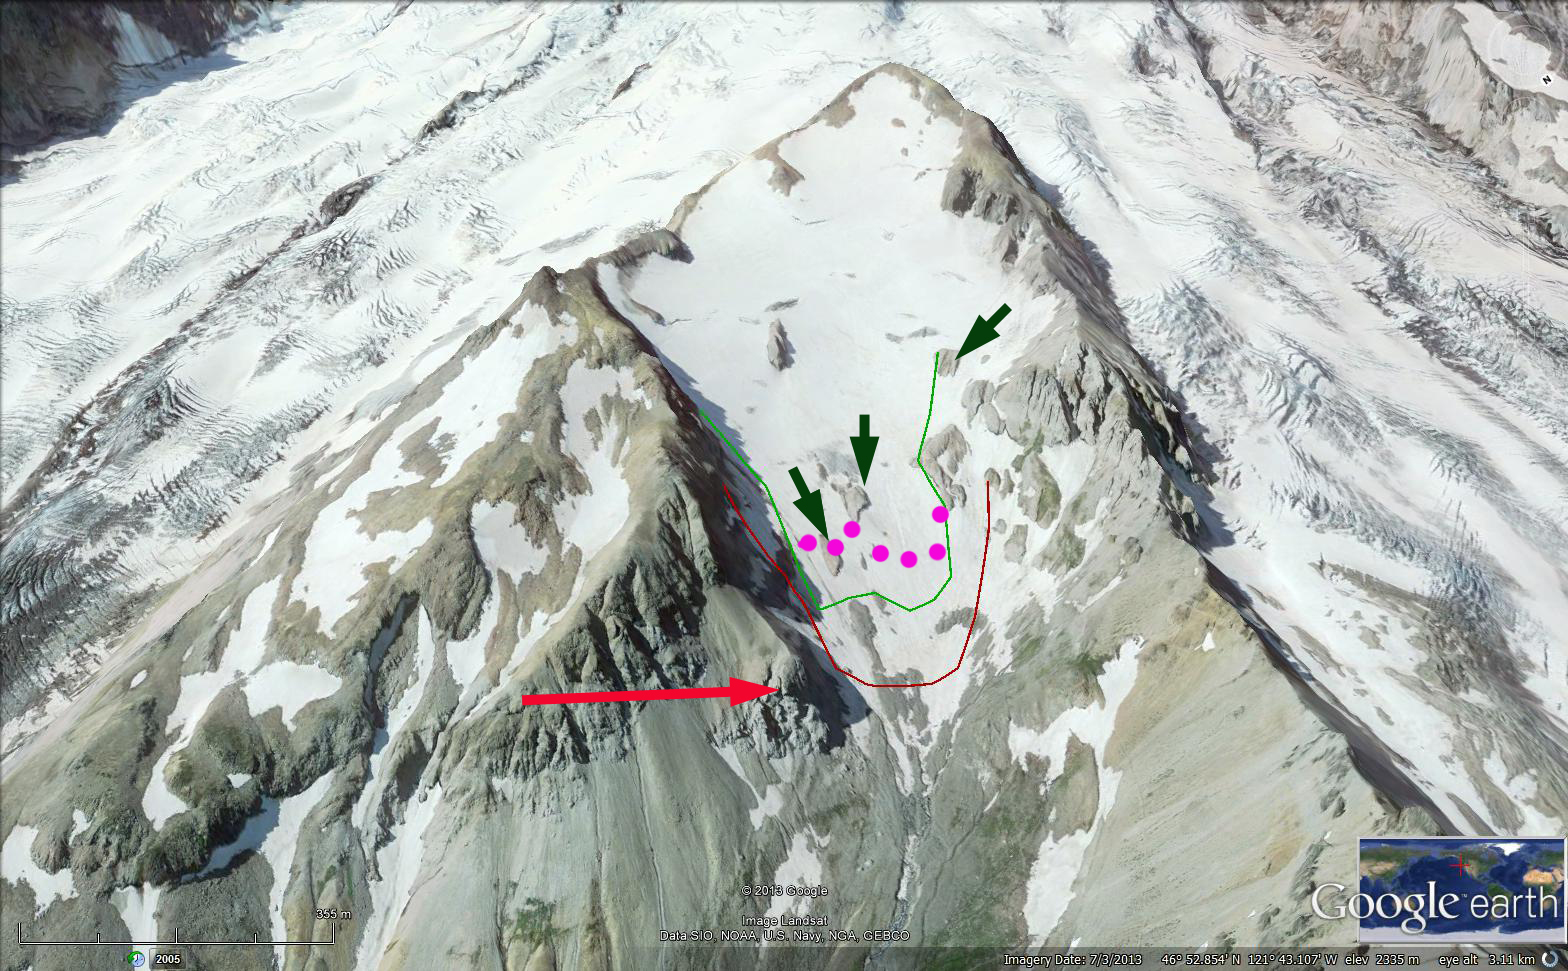
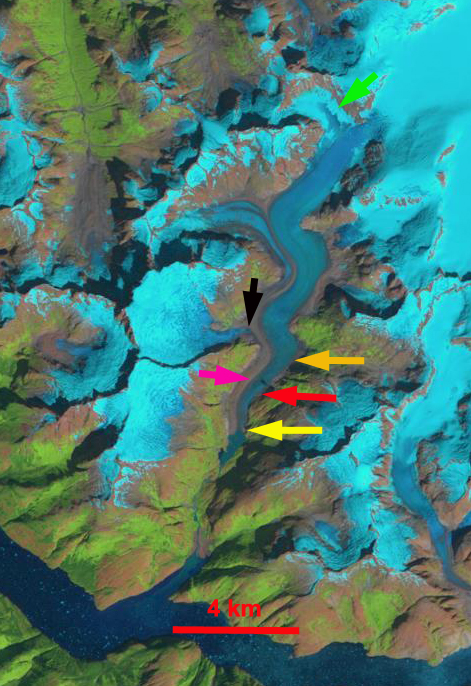
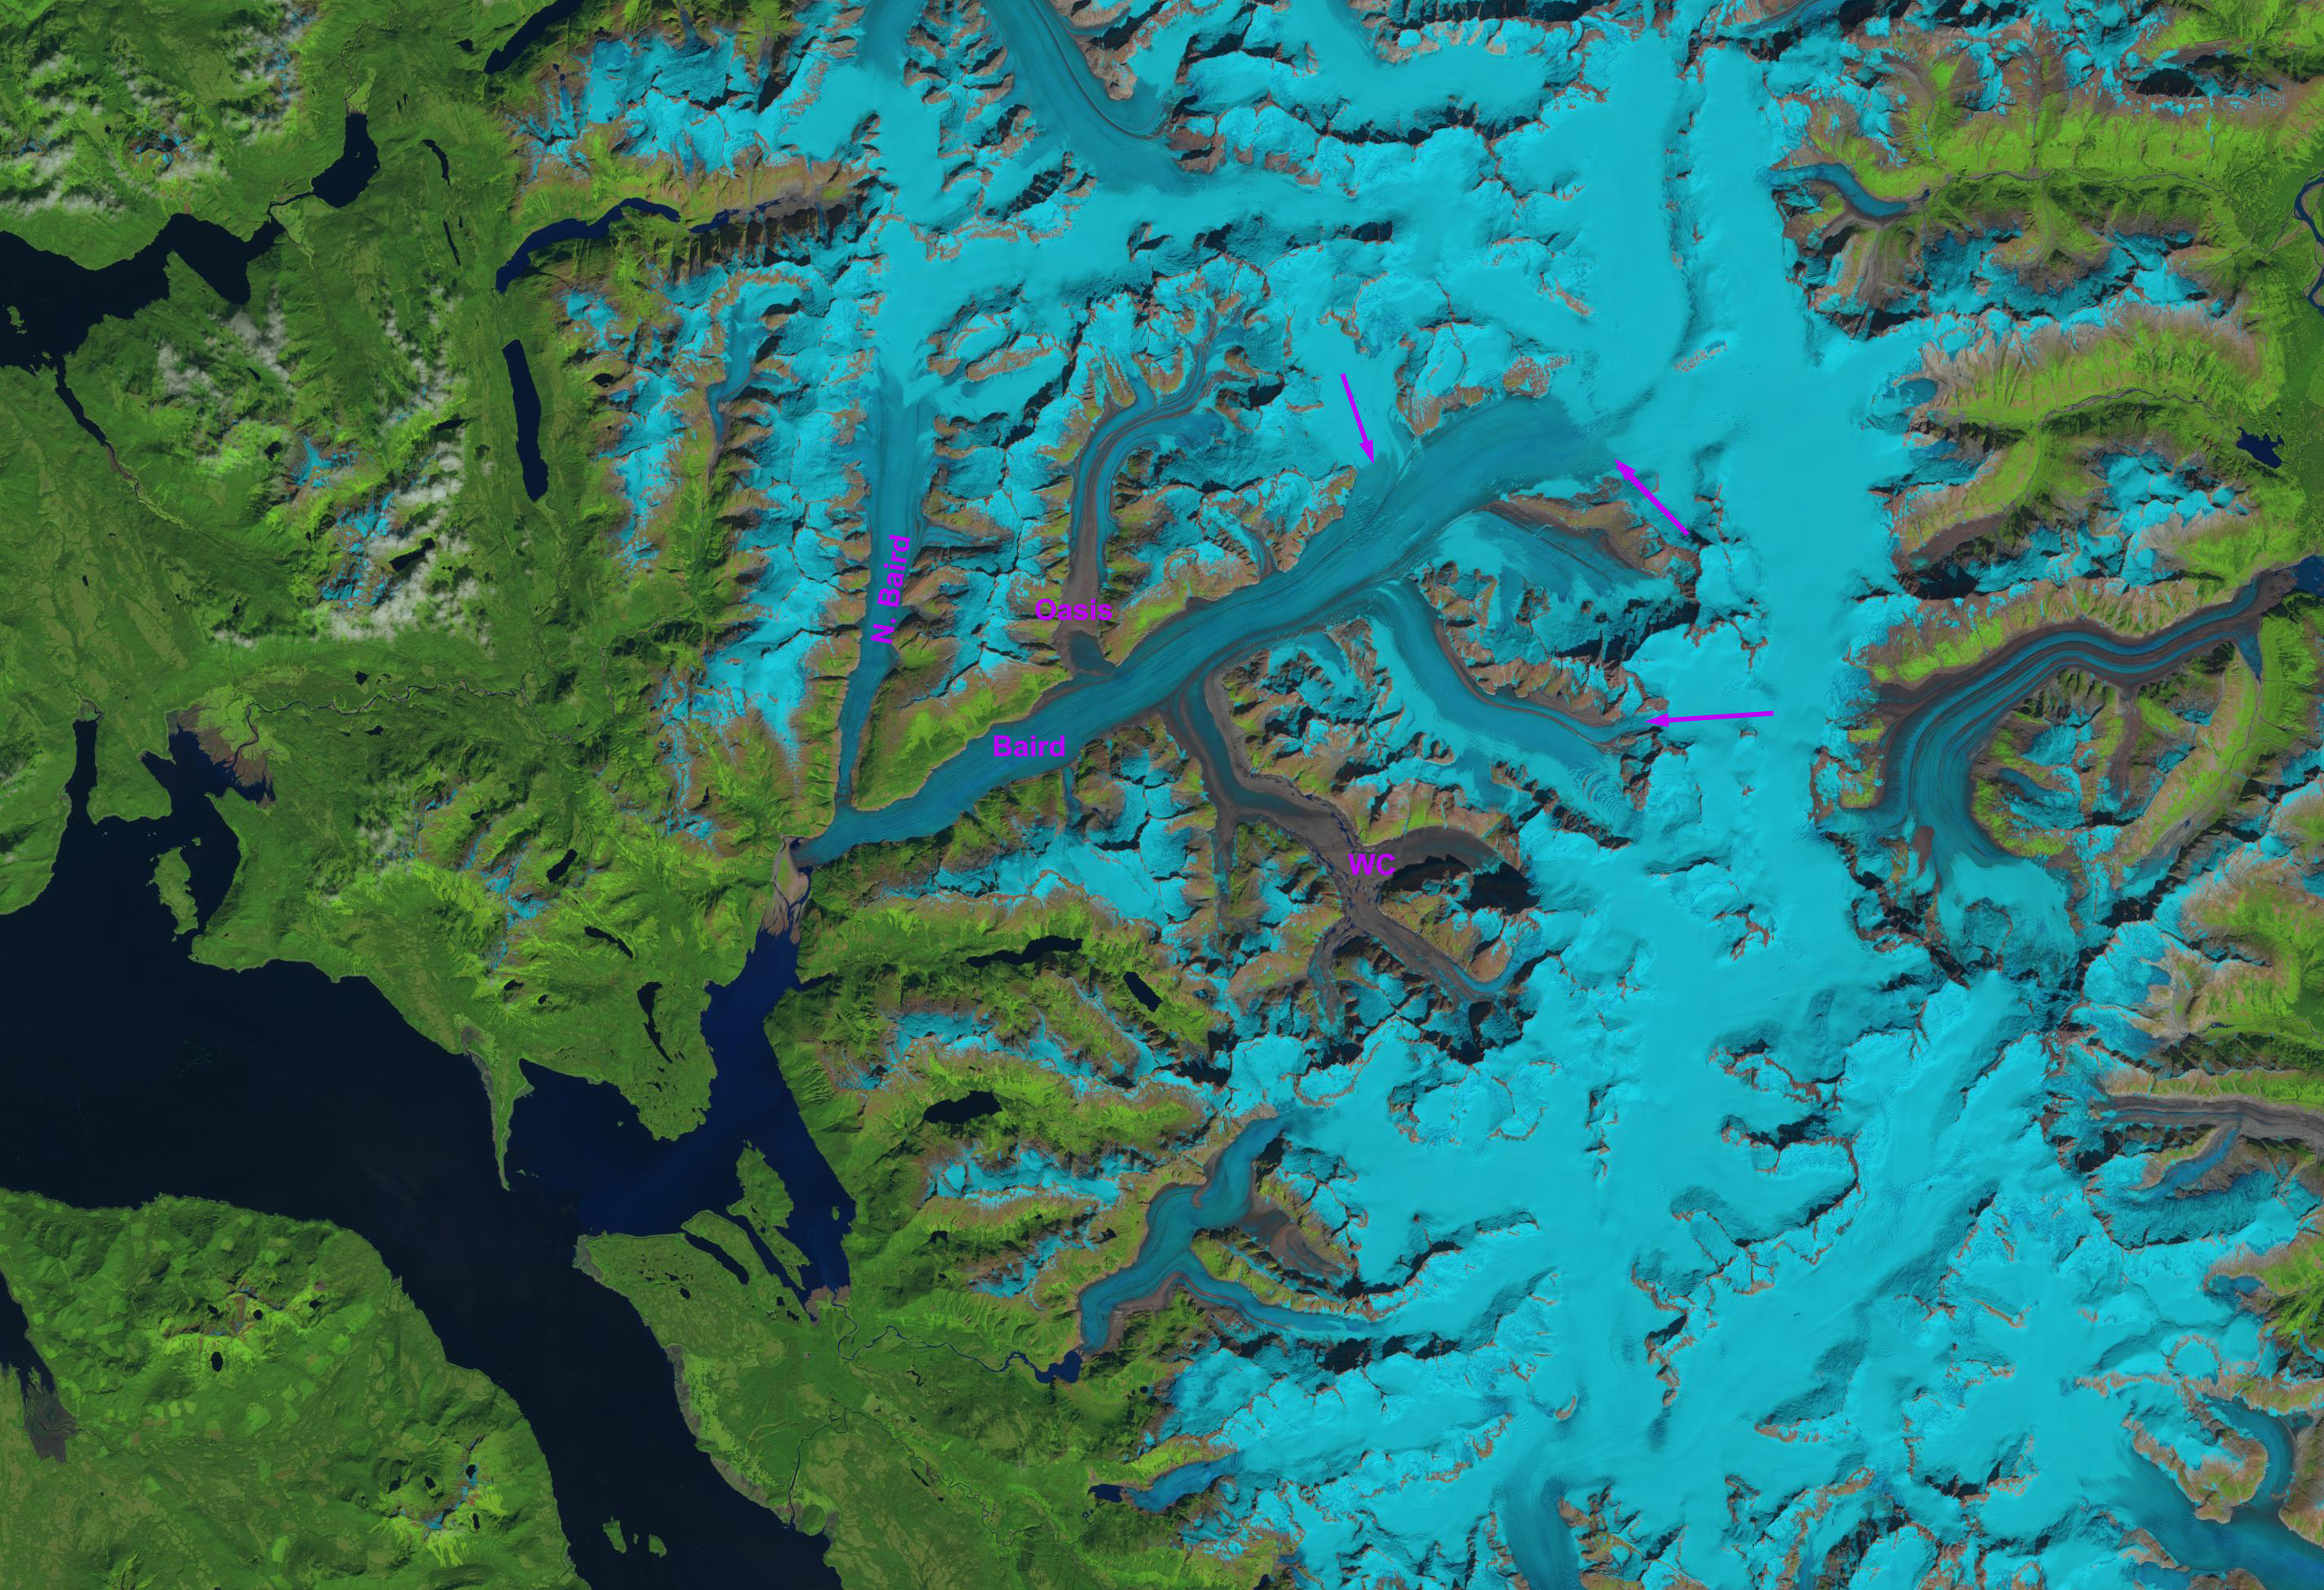
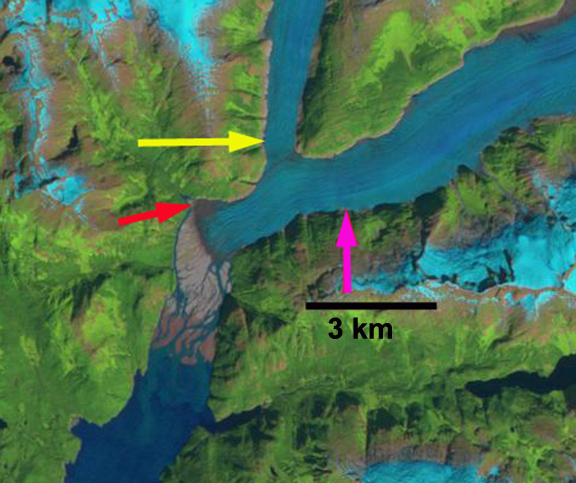
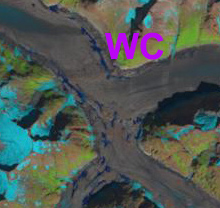
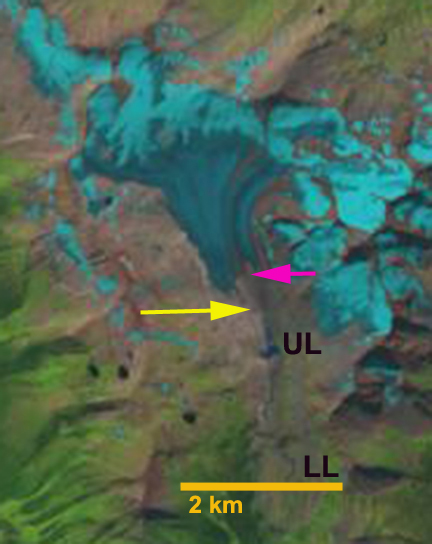
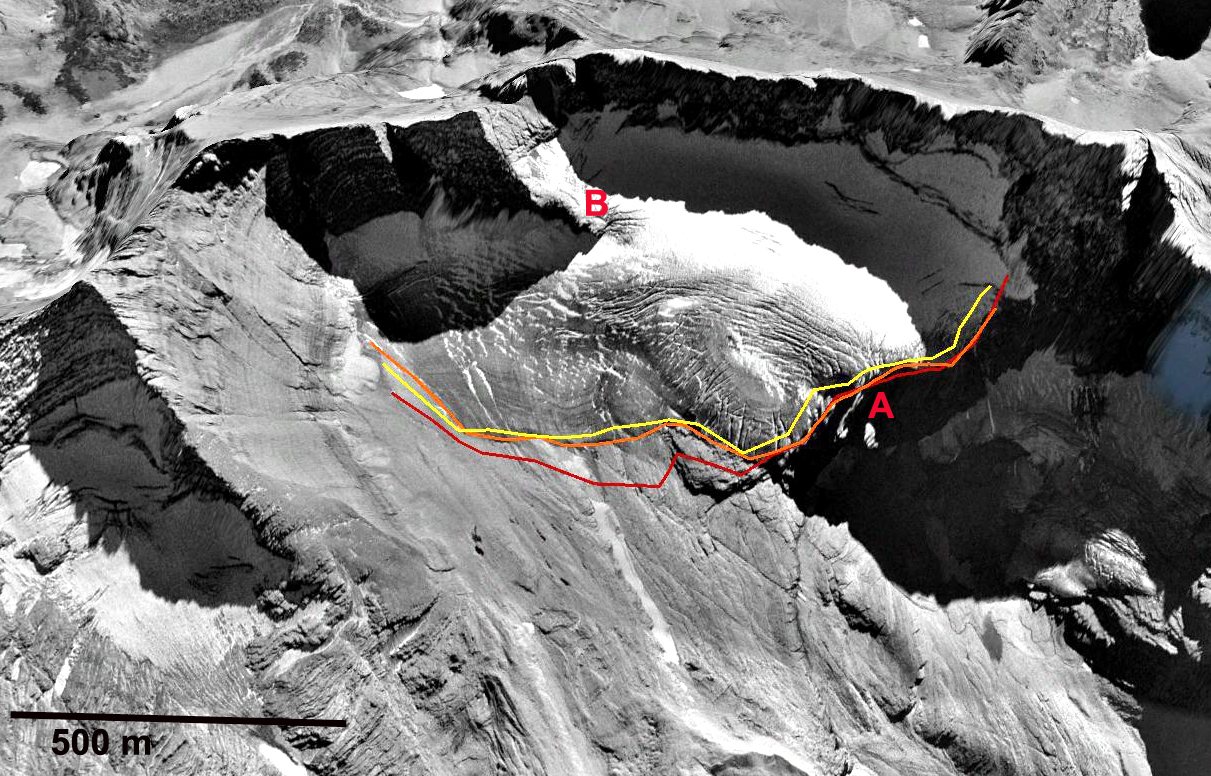
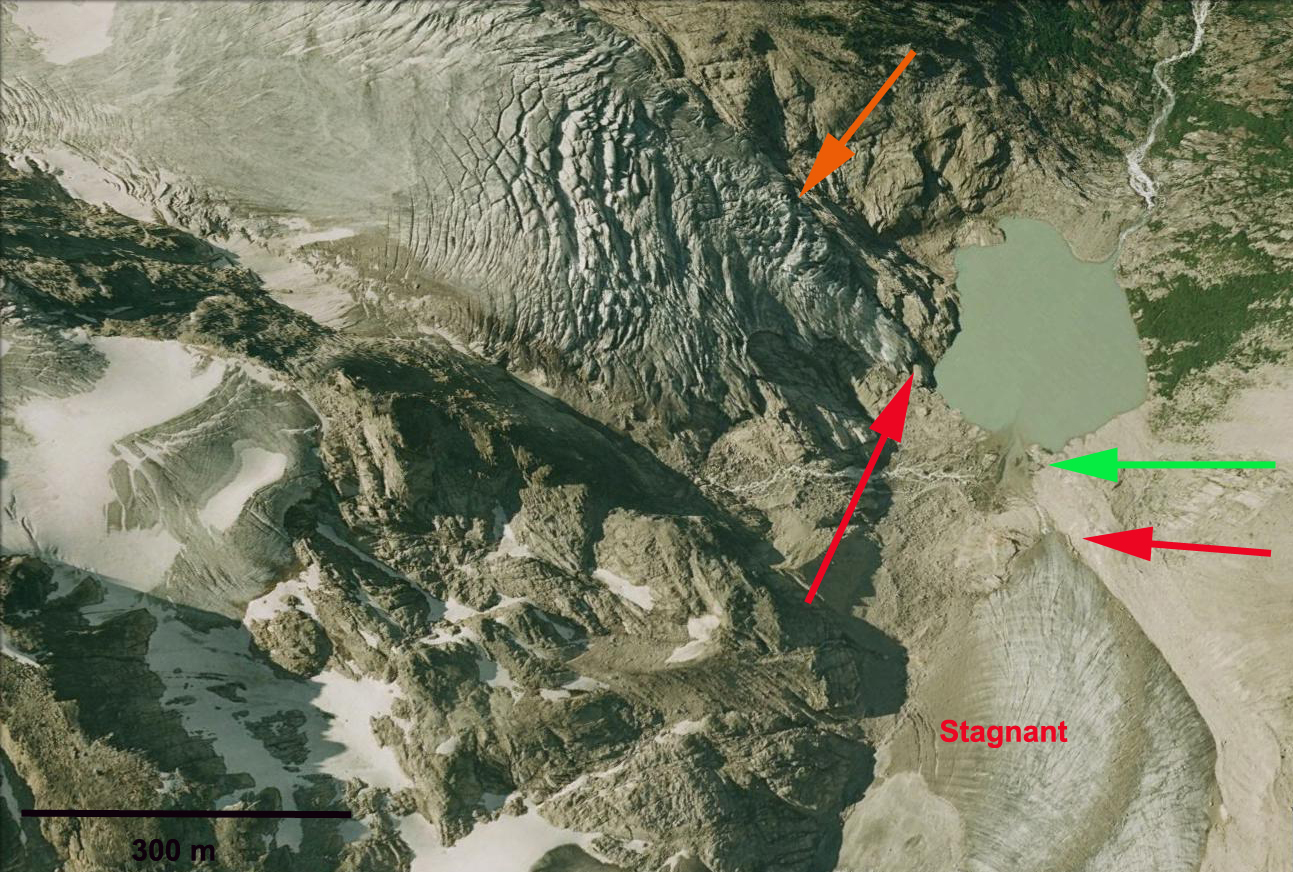
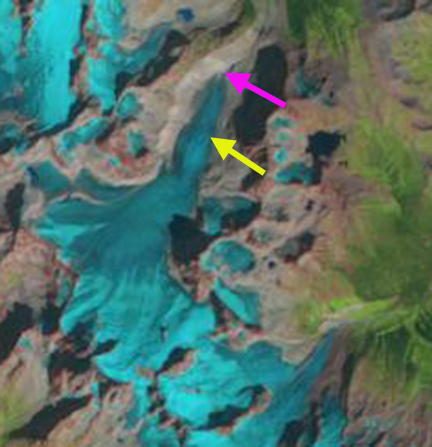
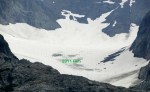
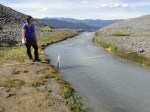
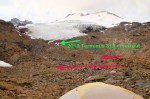
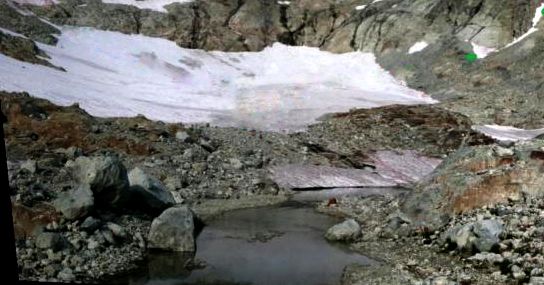
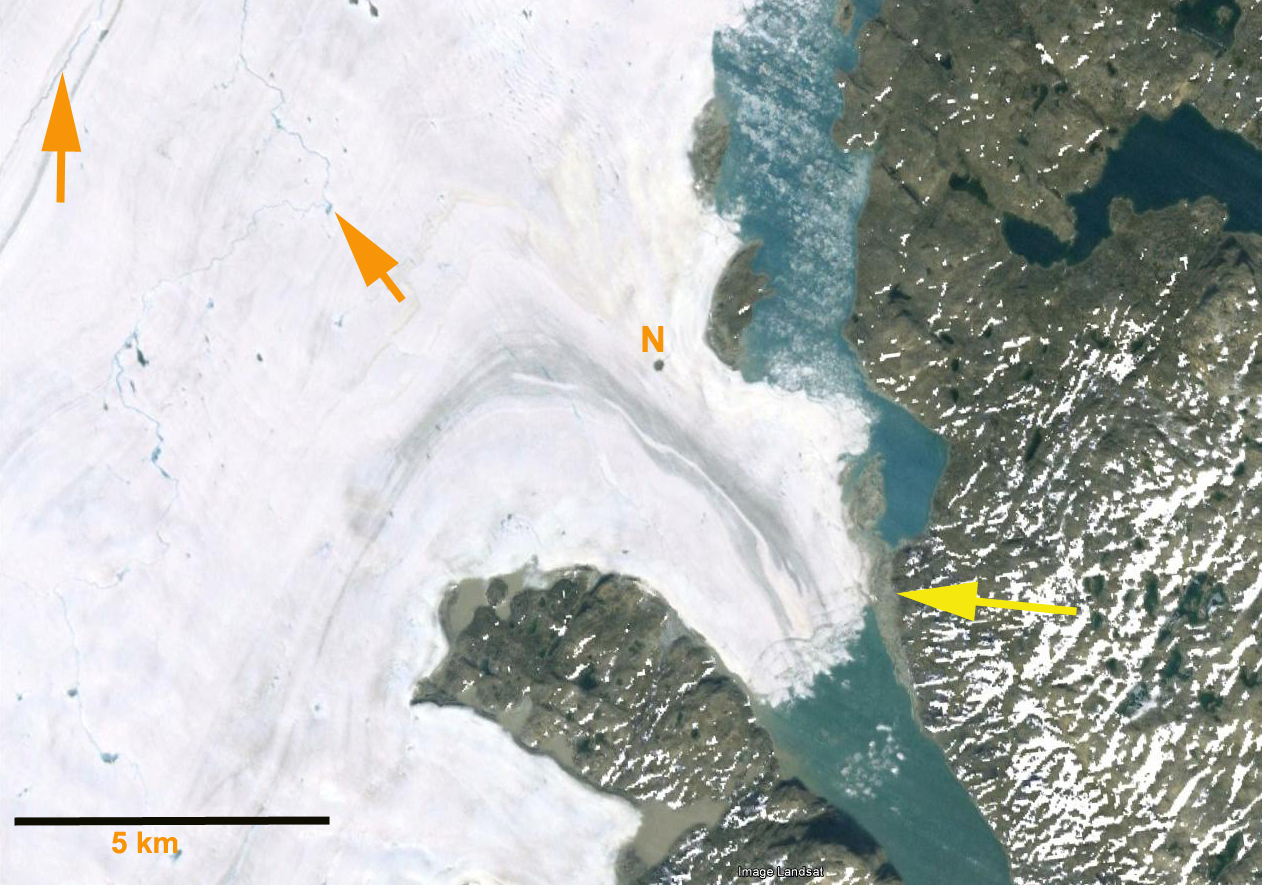
A closer look at the junction of the glaciers, the Bredbrae area, indicates a few substantial supraglacial streams, orange arrows. The front is also exhibiting a bit of a melange, that has been lost in recent Landsat imagery. The last closeup is of the L. Bistrup Brae terminus. The yellow arrow indicates the trimline of the recent advance that the glacier has retreated from. The N denotes a new island emerging from beneath the ice, indicating good pinning points, shallow water and limited calving in this area. The last image is a closeup of the proglacial Randsøen downstream of Borgjokulen. This lake indicates expansion, and considerable potential for more, note the heavily rifted, stream bisected area encompassed by purple and pink dots. A key change is the development of a substantial supraglacial stream that is first evident in the imagery in 2012, and expanded in 2013, orange arrows. This feature may well have existed prior to this but not at scale visible in Landsat. The stream has clearly expanded greatly in the last few years, likely due to enhanced melt. As we have seen on Petermann Glacier outlet streams are not key points of weakness for sections of floating or near floating ice, it is actual rifts. There are no rifts here. However, given the lack of velocity, and the presence of so much surface melt and some bottom melt at least near Randsøen, the large supraglacial stream indicates a section of the glacier that is thinning and quite vulnerable. In particular if the juncture area of Storstrommen and L.Bistrup Brae continues to thin and rift, this is the likely place for a collapse to occur. The thin nature of this section in the Polar Portal terminus of the 1980’s, less than 10 km, indicates this is the weakness. A key question of mine is how extensive is bottom melting for this glacier? The lack of a large floating tongue and low flux in and out of the fjord suggested by the melanges, suggests basal melt is lower than for many glaciers. Andreas Muenchow’s, a physical oceanographer at U. Delaware, notes that Reeh et al (2004) does not indicate significant bottom melting for Storstrømmen and that the a close look at the Lidar and Radar data from Operation IceBridge is essential to address this issue.

storstrommen ge terminus

storstrommen bredbrae

storstrommen bistrup

storstrommen streams

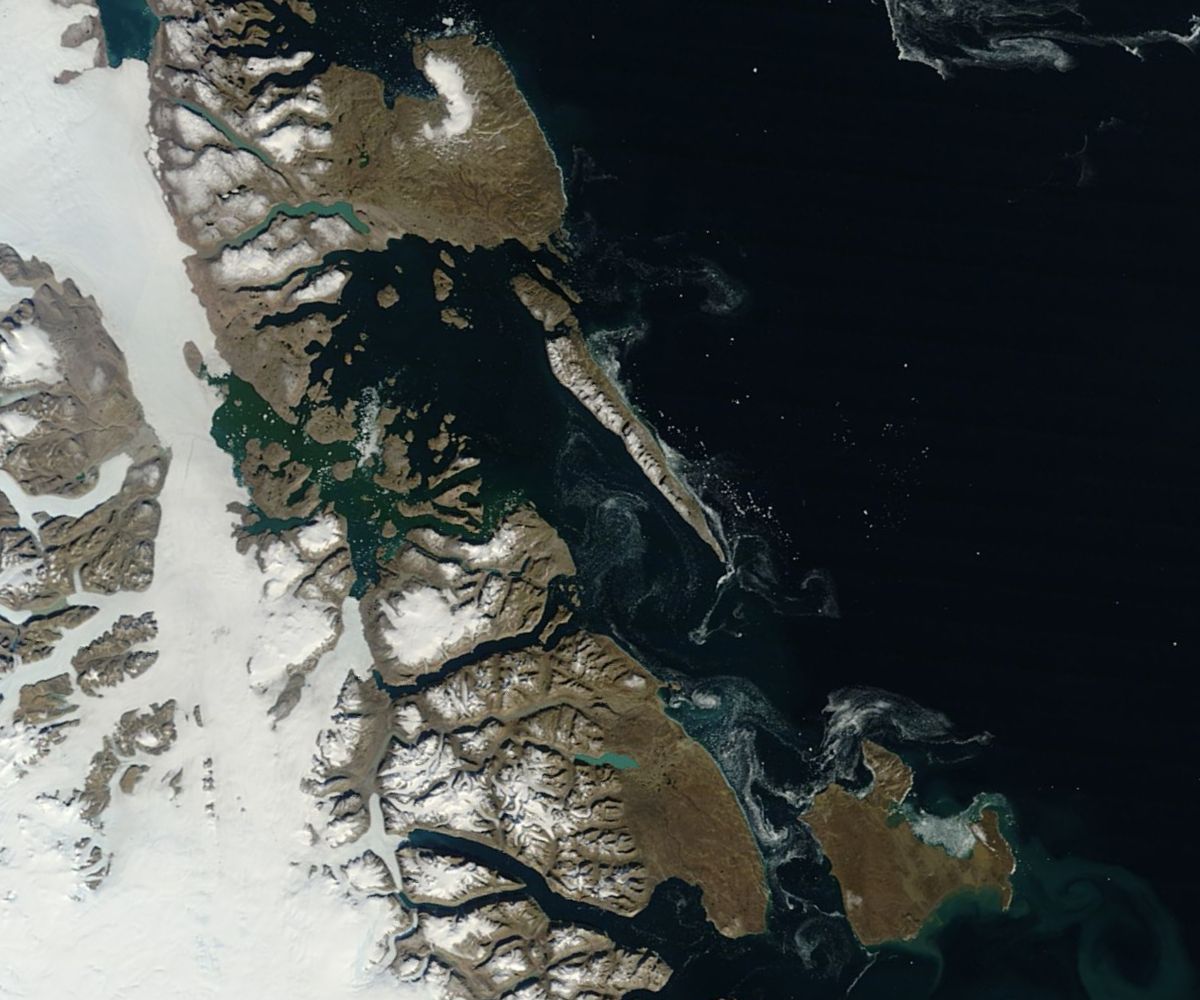
The last few images are Landsat images from 2006, 2009 and 2012 reinforcing the above that the main terminus change is in the central green dot section, that there are considerable pinning points for both L. Bistrup Brae and Storstrommen on their eastern margins, suggesting the central margin is the weak point. The central margin is also where the large proglacial lake has developed on the west margin of the glacier. The last image is MODIS from 8/23/2013. This indicates little change from the July 2013 Landsat images. However, what is illustrated is the fantastic range of imagery thanks to NASA, with high resolution of Landsat and high frequency of MODIS, and both readily available.
storstrommen 2006

storstrommen 2009

storstrommen 2012
storstrommen20130823TERR

BAMS State of the Climate 2012-Glacier section

The BAMS State of the Climate 2012 has been published. It is the best synopsis of 2012 climate there is. What follows is the section on Alpine glaciers, that I authored, from BAMS.

3) Alpine glaciers—M. S. Pelto

Alpine glaciers have been studied as sensitive indicators of climate for more than a century, most commonly focusing on changes in terminus position and mass balance. The worldwide retreat of mountain glaciers is one of the clearest signals of ongoing climate change (Haeberli et al. 2000). The retreat is a reflection of strongly negative mass balances over the last 30 years (WGMS 2012). Glacier mass balance is the difference between accumulation and ablation. The recent rapid retreat and prolonged negative balances have led to some glaciers disappearing and others fragmenting (Pelto 2010).

The World Glacier Monitoring Service (WGMS) record of mass balance and terminus behavior (WGMS 2012) provides a global index for alpine glacier behavior. Annual mass balance was -766 mm
water equivalent (w.e.) in 2011, negative for the 21st consecutive year. Preliminary data for 2012 from Austria, Norway, New Zealand, Nepal, and the United States indicate it is highly likely that 2012 will be the 22nd consecutive year of negative annual balances. The loss of glacier area is leading to declining runoff; the importance of this is indicated by Schaner et al.(2012) who determined that, globally, 370 million people live in river basins where glaciers contribute at least 10% of river discharge on a seasonal basis.

The cumulative mass balance loss since 1980 is 15.7 m w.e. the equivalent of cutting a 17-m thick slice off the top of the average glacier (Fig. 2.9). The trend is remarkably consistent from region to region
(WGMS 2011). WGMS mass balance results based on 30 reference glaciers with 30 years of record is not appreciably different, -15.5 m w.e. The decadal mean annual mass balance was -198 mm w.e. in the 1980s,
-382 mm w.e. in the 1990s, and -740 mm w.e. for 2000–10. The declining mass balance trend during a period of retreat indicates alpine glaciers are not approaching equilibrium and retreat will continue to be the dominant terminus response.

global glacier mass balance 2012

In 2012, slightly-above-average winter accumulation in the Alps was offset by extreme summer ablation, yielding mass balances that were negative. In Austria, Mullwitzkees had a mass balance of -1461
mm w.e. and Hallstätter Gletscher a mass balance of -1944 mm w.e. (Fischer 2012). The Austrian Glacier inventory in 2011 examined 90 glaciers: 87 were in retreat and 3 were stationary. Average terminus change was -17 m, reflecting the continued negative mass balances of the region. In Italy, a large deposit of World War I ammunition melted out of the glacier on Ago Di Nardis Peak during August 2012. The Swiss Glacier Monitoring Network noted in 2011 92 glaciers retreating, 1 advancing, and 3 stationary. The one advancing glacier had retreated the previous five years. The 2012 data are not complete, but retreat was again dominant.

In Norway, terminus fluctuation data from 25 glaciers for 2012 with ongoing assessment indicate 21 retreating, 2 stable, and 2 advancing. The average terminus change was -12.5 m (Elvehøy 2012). The retreat rate is less than 2011. Mass balance surveys found deficits on all Norwegian glaciers.

In the North Cascades, Washington La Niña conditions during the winter led to a wet winter and a cool and wet spring. Summer was drier and warmer than normal. This led to nearly equilibrium conditions on North Cascade glaciers, with mass balance positive on five glaciers and negative on four glaciers (Pelto 2013). In southeast Alaska, the same La Niña conditions prevailed and led to the highest snow totals in several decades. Glacier snowlines were more than 100 m below average on Lemon Creek and Taku Glaciers of the Juneau Icefield indicative of moderate positive mass balance (Pelto 2013).

Camp below Easton Glacier

In New Zealand, the annual end of summer snowline survey on 50 glaciers found snowlines that were approximately 120 m above the elevation for glacier equilibrium. This indicates strong mass balance losses (NIWA 2012). In Nepal, the International Centre for Integrated Mountain Development measured the mass balance of Yala and Rikha Samba Glaciers in 2012 and found both to be significantly negative (Mishra 2012). Pelto (2012) reported that the extensive inventories are better validated than GRACE (Jacob et al. 2012) for
Himalayan glacier volume change. This conclusion has been confirmed by Bolch et al. (2012).

Mangin Glacier Retreat and Separation, Alberta

Mangin Glacier and its unnamed neighbor flow down the north slope of Mount Joffre, Alberta and drain into Kananaskis Lake. The glacier like the vast majority in Alberta has been losing area and volume during its retreat. Bolch et al (2010) noted that the glaciers in western Canada had on average lost 11% of their area from 1985 to 2005, 16% on the east slope of the continental divide in the Rocky Mountains of Alberta. A comparison of Landsat imagery from 1994 and 2013, Google Earth imagery from 2005 and the Canadian Topographic map published in 1994, based on early 1990’s aerial photographs. In the map Mangin Glacier was a single ice body that extended for 3.2 km ending in a small lake at 2575 m, sections A-C were all joined, green line is glacier boundary for the map and brown line the 2005 glacier margin. By 1994 section C, yellow arrow, has only a tenuous connection and is clearly going to separate from parts A and B. Further a ridge between A and B is beginning to develop, red arrow. By 2005 in the Google Earth image sections A and B are nearly separated by the expanding ridge and C is fully separated from A and B. By 2013 A and B are fully separated, this image is from mid-August with a month of melting to go. The light blue is snowcover and the darker blue is bare glacier ice. In another month the amount of snowcover will be very small. For example earlier this month on Sholes Glacier in the North Cascades we observed rapid expansion of the blue ice zone from 12, 500 square meters on Aug. 3 to 35,000 square meters on Aug. 9. The retreat of the unnamed glacier labeled D is apparent in the comparison of the 1994 and 2013 images, note the green arrow. This retreat is 300-400 m, with much of the retreat coming after 2005. Mangin Glacier’s retreat from the map based on early 1990’s imagery is 500 m, combined with retreat of the top of the glacier 20% of the glacier length has been lost in the last 20 years. Mangin Glacier has been retreating even on its upper margin, this is indicative of a glacier without a consistent accumulation zone, and a glacier that will not survive(Pelto, 2010). Just southeast is Petain Glacier also retreating. As the glaciers retreat their meltwater that is primarily yielded in late summer when other sources are at a minimum will decline. It is anticipated that during this century glacier contributions to streamflow in Alberta will decline from 1.1 km3 a−1 in the early 2000s to 0.1 km3 a−1 by the end of this century Marshall et al (2011).mangin map

mangin early

mangin 2005 ge

mangin 2013