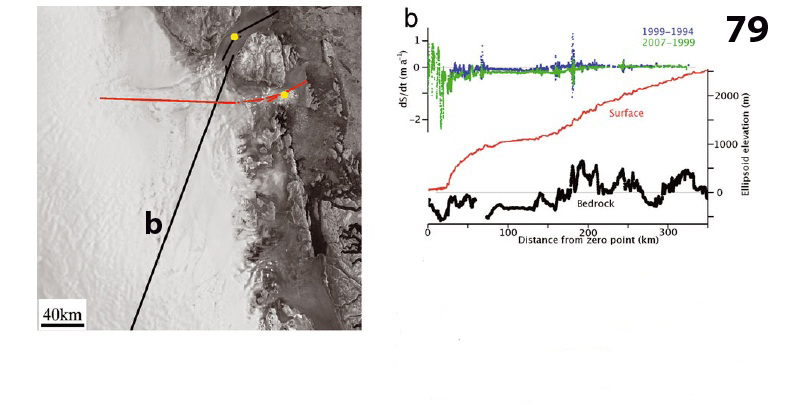
The Northeast Ice Stream in Greenland taps deeper into the heart of the Greenland Ice Sheet than any other glacier system. The ice stream has high velocities extending 700 km into the ice sheet, much longer than even Jakobshavn, first figure. This makes it a potential weakness for the northern sector of the GIS. The ice stream has three major outlets the Storestrommen, Zachariae and Nioghalvfjerdsbræ (79 Glacier). Fahnestock et (2001) identified that the initiation of fast flow occurred within 100 km of the ice divide and is driven by a high geothermal heat flux. Here we examine changes in the 79 Glacier using MODIS and Landsat imagery of the lower reach of the glacier. Nioghalvfjerdsbræ has a 20 km wide ice shelf, and the bed remains below sea level over a distance of 150 km upstream from the grounding line, and 200 km inland of the calving front, as indicated by the third figure below from Thomas et al, (2009).
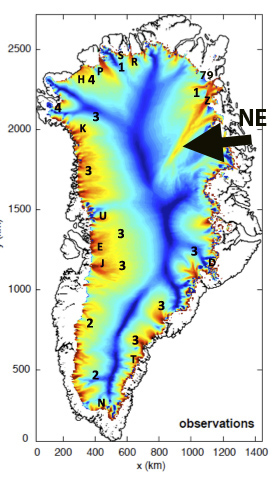
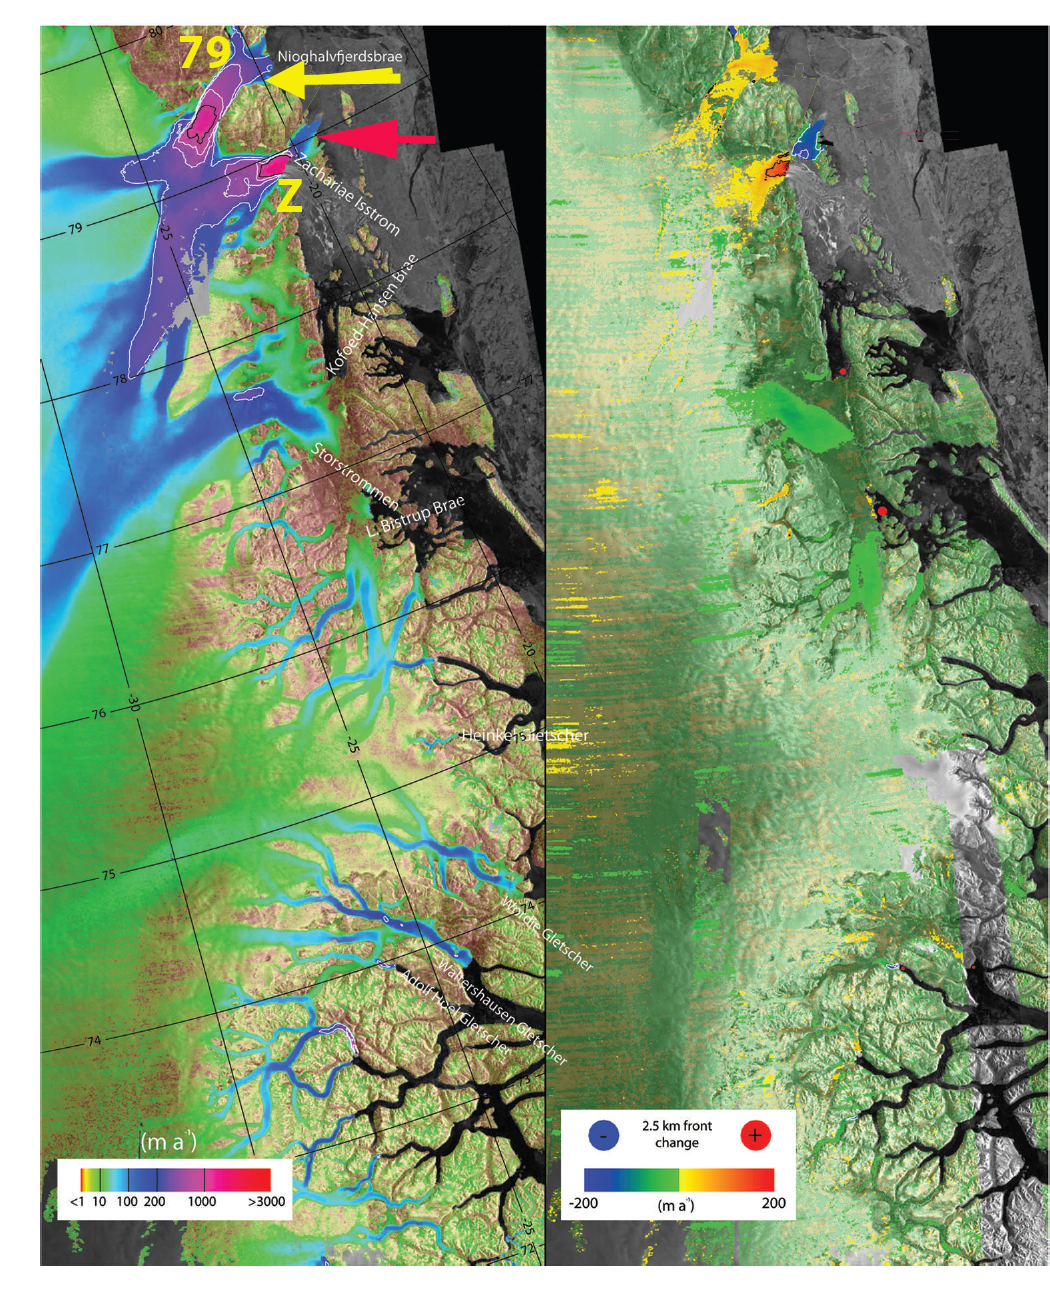
Velocity of the Greenland Ice Sheet indicating extent of NE Ice Stream, (Bailey and Pelto, 2011).
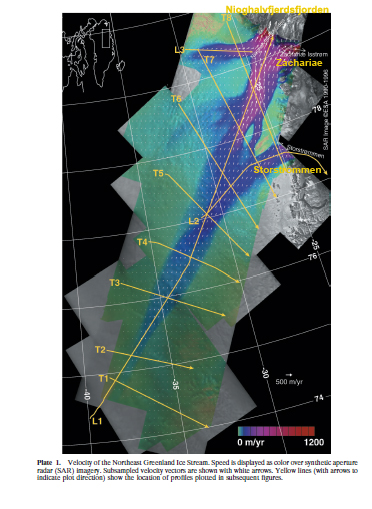
Velocity map From Joughin et al (2010)
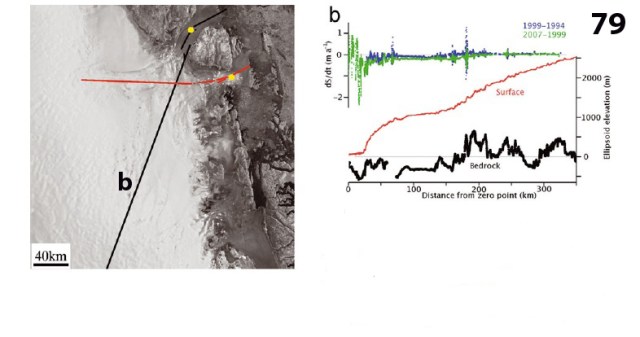
Bedrock Profile, surface profile and thickness change on a 79 Glacier Profile (Thomas, et al, 2009).
The most extensive field study of this remote glacier was conducted by GEUS(Geologic Survey of Denmark and Greenland) from 1996-1998(Thomsen et al. 1997). Thomsen et al (1997) denotes a floating ice tongue that is 60 km long and 20 km wide until expanding at the terminus to 30 km.They identified surface velocities in the terminus tongue section of the glacier, surface mass balance, ice thickness and bottom melting. he multi-year survey of the glacier by GEUS indicated that basal melting was approximately 4-5 m per year, much larger than the surface melt of 1 m per year. There works also indicates a rather uniform velocity for the floating ice tongue across the width of the glacier. Examination of ice thickness change on 79 Glacier indicates surface lowering predominated between 1994 and 1999, at rates of about 0.1ma–1, with almost exact balance further inland. Conditions were similar between 1999 and 2007, but with thinning rates increasing to about 0.3ma–1 over the seaward 150 km, and surface lowering of parts of the ice shelf by 0.5– 1ma–1 (Thomas et al, 2009).
Thomsen et al (2007) found surface velocities of 500 to 700 m per year in the region examined here, declining toward the ice front. The ice thickness declined from 325 to 175 m in thickness over a span 25 km in this same region. This is in a zone of limited change in width and most of the change has to be from basal melting. Given velocities observed of 600 m/year this would indicate a thinning of 150 m in a span of 40 years to traverse this reach. This would be a thinning for nearly 4 m per year via basal melting, a similar magnitude to the direct borehole observations.
Seroussi et al (2011) indicate the velocity declining from 800 m/year to 600 m/year in the reach examined here.
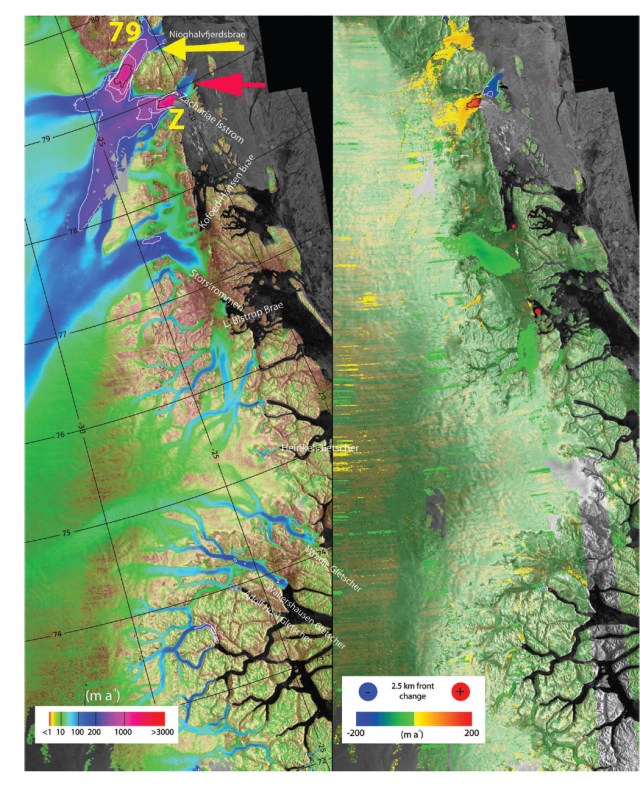
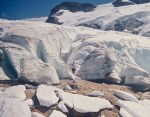
Velocity of 79 Glacier and Zachariae Ice Stream from Jougin et al (2010).
Joughin et al (2010) observed no significant change in speed for the inland part of the Northeast Greenland Ice Stream. They further noted that for 79 Glacier there was no significant speed-up, and any change visible on its floating ice shelf can be attributed to tidal effects. Straneo et al (2012) found that the warmest (deep) AW is found near Helheim, Jakobshavn and followed by Kangerdlugssuaq and 79, with Petermann having the coldest. This suggests that basal melting can be an even more significant volume loss than on Petermann.
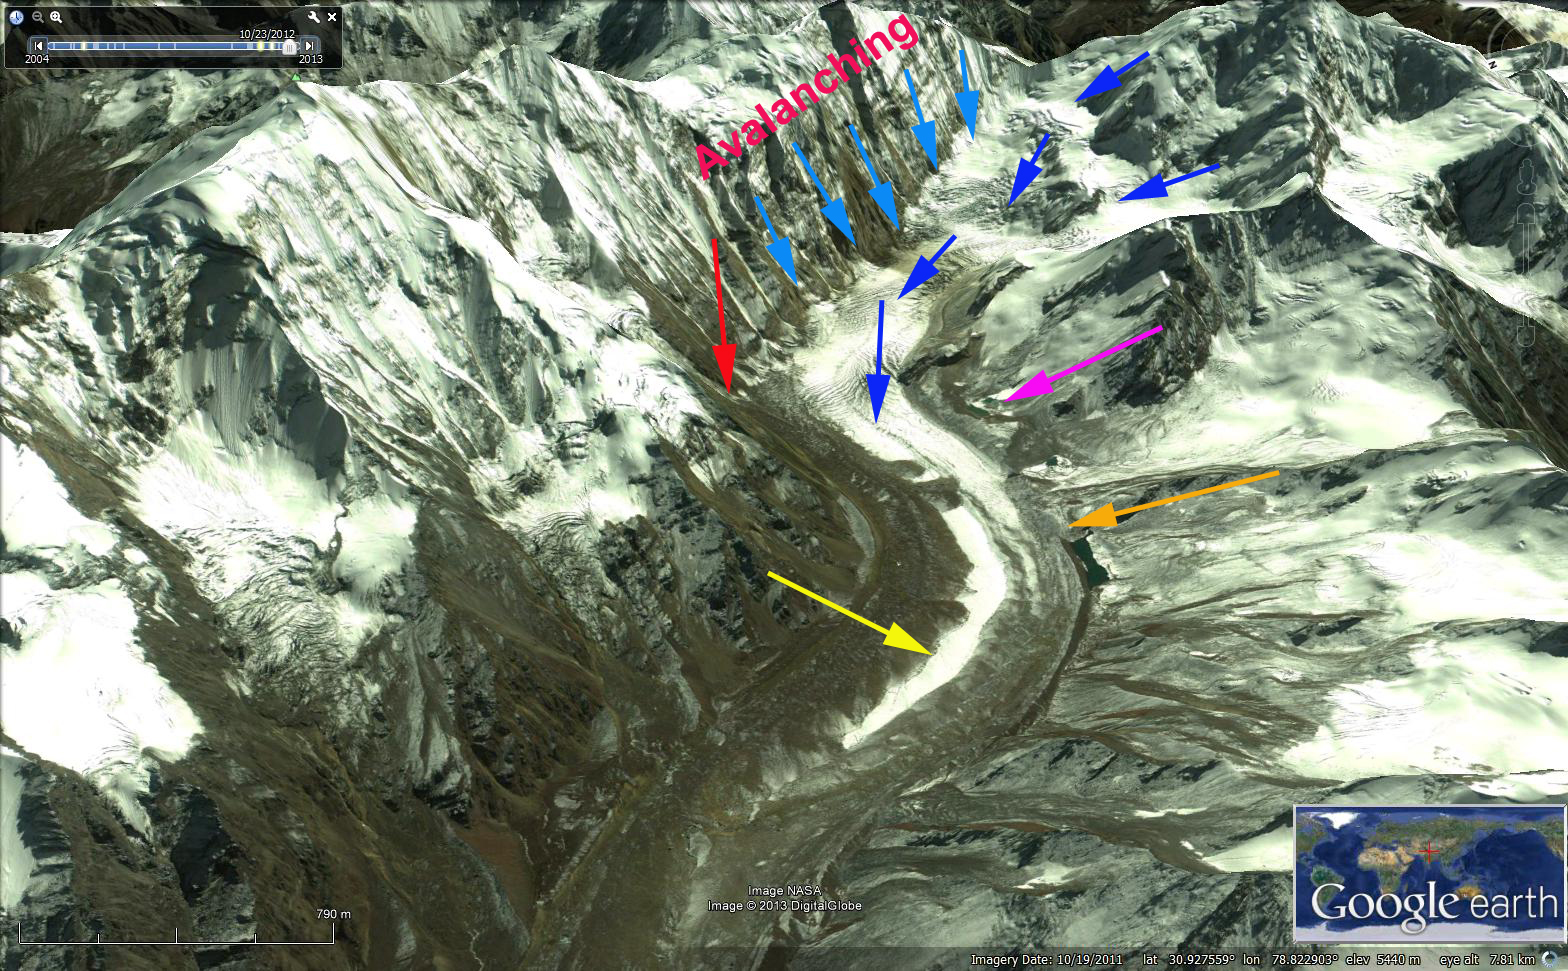
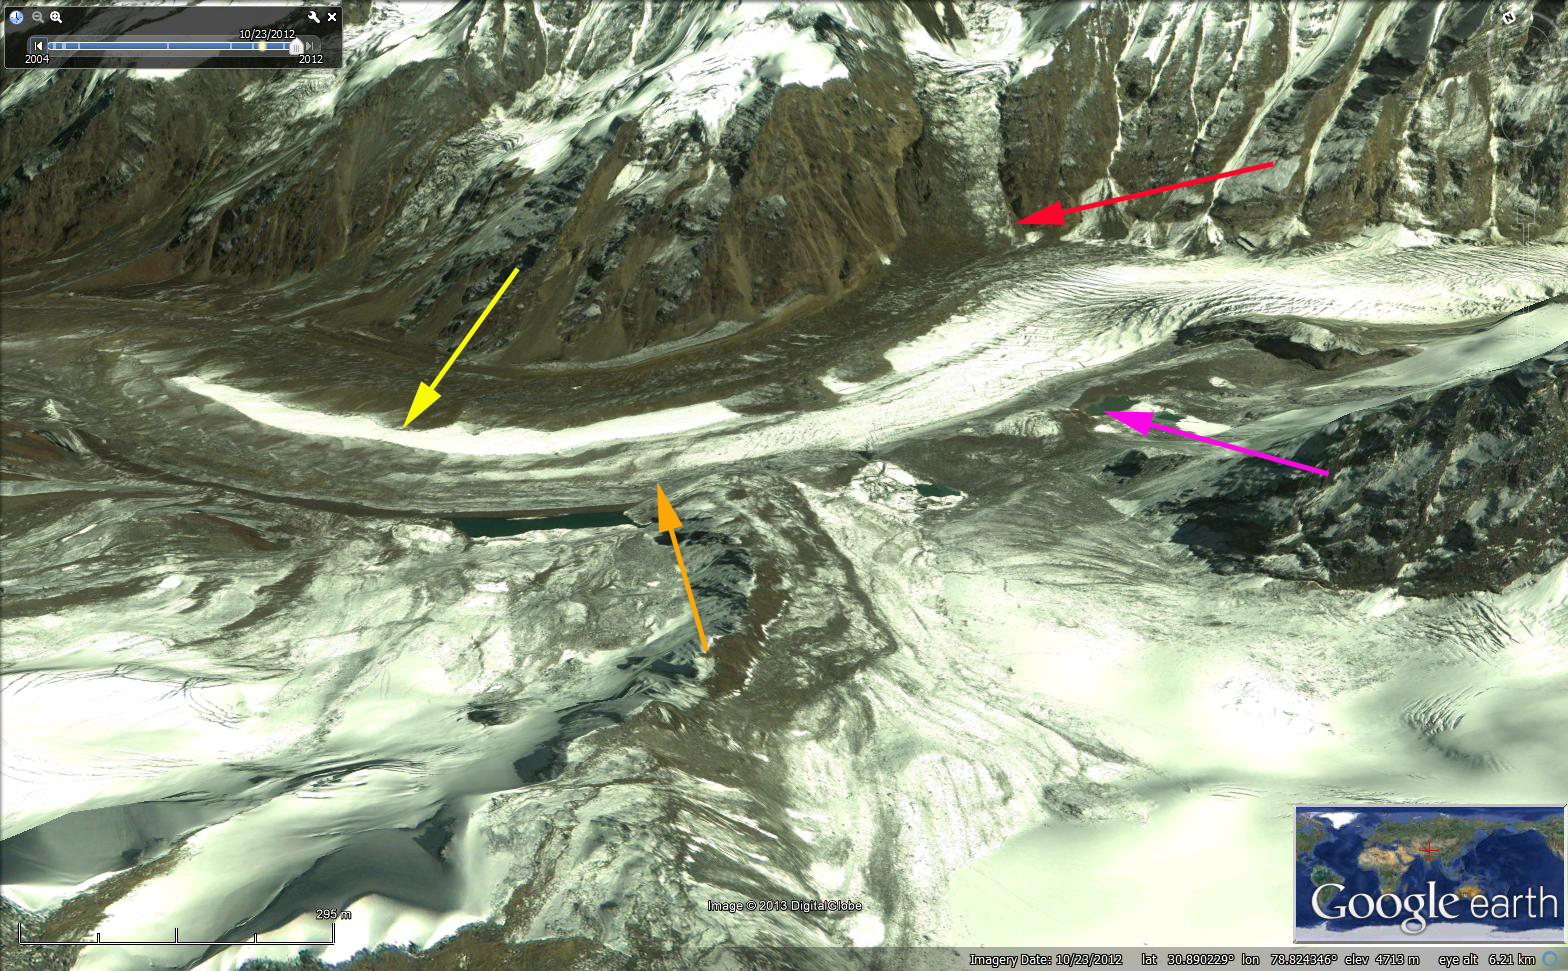
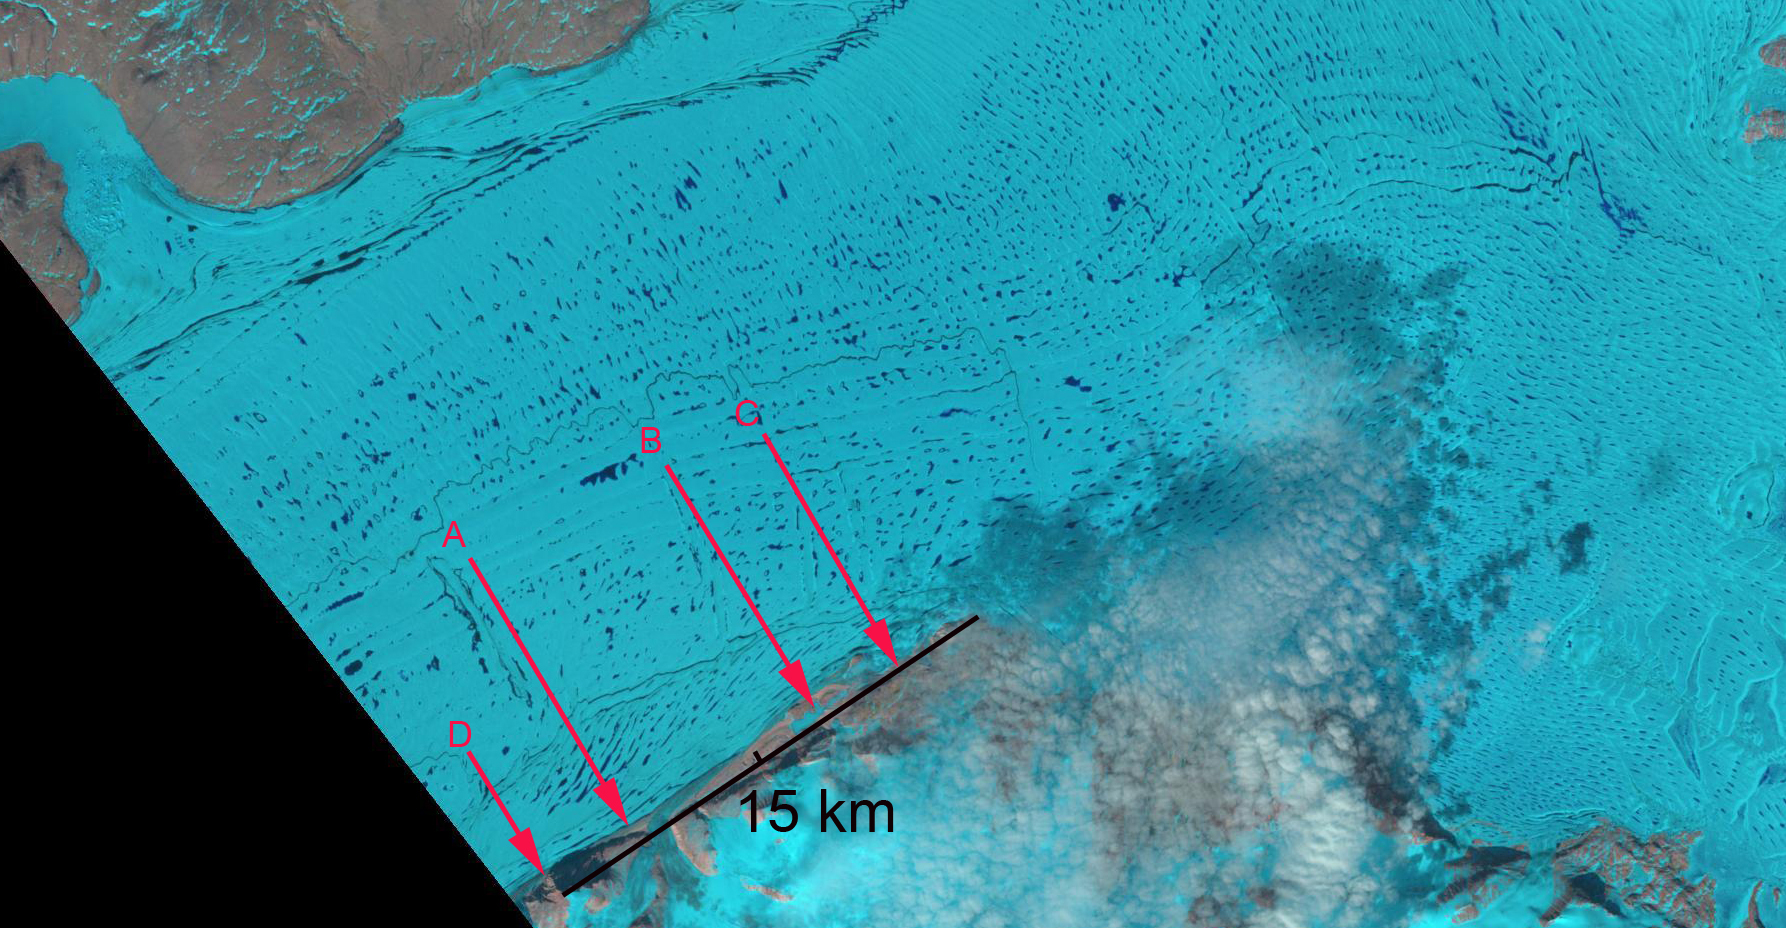
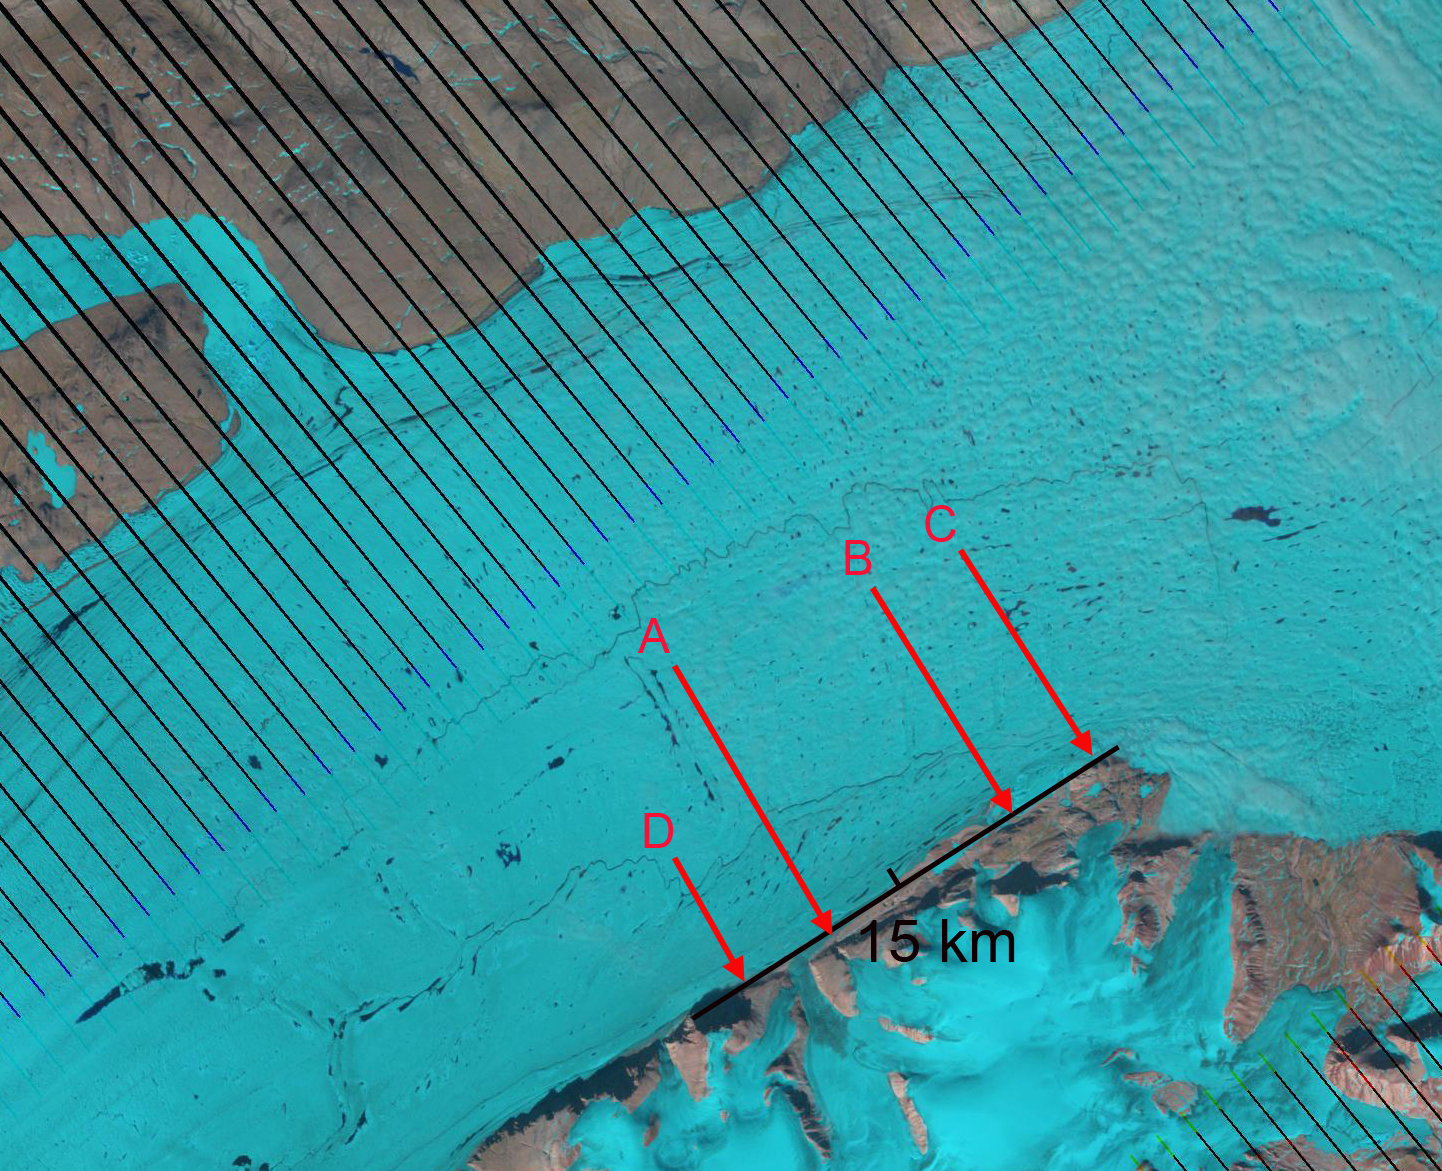
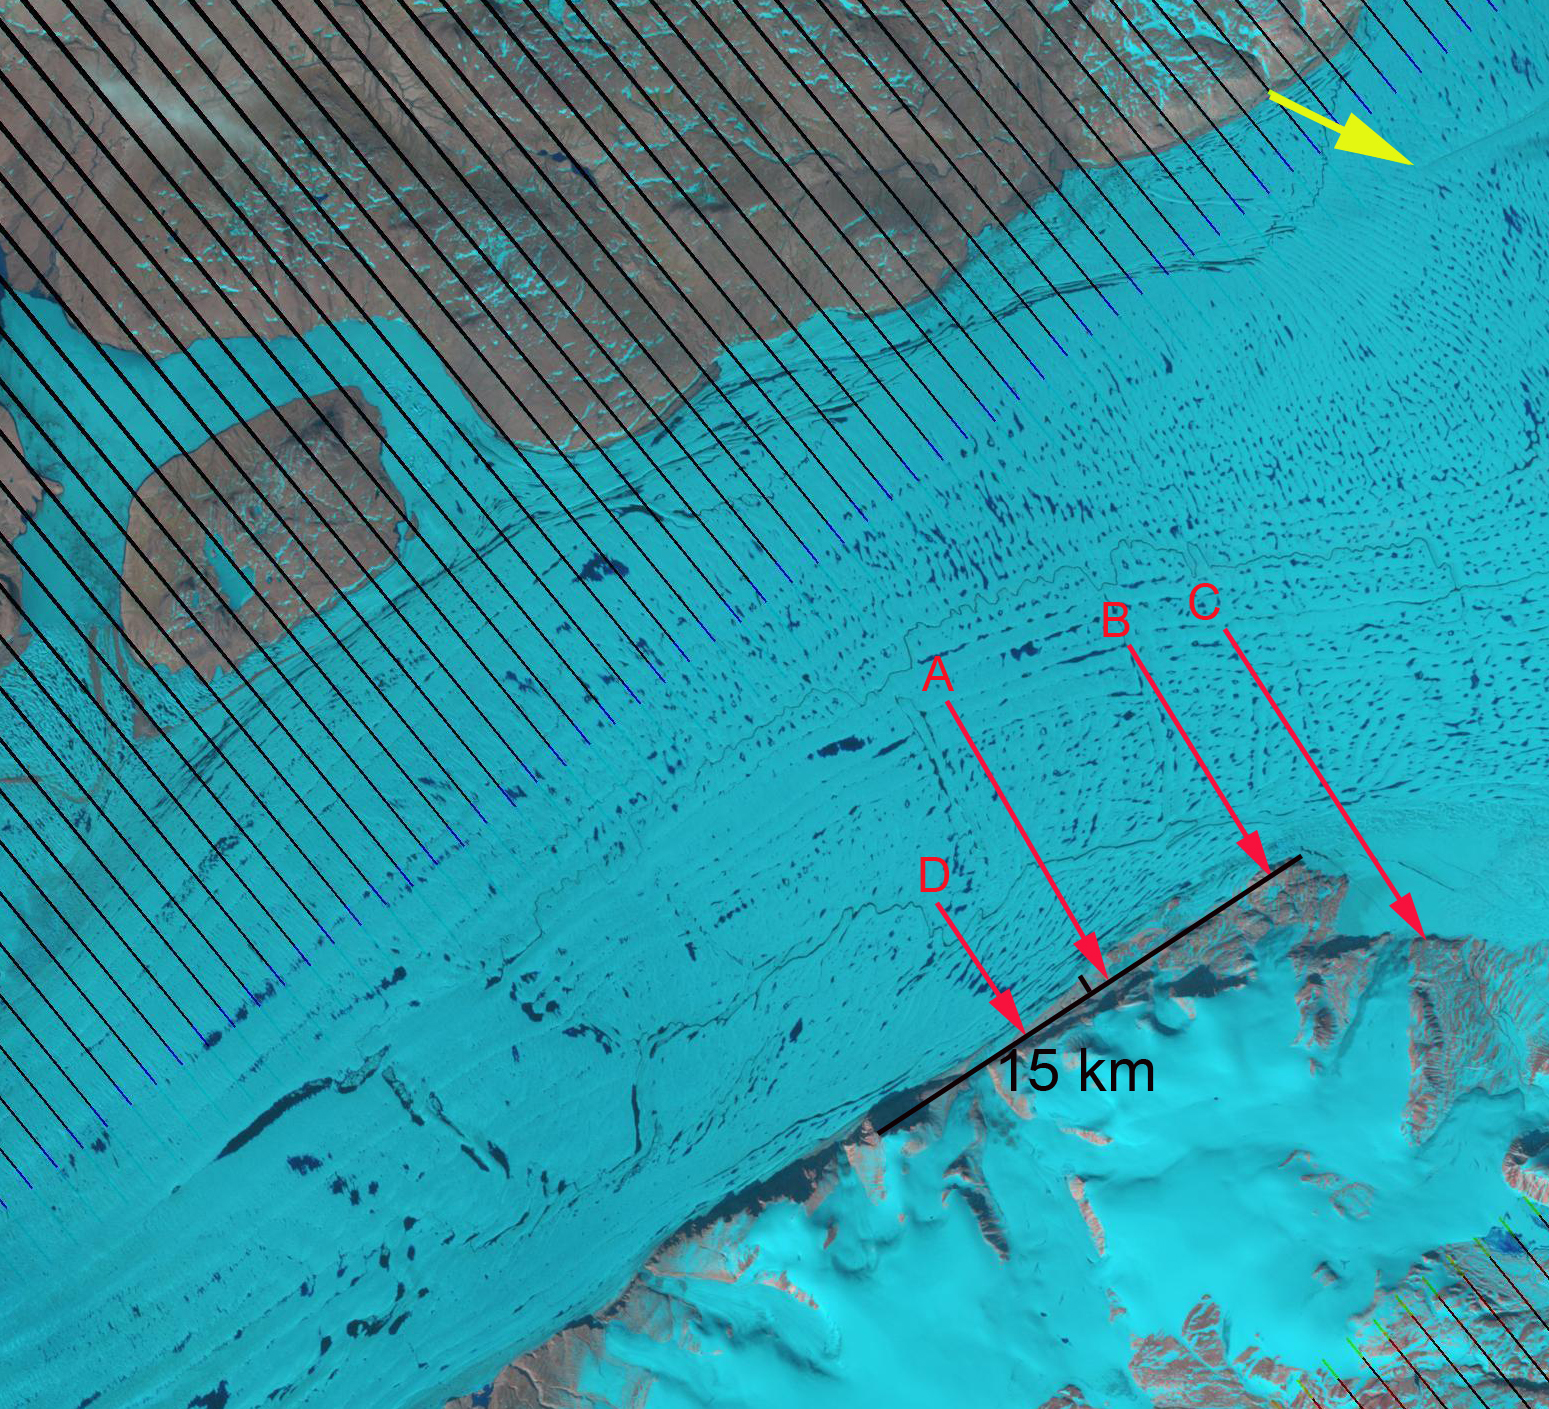
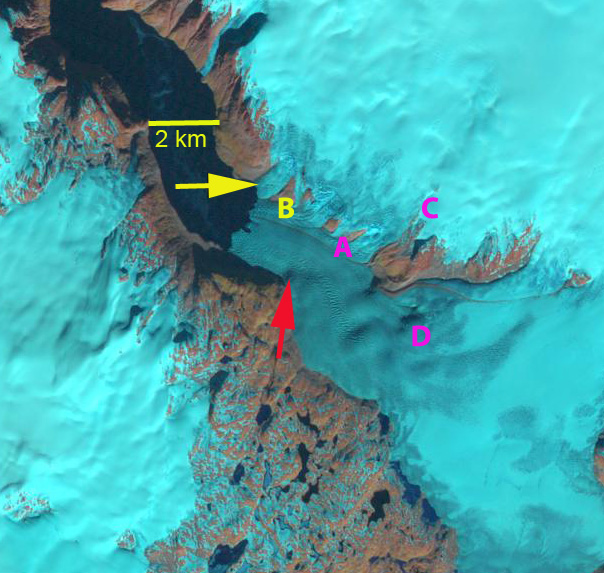
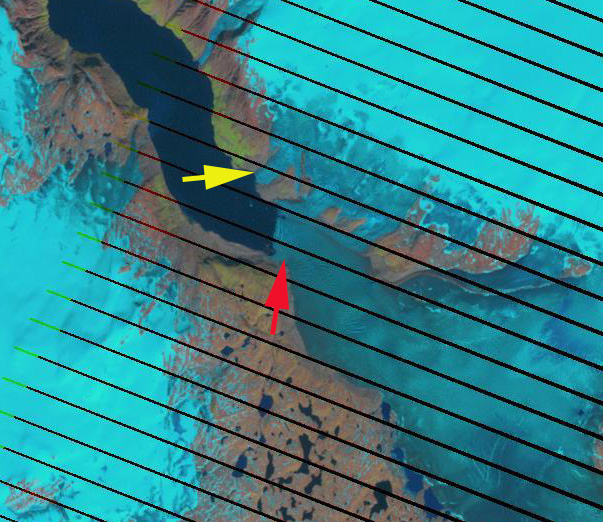
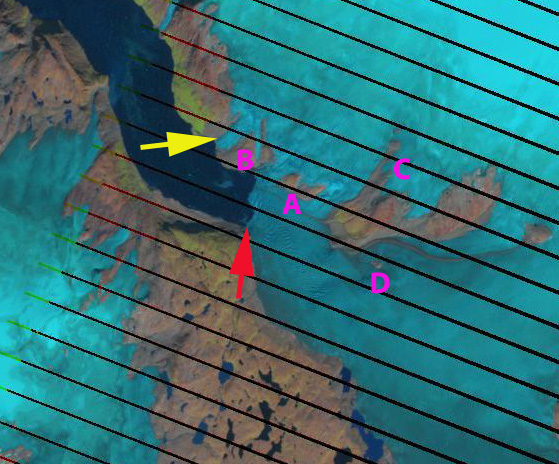
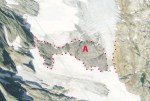
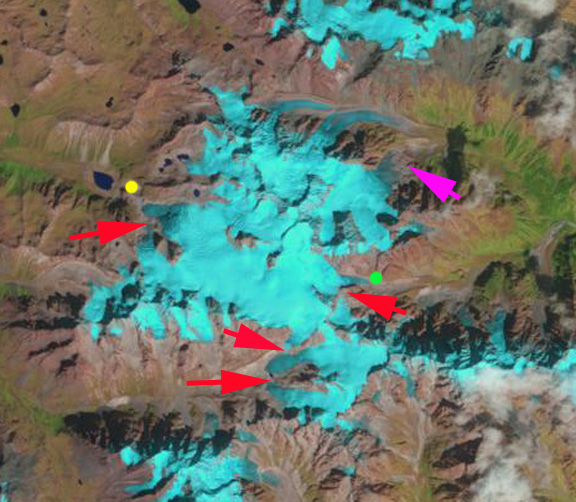
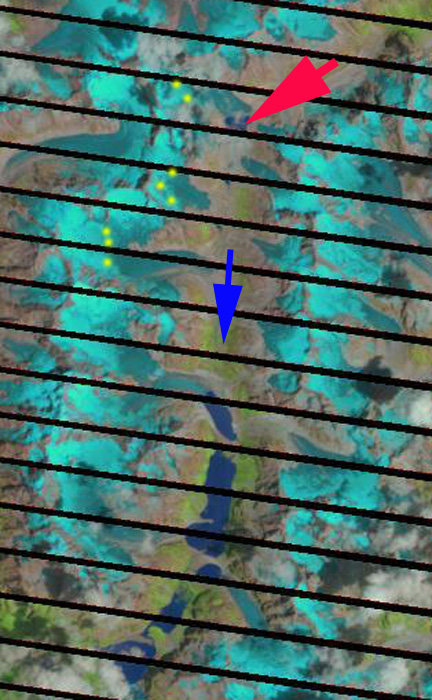
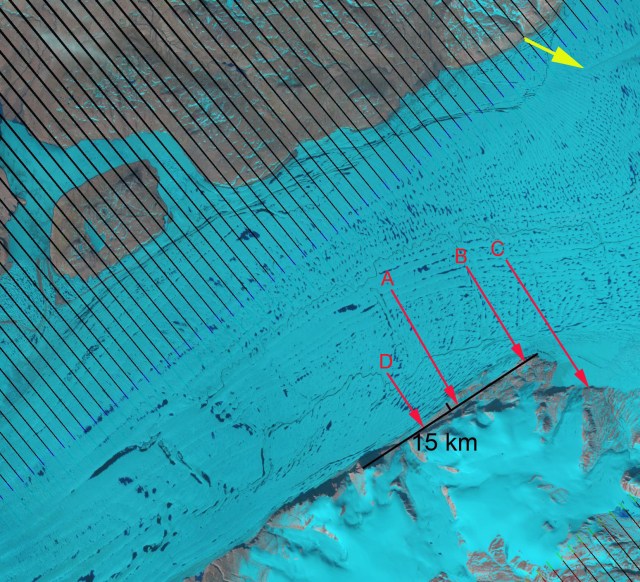
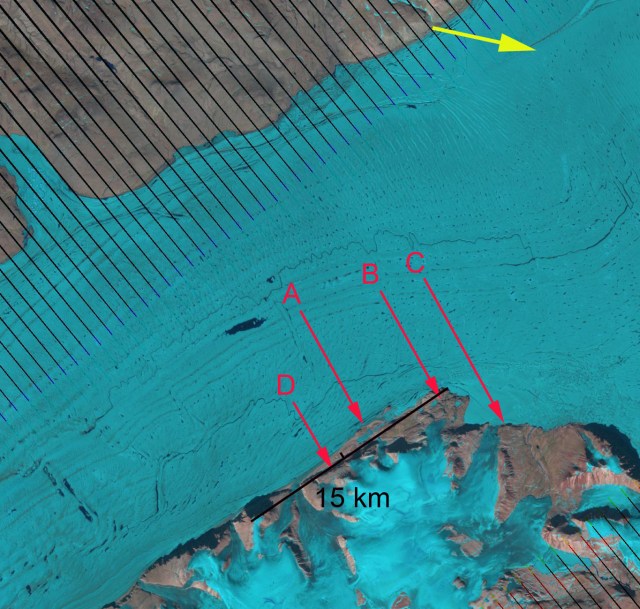
Here we pay particular attention to a section of the glacier that is 20-40 km from the calving front. A series of Landsat images from 2001 to 2013 track specific features as they move down glacier. The features A-D are each adjacent to specific unique features, specific meanders in two supraglacial streams. The movement of these features indicate the velocity over the 12 year period in this region, approximately 600 m/year. This agrees with the more detailed analysis of Seroussi et al (2011) , Thomas et al (2009) and Thomsen et al (1997). Further the spacing of these points has not changed indicating that the glacier in this region is moving as a single unit with relatively similar velocities. Further the persistence of the same streams and the ponds indicates The surface melting has led to development of numerous ponds and streams on the surface of the glacier. The lack of drainage of these features indicates the lack of crevassing, rifting or moulins to deliver water to the base of the glacier. The Petermann Glacier had several prominent rifts running transverse to glacier flow, that were clear weaknesses that would lead to future calving. 79 Glacier lacks such large rifts, just upstream of Point A is a prominent feature that at least at this point is not a rift. Pat Lockerby has noted these features in MODIS, but given the lack of water drainage and distinct break, these are not currently cracks.

2001 Landsat image

2004 Landsat image
2009 Landsat image
2011 Landsat image
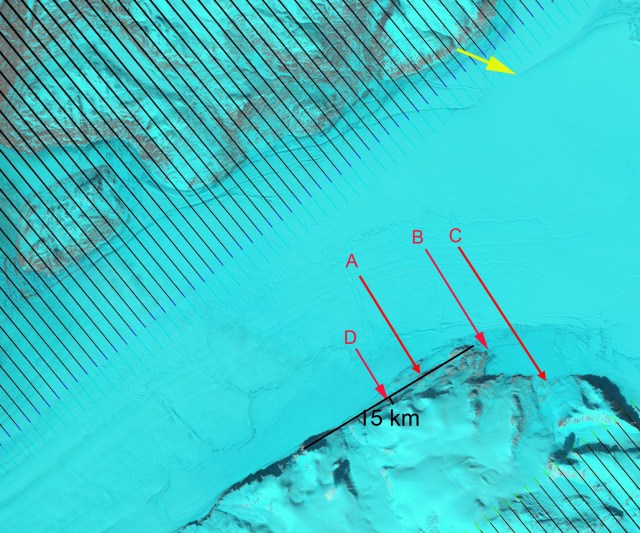
2013 Landsat image
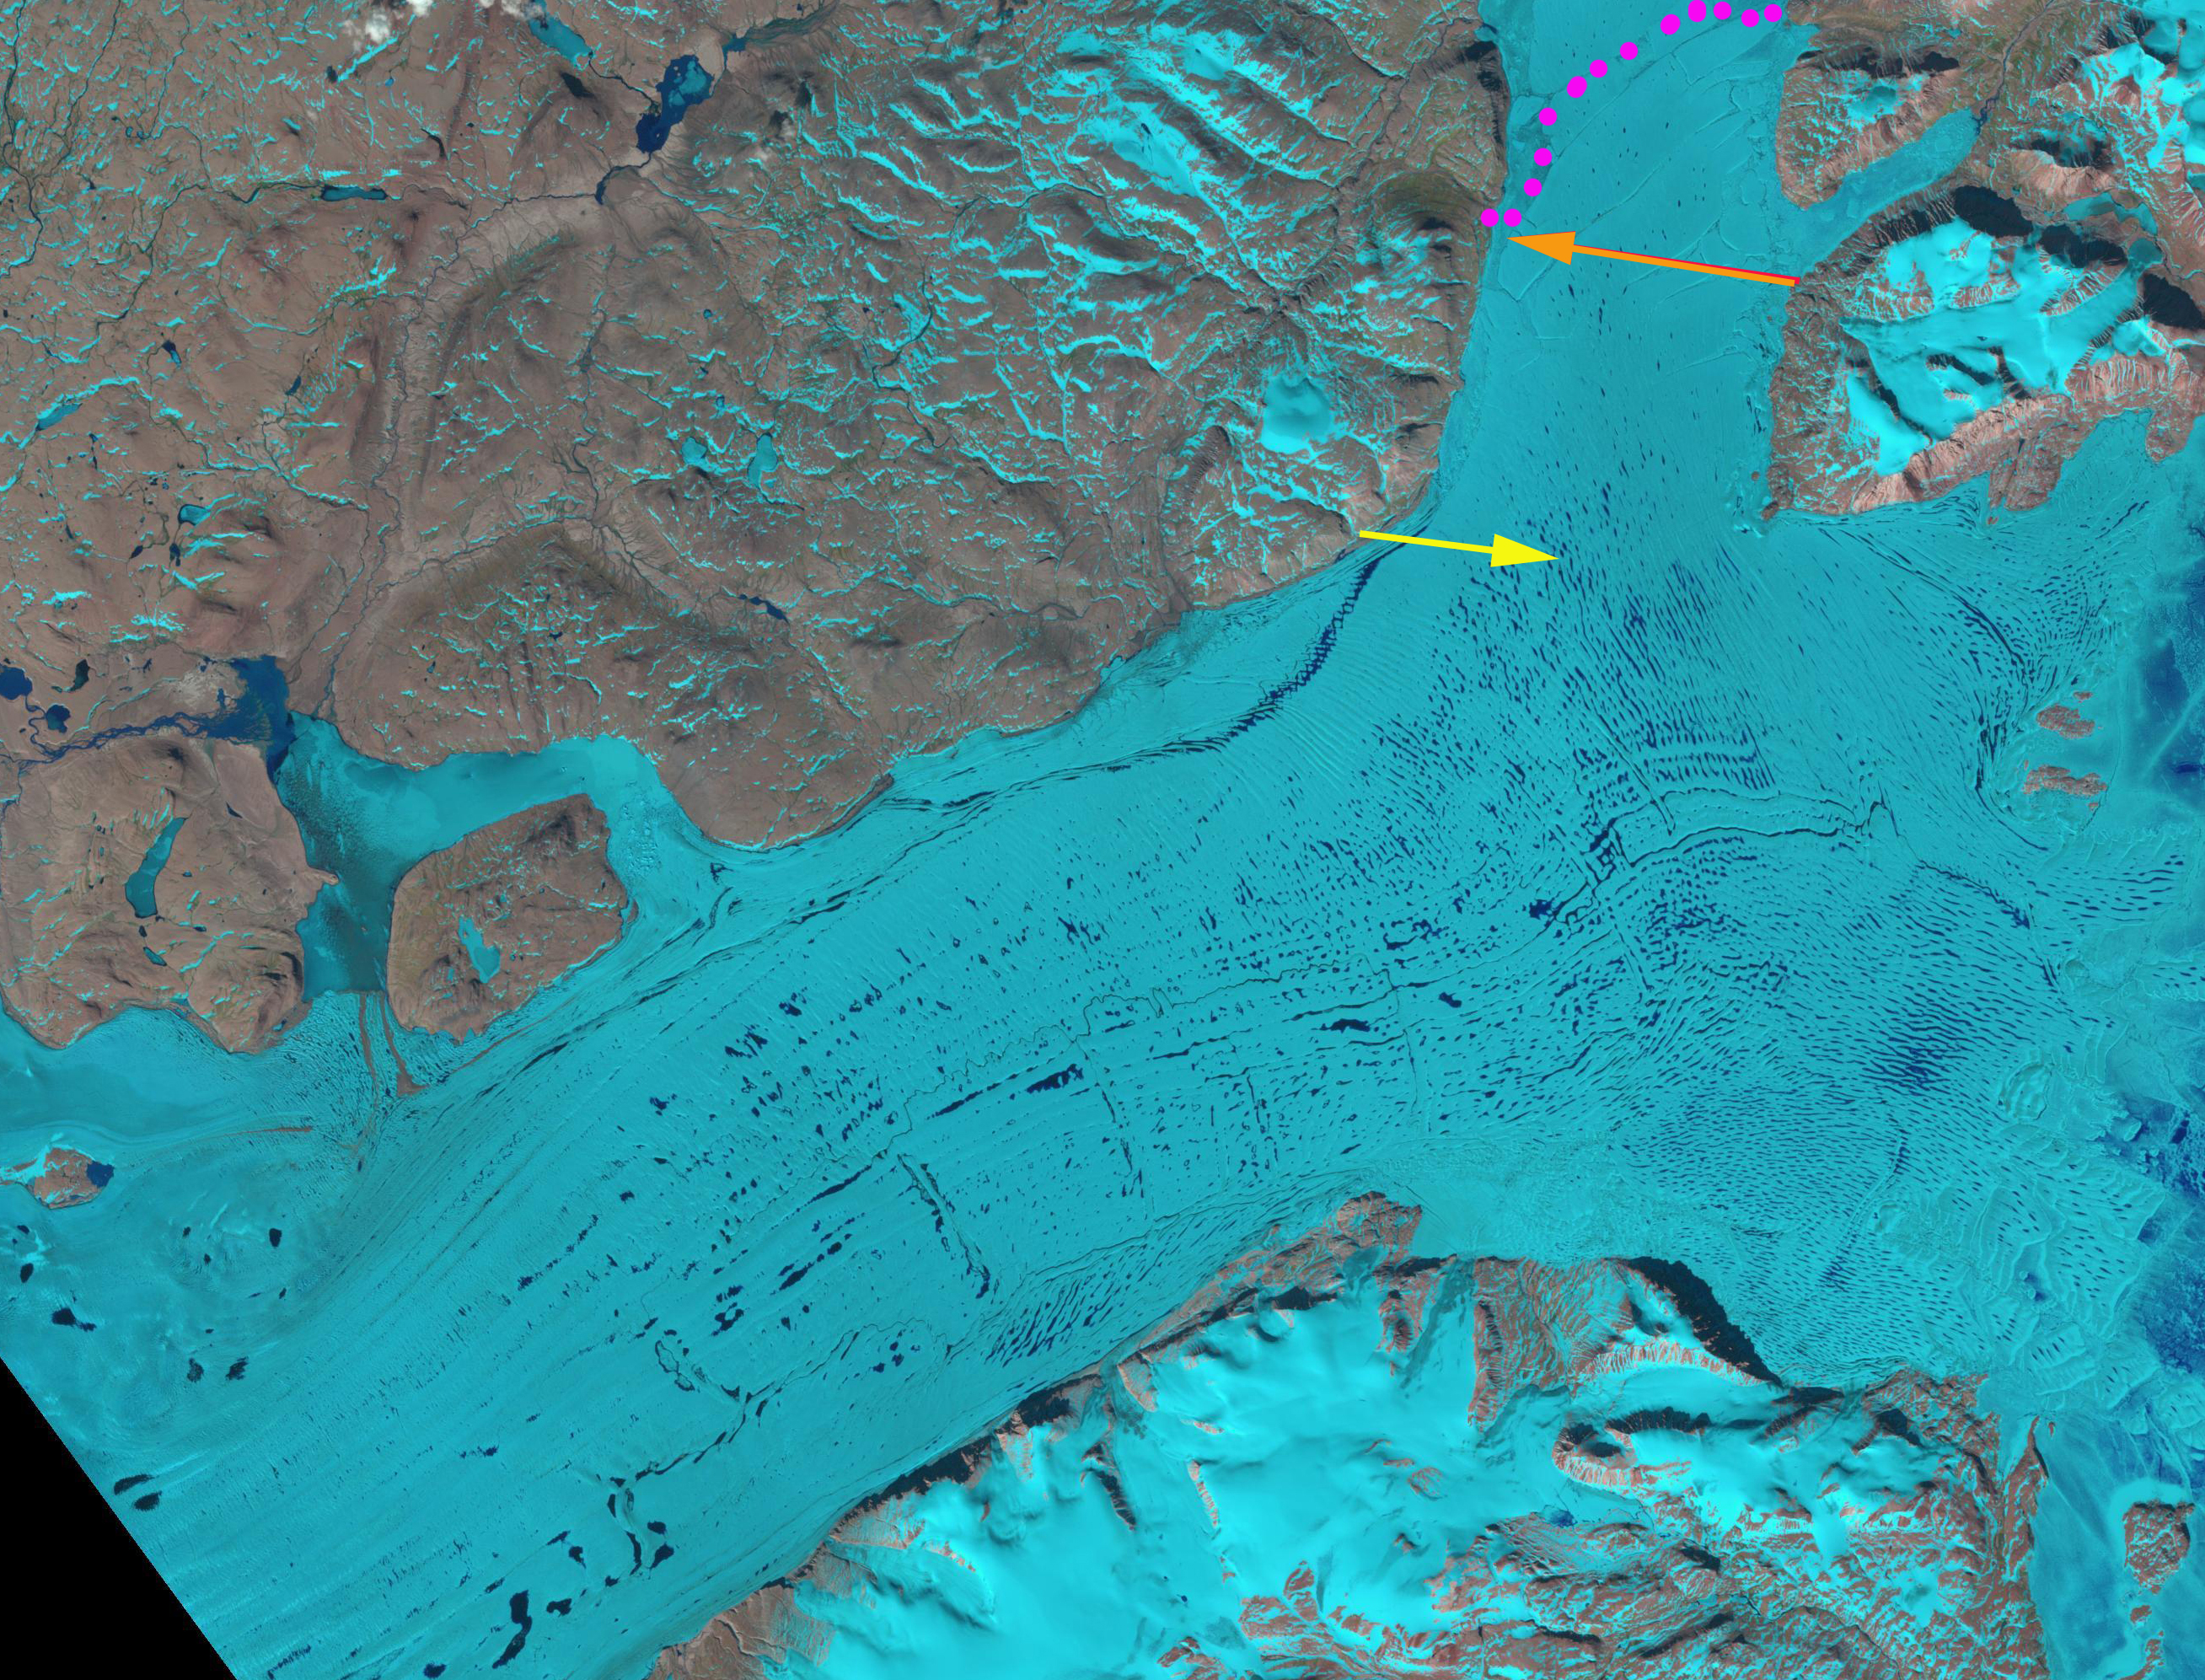
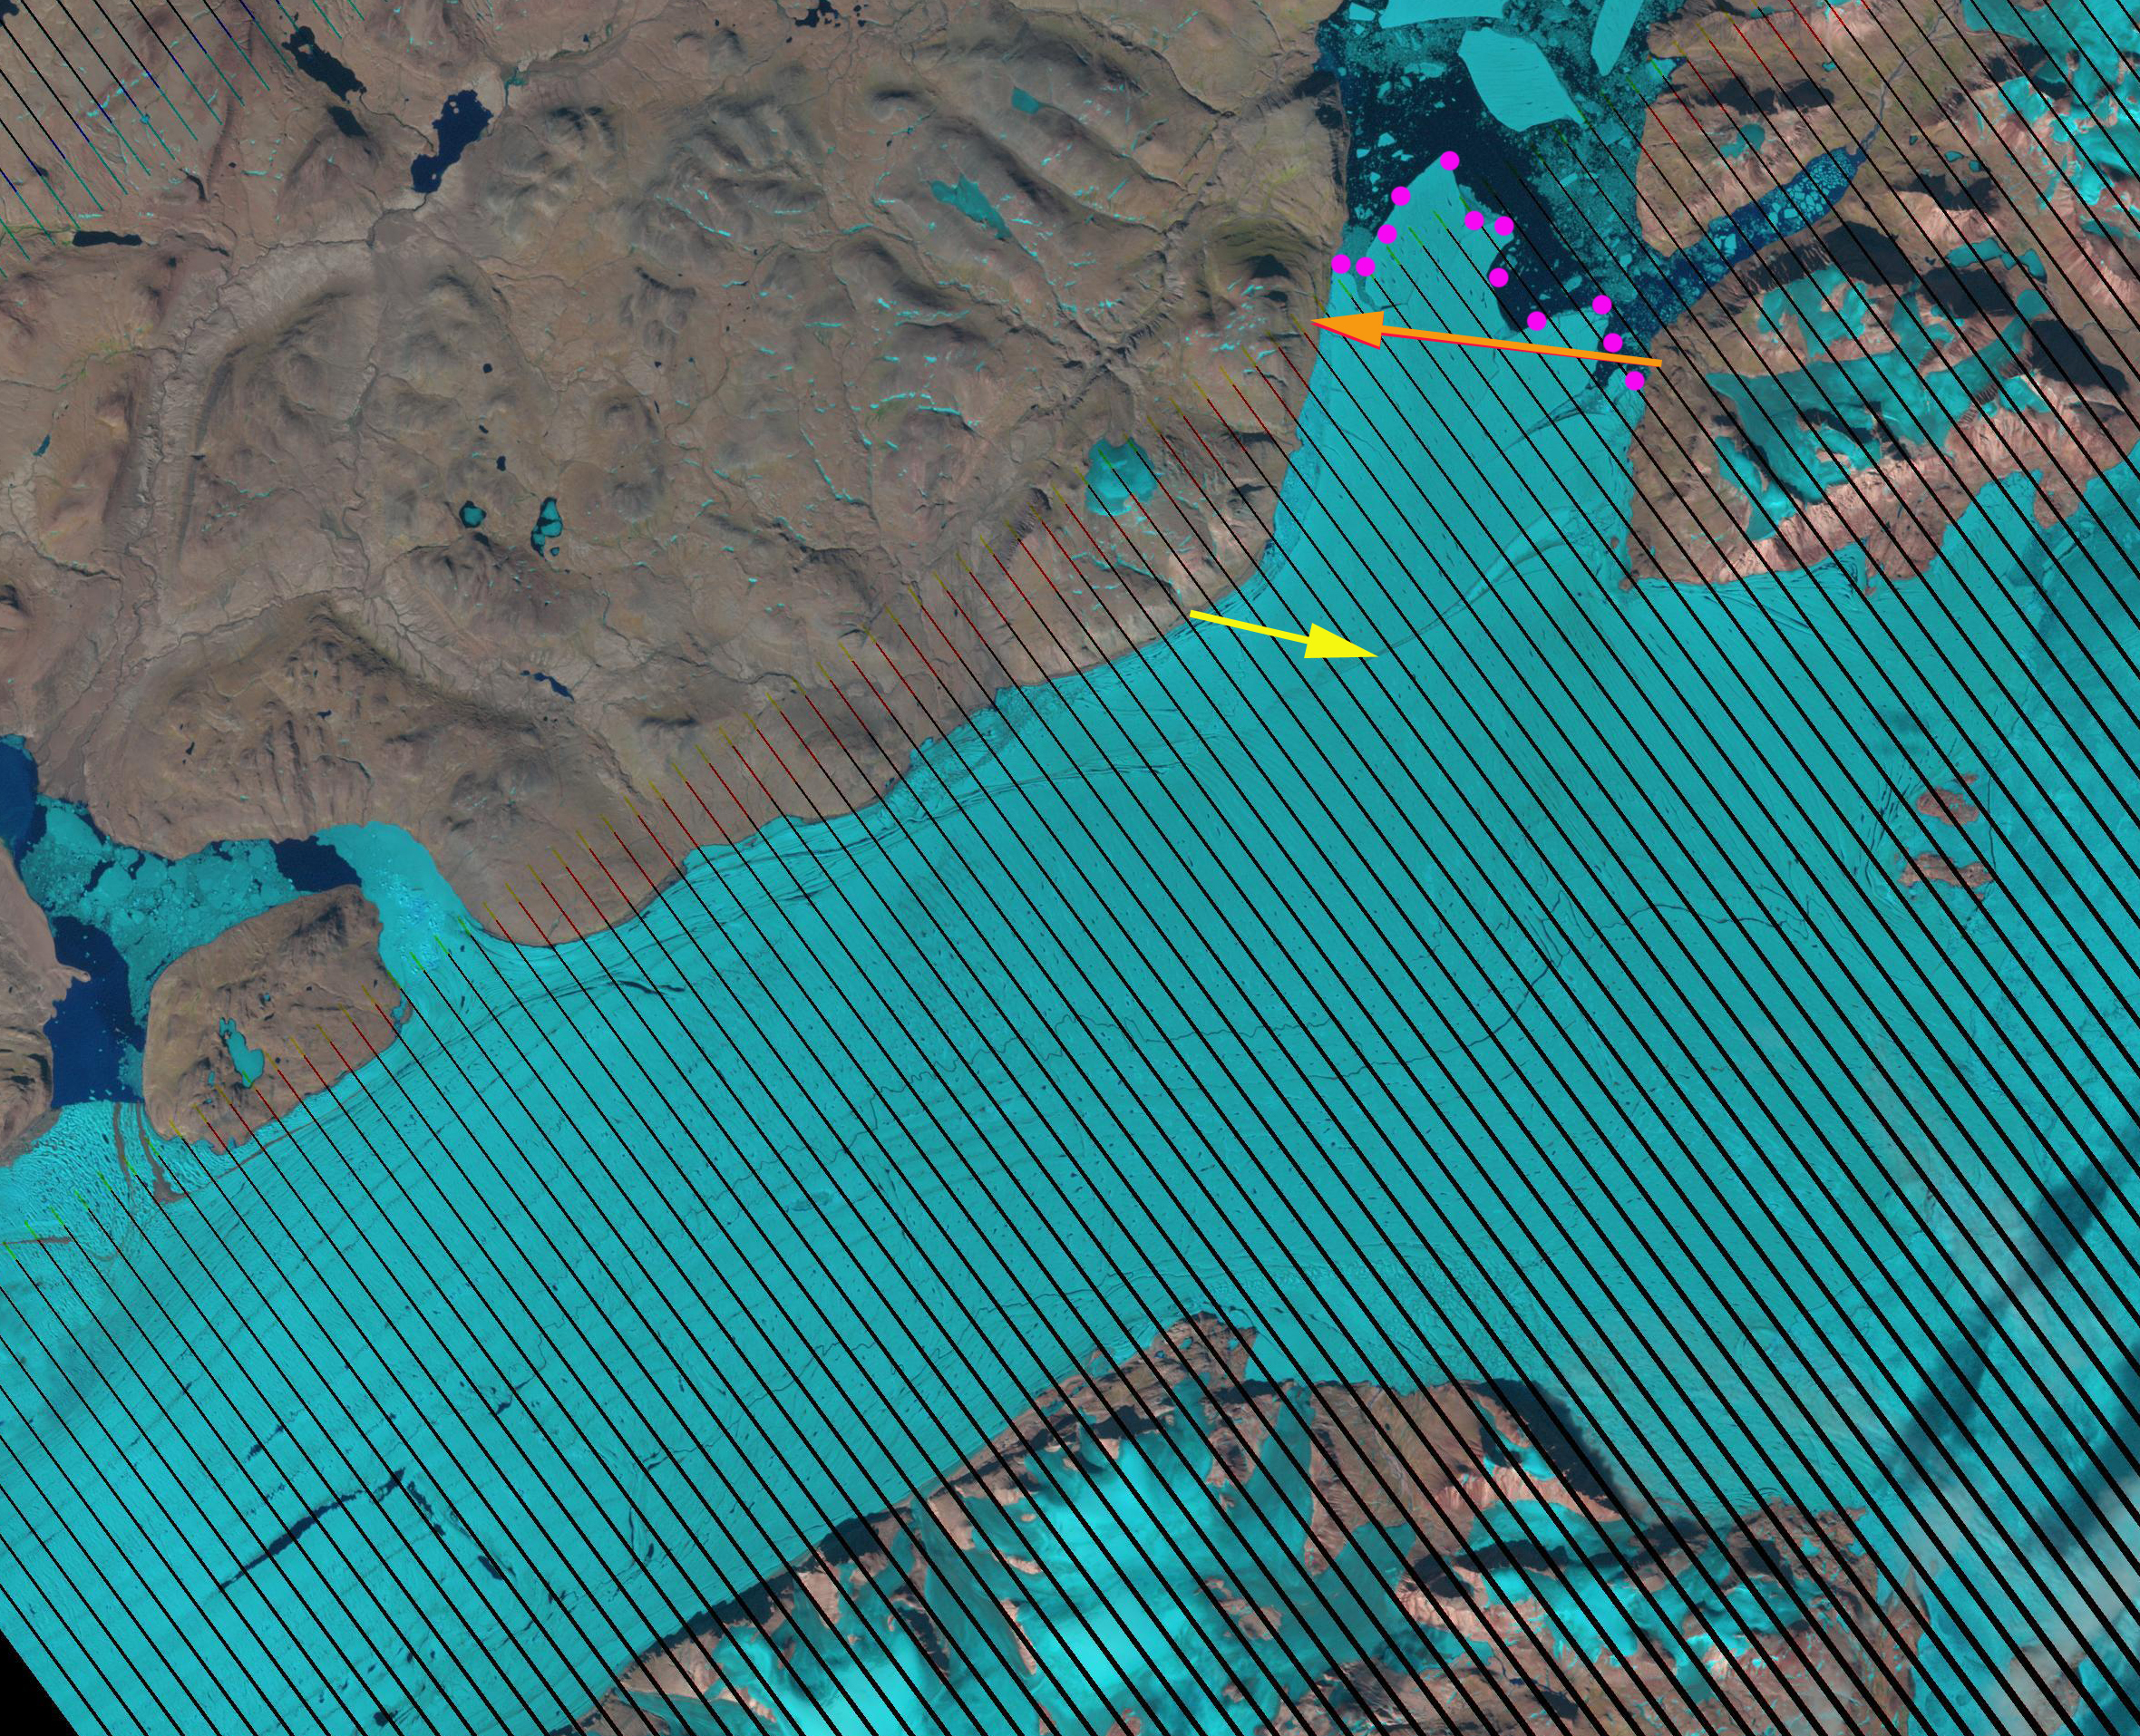
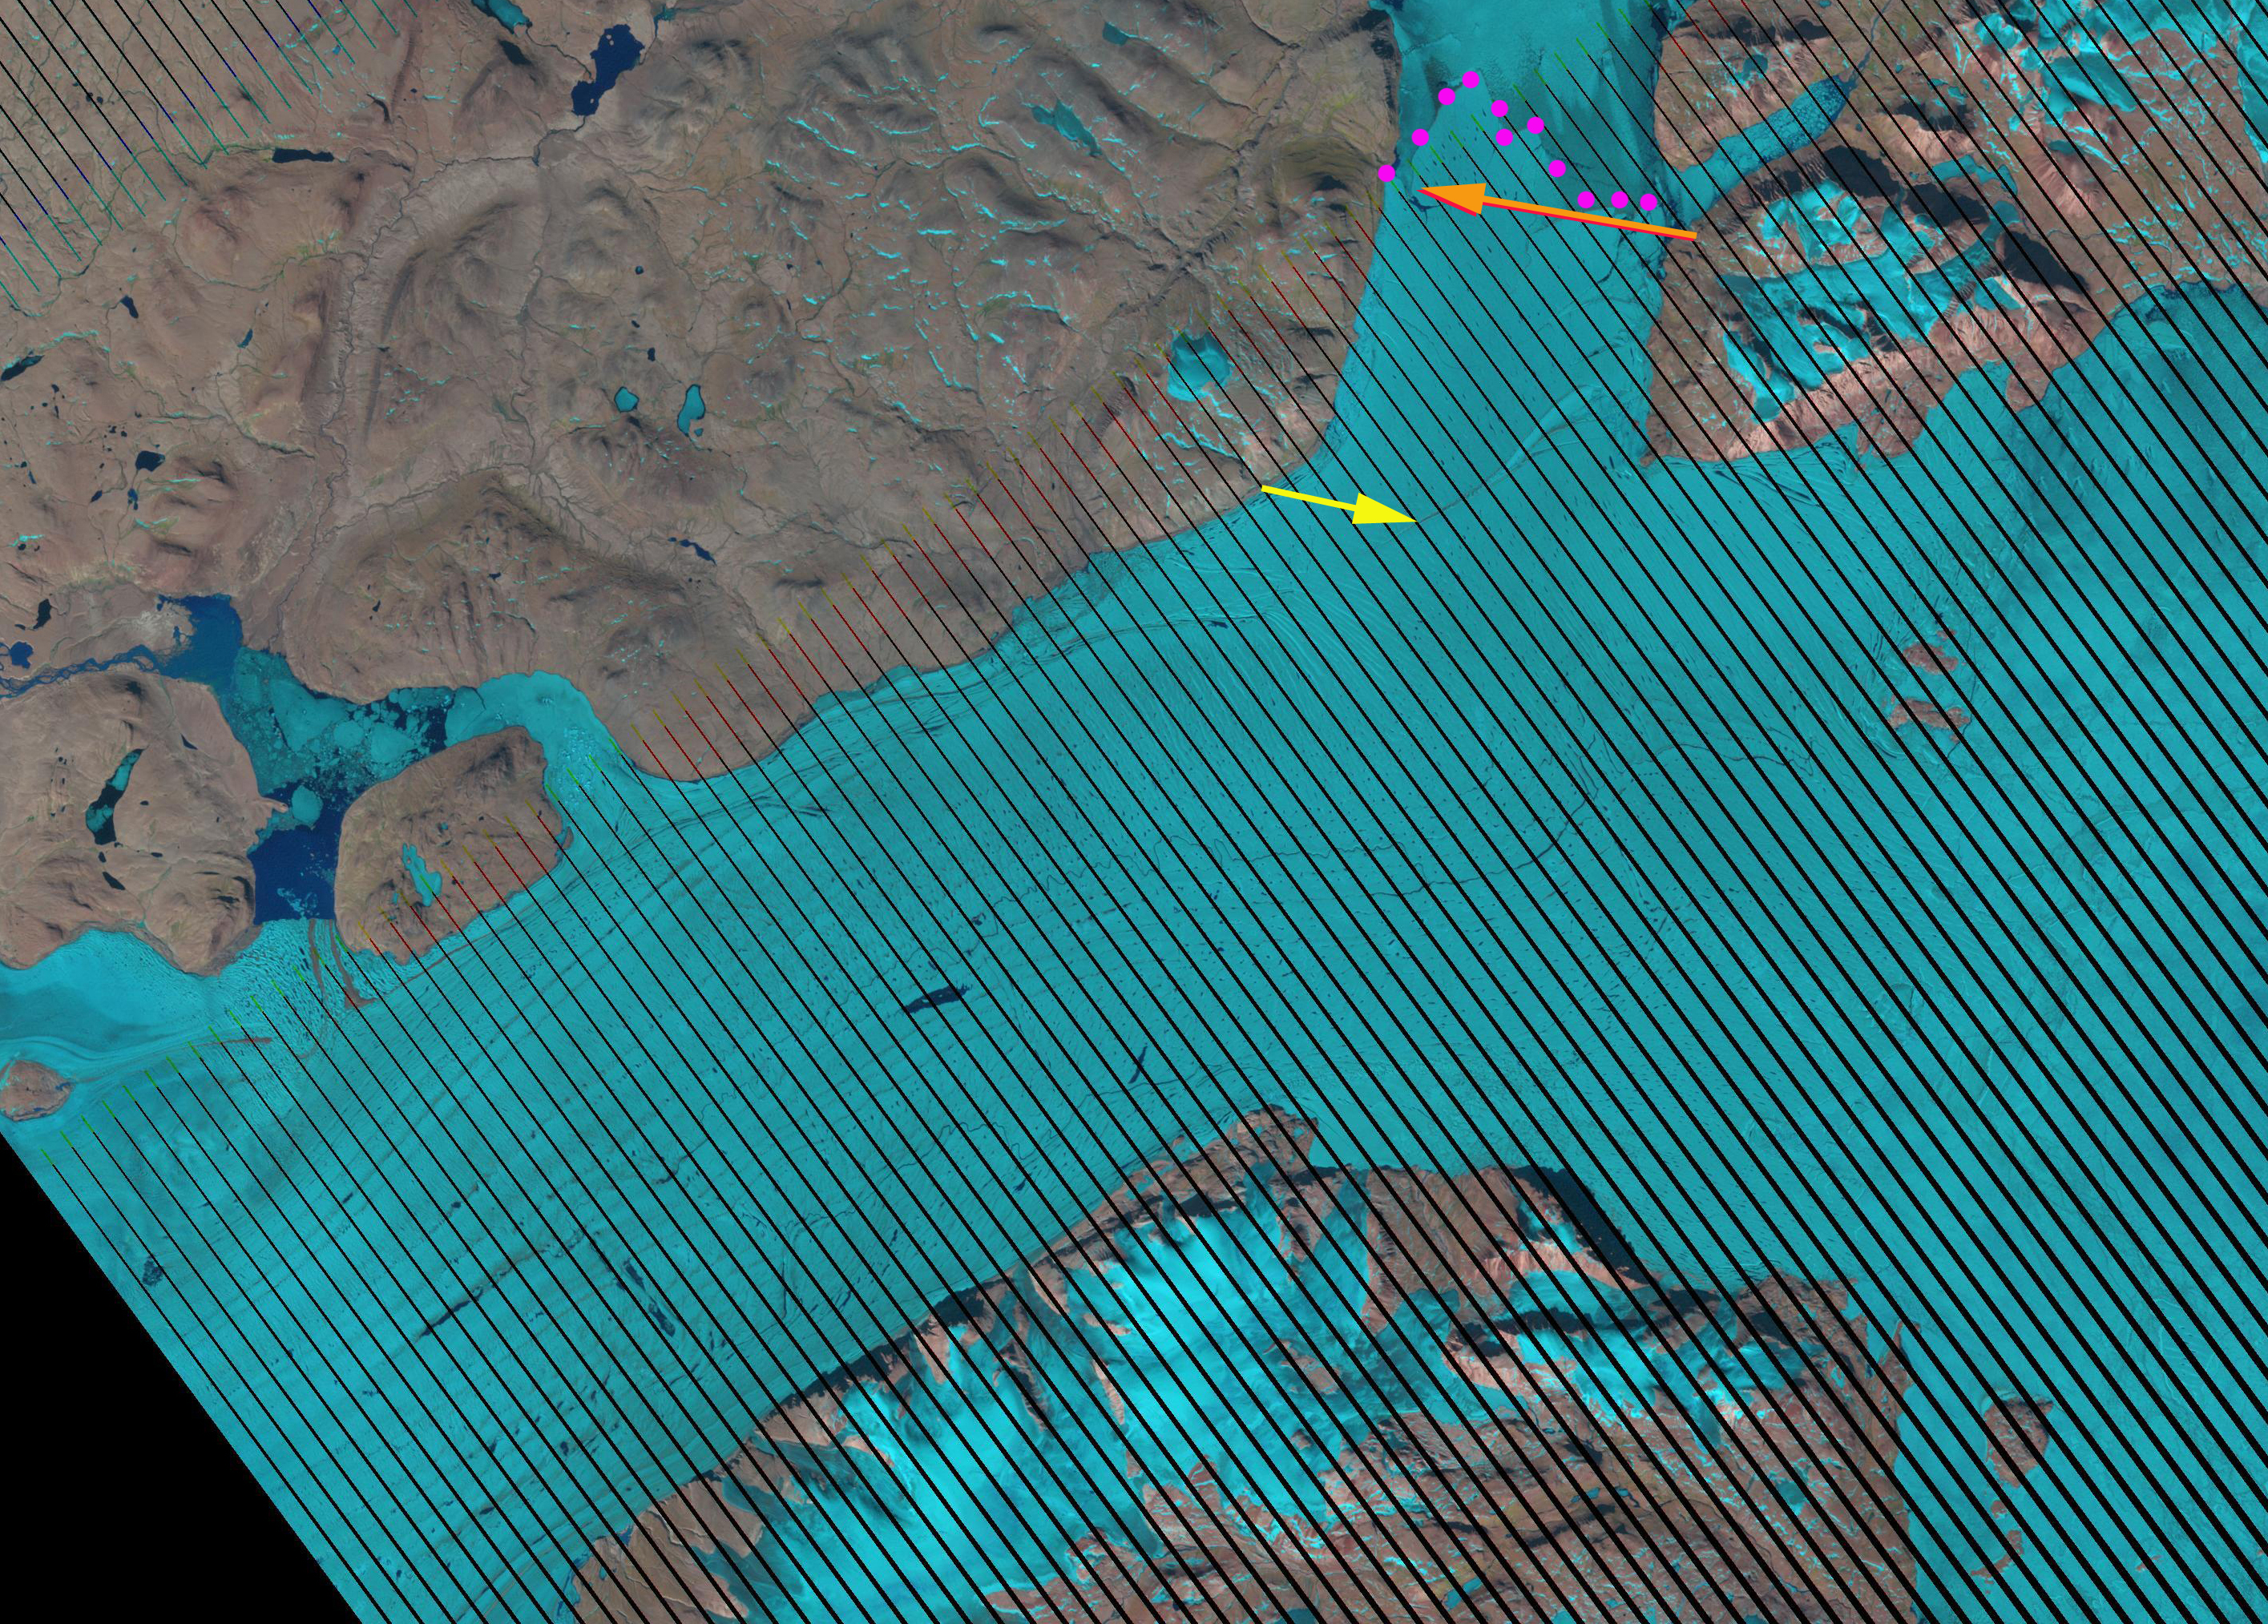
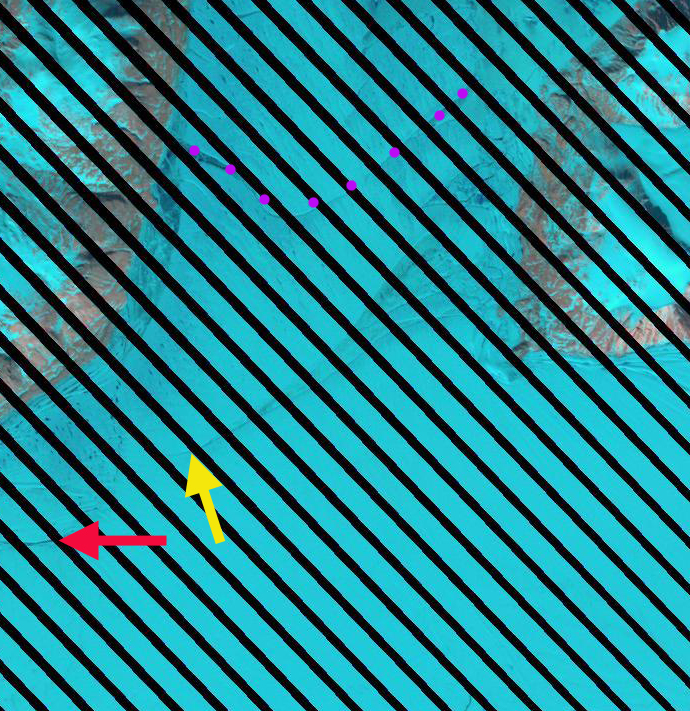
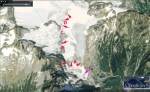
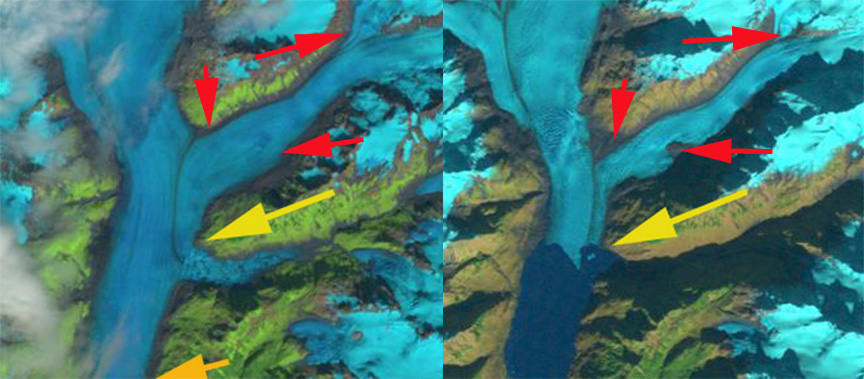
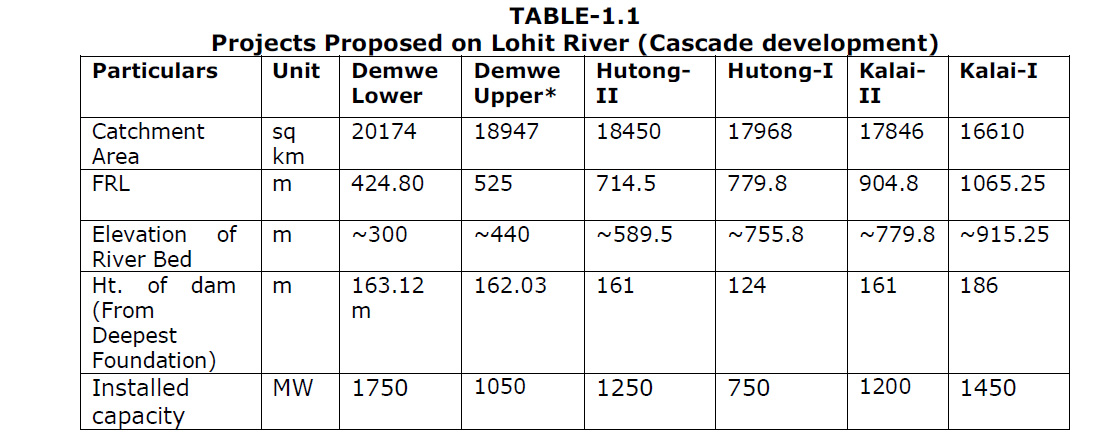
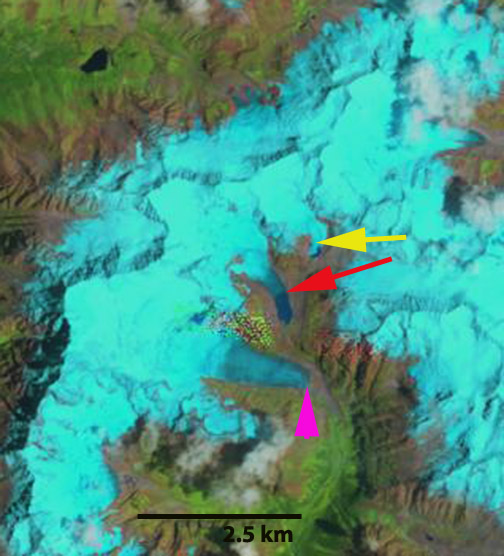
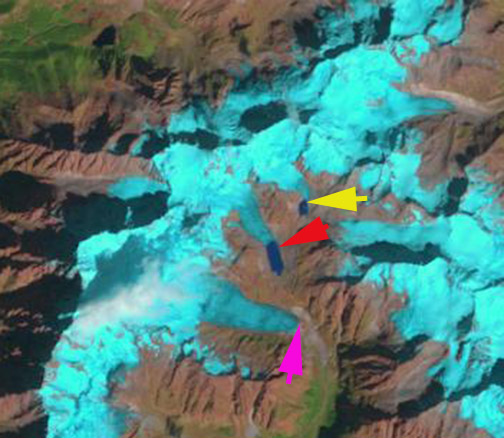
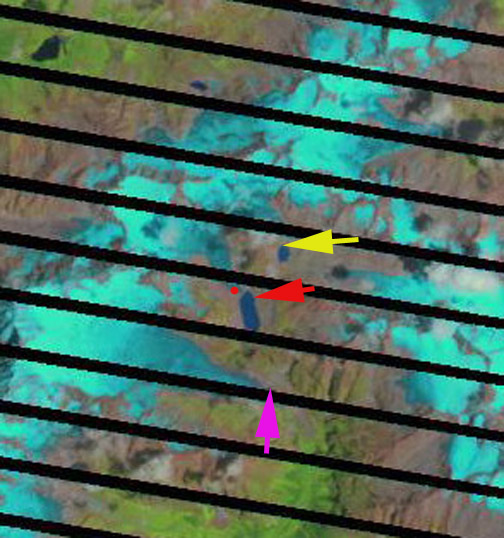
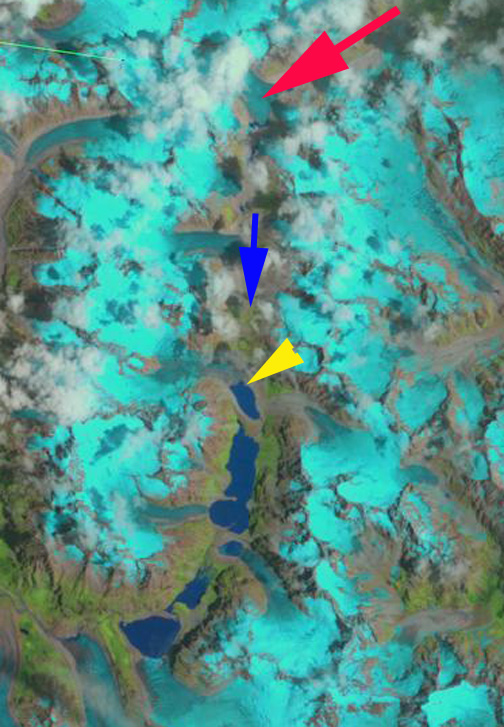
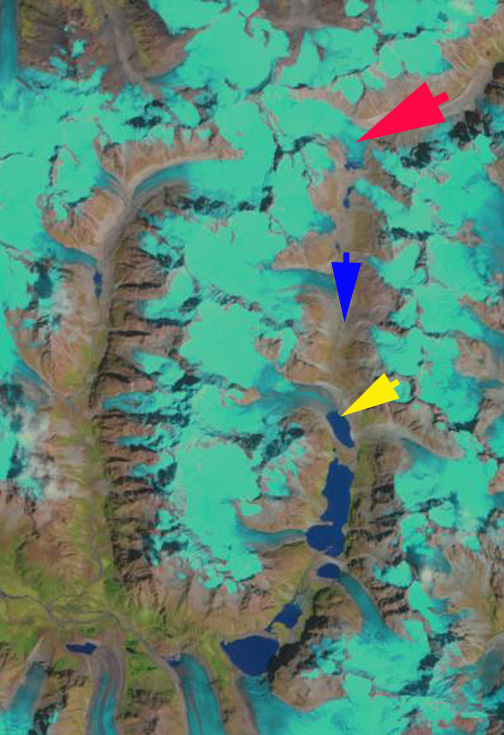
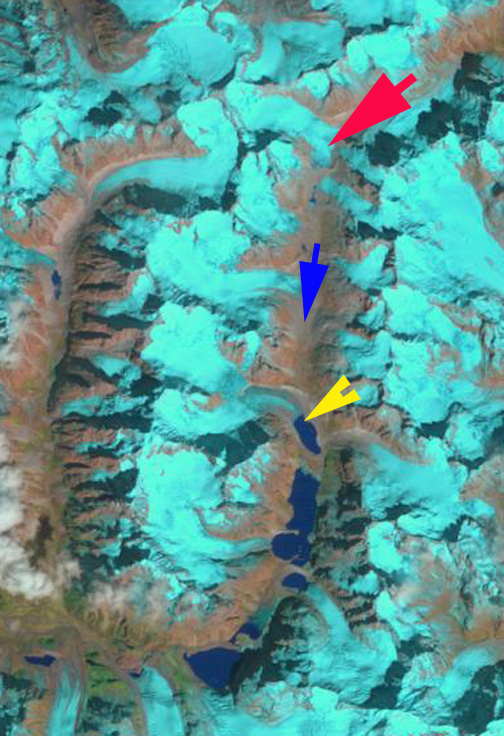
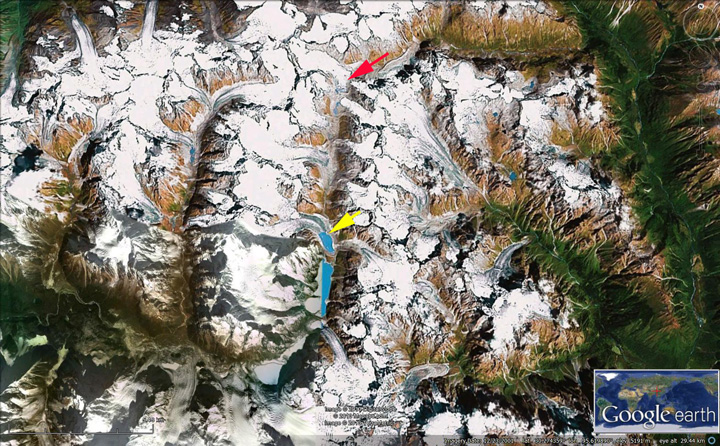
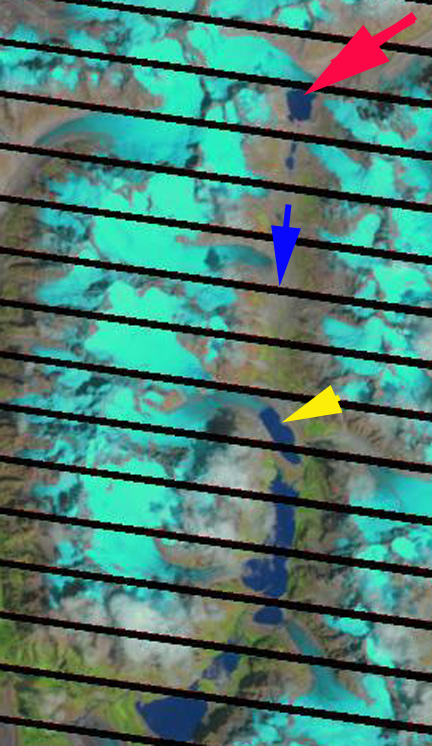
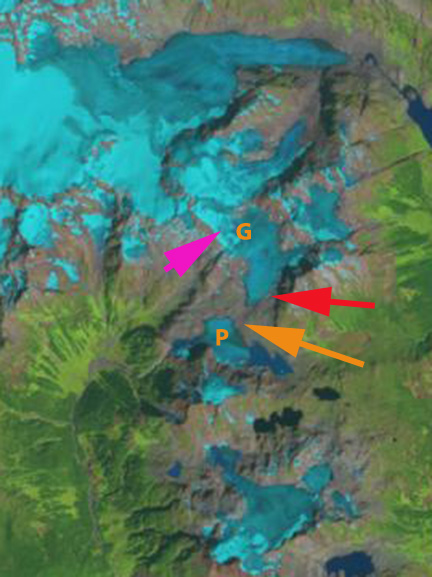
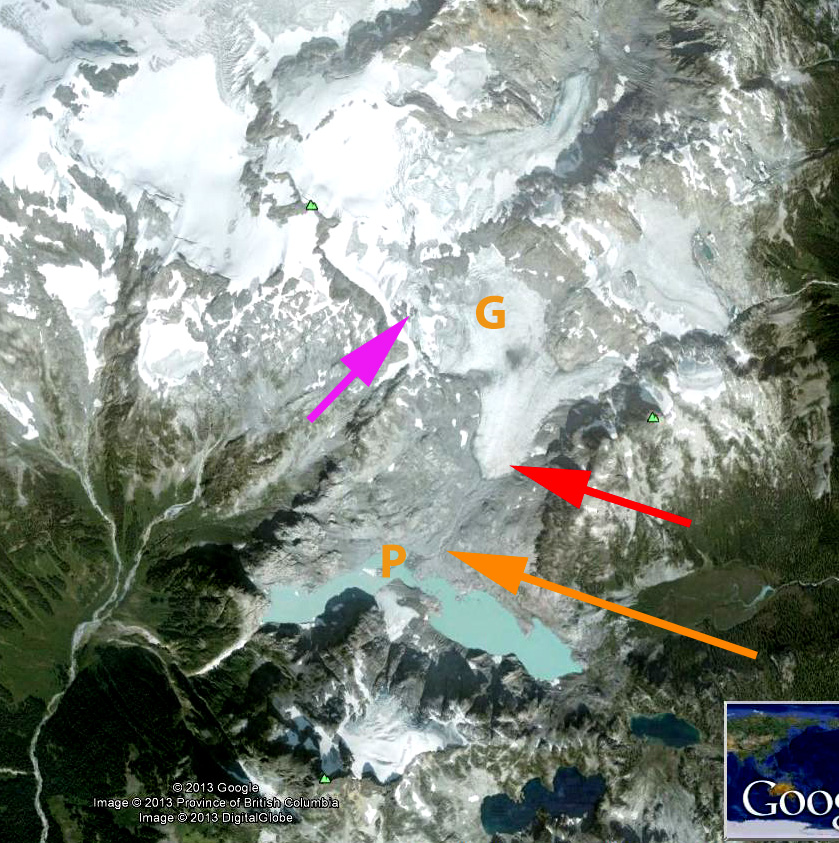
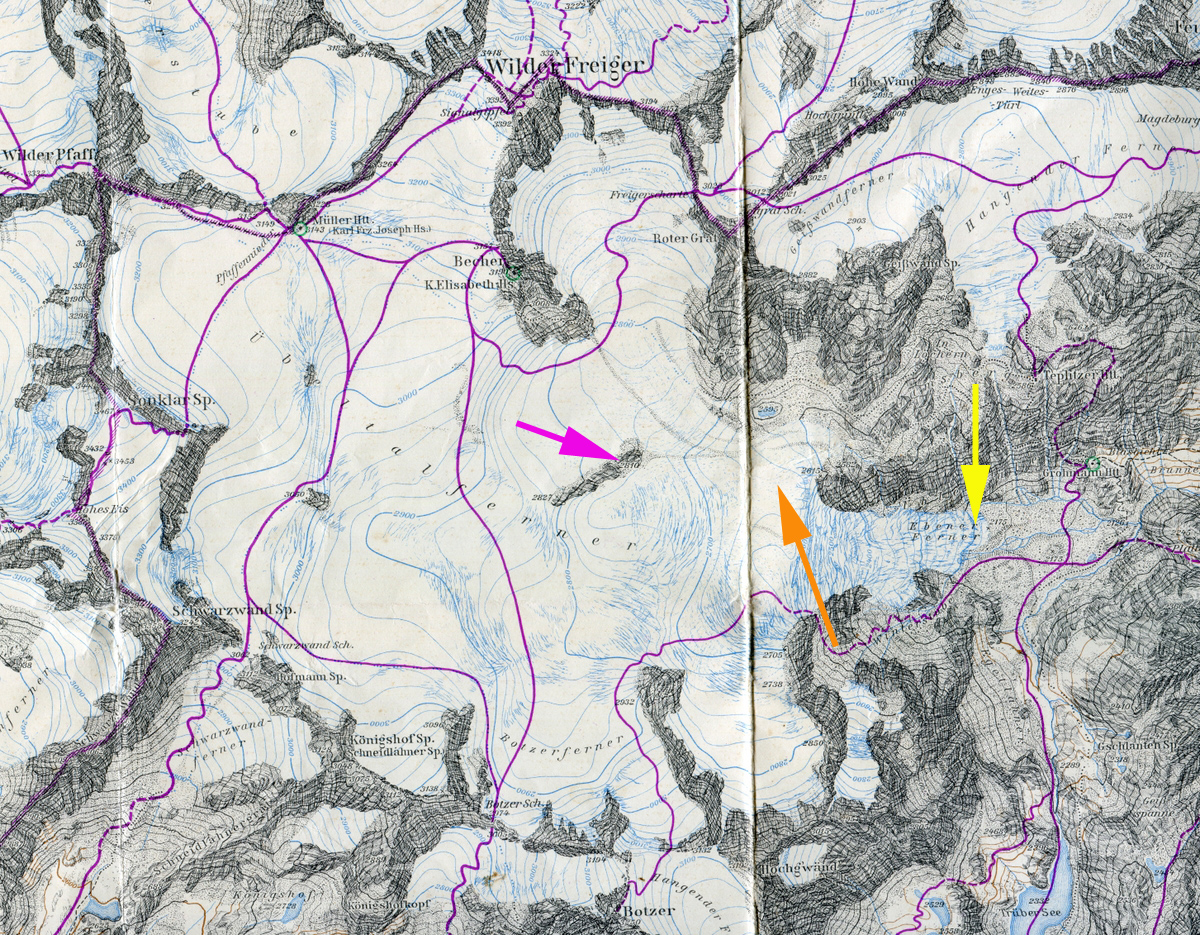
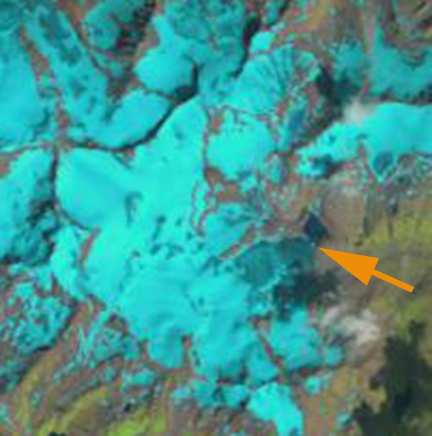
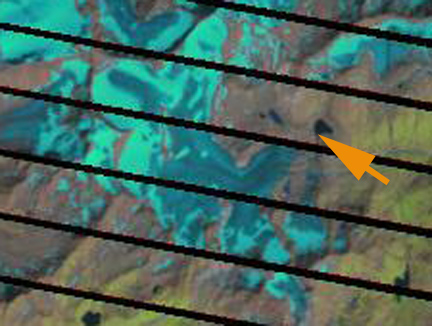
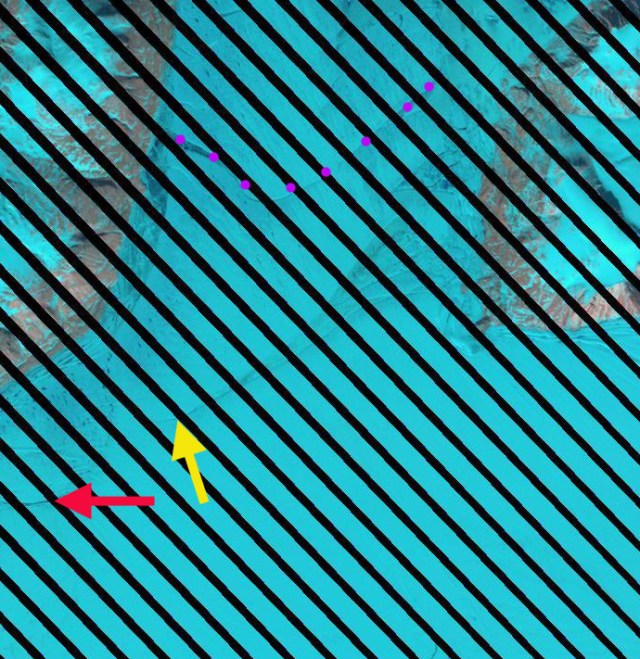
The second set of images indicates the change in terminus position at the northeastern terminus from 2000 to 2011, purple dots, often referred to as Spaltegletscher. The yellow arrow indicates a longitudinal rift that has developed since 2000 that is nearly connected to another rift near the margin of 79 Glacier. Espen Olsen at the Arctic Sea Ice Forum has suggested that this is what will lead to this area breaking off. The orange arrow indicates the same location marking the terminus of the glacier at its northwest corner. The last image is from June 16, 2013 this MODIS image indicates the two rifts red and yellow arrow at the start of the Spaltegletscher terminus. Followed by Landsat image from June 17, 2013 indicating the new terminus position more clearly and the same rifts. Another iceberg has peeled off since 2011, and the total ice loss since 2001 is 70-80 square kilometers. Jason Box, Ohio State had noted a loss of about 50 square kilometers from 2000 to 2010. Also apparent is an area of active calving and icebergs in front of Zachariae, check out the new icebergs in the June 17, 2013 Landsat atZachariae Ice Stream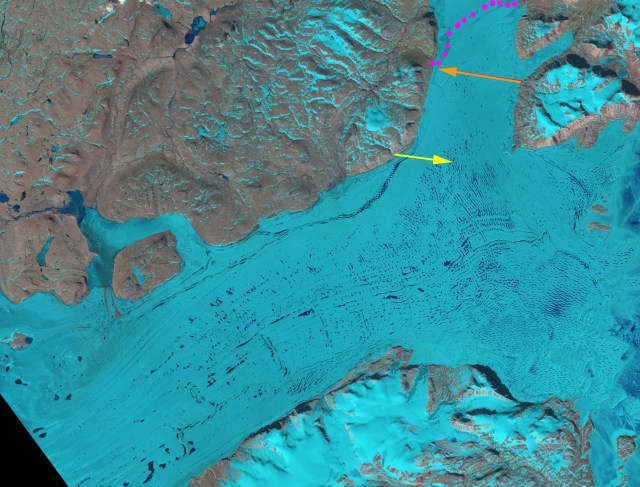
2000 Landsat image
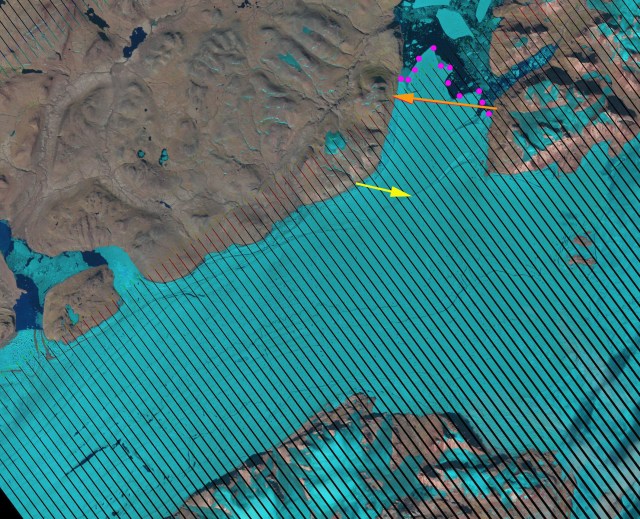
2010 Landsat image
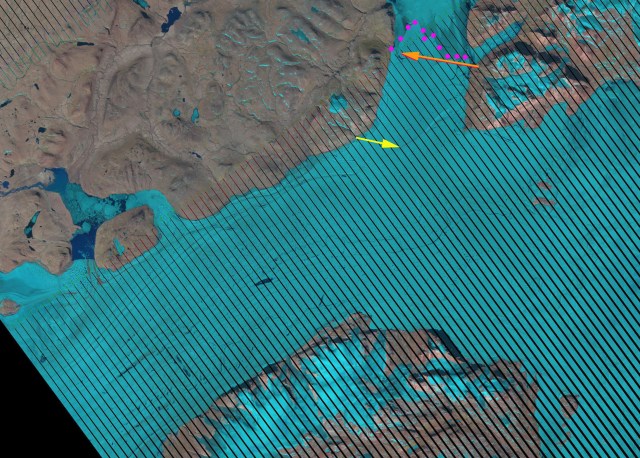
2011 Landsat image
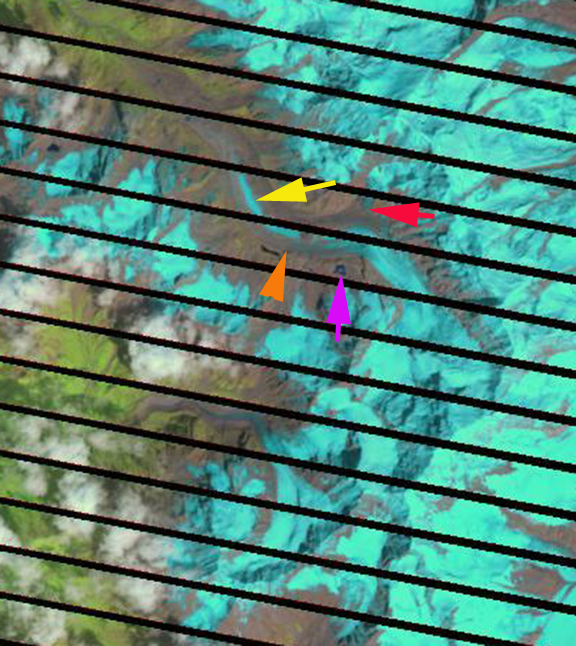
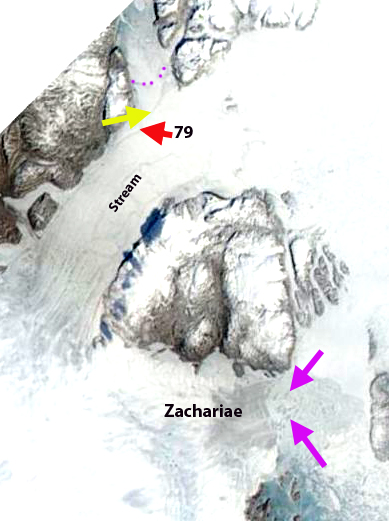
 June 16, 2013 MODIS image, yellow and red arrows indicate two rifts at the start of Spaltegletscher.
 June 17, 2013 Landsat Image