
Requiang Glacier, Tibet is just east of Shishapangma Mountain one of planets 14 8000 meter peaks and terminates in the rapidly expanding Kong Tso (lake) at 5200 meters. The glacier is fed by avalanching from the high slope of Molamenqing the eastern satellite peak of Shishapangma, the black outline is the boundary of the glacier’s watershed. The glacier has been undergoing a rapid retreat since 1977. The area of Reqiang Glacier decreased by 22.90 % and retreated 71 m/year from 1977-2003 (Che et al., 2005). A comparison of Landsat imagery from 2000, Google Earth Imagery from 2004 and Landsat imagery from 2009 and 2011 indicates a more rapid retreat has ensued of 300 meters from 2000-2004, 75 m/ year, similar to the 1977-2003 period. From 2004 to 2011 the glacier retreated 1300 meters, 185 m/year. The net retreat of 3100 meters since 1977 is close to 50% of the glacier length lost since 1977. The red arrows are just west of two ridges and point to the 2004 terminus. The 2000 terminus is right near the ridges, red line, the 2011 terminus at the green arrow and green line


 This story fits with the behavior of other glaciers in the area. For example Menlung Glacier, Tibet and Their Kang, Bhutan. In Li et al (2011) it is noted that increasing temperature, especially at altitude, the fronts of 32 glaciers have retreated, mass losses of 10 glaciers have been considerable, glacial lakes in six regions have expanded and melt water discharge of four basins has also increased. An inventory of 308 glaciers in the Nam Co Basin, Tibet, noted an increased loss of area for the 2001-2009 period, 6% area loss (Bolch et al., 2010). A look at the Reqiang Glacier with the 2011 Landsat Image superimposed and georeferenced in Google Earth, indicates how small the glacier is versus Kong Tso and its previous size. Given the access to high elevation avalanching, this glacier seems unlikely to disappear; however, its retreat is indicative of warming even at higher elevations.
Category: Glacier Observations
Post detailing changes in a glacier
Tyndall Glacier Retreat, Kenya
The snows of Mount Kilimanjaro are more famous, but Mount Kenya is even closer to the equator and host to a number of glaciers that are rapidly diminishing. The Tyndall Glacier is the second largest glacier on the mountain. Stephen Hastenrath, University of Wisconsin in particular has documented the changes of Mount Kenya glaciers. In a color version of the map from the WGMS FOG 9that Hastenrath produced on page 9 of the link above the changes in the glacier from 1893 to 2004 are shown. The glacier retreated from Tyndall Lake in the late 1920’s.  By 2004 the glacier was 275 meters from the lake. In the more recent Google Earth imagery the retreat is 360 meters Mizuno (2005) observed retreat rates of 3 meters per year from 1958 to 1997 and 10 meters per year from 1997-2002. The Google Earth imagery of 2011 indicates that the terminus is still retreating at 9-10 meters per year. The photographic sequence below from Mizuno (2005) indicates considerable thinning of the glacier even its upper reaches. This suggests the glacier not only has strong negative mass balance but also lacks a persistent accumulation zone, without which it cannot survive (Pelto, 2010). The last image below is the current Google Earth view tilted to provide a comparable view to the time sequence.

 Mizuno (2005) also focussed on the vegetation of the newly deglaciated terrain observing that pioneer species such as groundsel , alpine rockcress, mosses, and lichen recolonized the area at a rate similar to the glacier retreat rate. The first colonizers developed within five years of glacier retreat. Hastnerath (2006) observes that increased net shortwave radiation led to the initial recession in the late nineteenth century and that recently the increased retreat on Mount Kenya is due to the greenhouse effects. The retreat of Mount Kenya glacier is similar to the scale seen in the Rwenzori Range. The largest glacier on Mount Kenya is Lewis Glacier which averages just 18 meters in thickness and has lost 90% of its volume since 1934. This suggest Tyndall Glacier is also quite thin (Prinz et al, 2011).
Taconnaz Glacier Retreat, Mont Blanc, France
The Taconnaz Glacier flows from 4300 m to 2000 m down the west side of Mont Blanc, from the Dôme du Goûter toward the Chamonix Valley. This glacier is best known for the large avalanches that are generated by the break off of large serac ice blocks from a wide ice cliff at 3300 m during the winter, blue arrows (Le Meur and Vincent, 2006).  The ice blocks have been devastating to inhabited areas of the Chamonix valley as recently as 1999. A comparison of 2004 and 2009 imagery in Google Earth indicates that the main terminus (A) has retreated 200 meters in five years. The orange line is the 2004 margin and 2009 is the red line. Taconnaz is two glaciers south of Mer de Glace, which retreated 500 m from 1994-2008, and several glaciers south of Glacier d’Argentiere, which retreated 400m from 2000-2010. There has also been a large retreat in the vicinity of Point B which is where a secondary terminus used to be connected to the main valley glacier. This retreat indicates that above the terminus there is a reduction in the volume of ice heading down valley. This suggest retreat will continue.

The avalanche hazard has prompted construction of avalanche defenses that are well documented in photographs, such as the one below. This site on Mont Blanc glaciers also has nice images of the terminus glacier from 2010 indicating a much more robust terminus than Mer de Glace, based on the crevassing and glacier thickness. The avalanche protection worked in 2006 slowing an April avalanche. 

Rohss Bay Glacier Retreat, James Ross Island, Antarctica
In January 1995 the Prince Gustav Ice Shelf connecting James Ross Island to the Antarctic Peninsula collapsed (Glasser et al 2011). One of the principal glaciers feeding the iceshelf was the outlet glacier from Rohss Bay on James Ross Island. By 1999 this outlet glacier terminus was at the outlet of Rohss Bay. From 1999 to 2009 Rohss Bay opened up as the Rohss Bay glacier retreated 15 km. This retreat represents part of the extensive ice loss, 490 square kilometers for the island from 1988-2009 Davies et al (2011). From 1988-2001, 91 of 100 glaciers on the island examined by Davies et al (2011) retreated. Imagery from the field work by the LARISSA project in the region provides excellent context for the region. A combination of Landsat and Google Earth Imagery from 1999, 2000, 2008 and 2010 illustrates this change in a sequence below. The margin is indicated in each case as is an unnamed island by an arrow at the southwest end of Rohss Bay. Most of the ice loss was the breakup of a floating ice shelf in the bay. 


 Glasser et al (2011) provide a sequence from 2002-2006 that illustrates most of the retreat occurring in this five year period. Currently most of the floating ice of the bay has been lost and retreat should slow down considerably. The ice was lost not through surface melting, but via calving. The typical sequence for ice shelf collapse is thinning from basal and surface melt increases, that leads to weakening and destabilization of the iceshelf, expansion of rifting and then breakup. The retreat on James Ross Island is also observed on the island to the north Vega Island.
Tunsbergdalsbreen Glacier Retreat, Norway
The Norwegian Water Resources and Energy Directorate (NVE) has an excellent glacier monitoring program. Of these ten drain the largest ice cap in Norway the Jostedalsbreen, from 2008-2013 the net change was retreat on all 11. The largest outlet glacier Tunsbergdalsbreen is not one of the closely monitored glaciers. This glacier flows southeast from the icecap, is 18 km long and terminates at 670 meters in a new proglacial lake.
Examination of Tunsbergdalsbreen in Landsat imagery from 1989, 2003, 2011 and 2014. The violet arrows indicate the terminus. In 1989 no lake is evident. By 2003 the lake has begun to develop and has icebergs in it. In 2011 the lake is 400 meters across and has numerous icebergs in it. In 2014 the lake has expanded to a length of 700 m. The glacier is fed by several tributaries coming off the ice cap. At the #3 green arrow, bedrock is by 2010 in the midst of an icefall from the upper ice sheet that was underneath the glacier in 1989 and 2003. At green arrows #1 and #2 the area of bedrock exposure is expanding, indicating thinner and less ice draining from the ice cap into the tongue of the Tunsbergdalsbreen. In 2003, 2011 and 2014 the snowline is at 1450 m, too high to sustain the glacier, the negative mass balance will drive further retreat.

1989 Landsat image

2003 Landsat image

2011 Landsat image

2014 Landsat image
A closeup of the terminus from Google Earth indicates a number of debris covered ice bergs in the lake. This combined with the observed thinning upglacier indicates that retreat will continue. Exposure of bedrock upglacier occurs because of thinning, which only occurs because of mass balance loss which also results in velocity and discharge reductions.
At present the Tunsbergdalsbreen is the focus of an ongoing field project that aims to monitor the glacier on an annual basis documenting the impact of climate change. This project is focussing on monitoring the elevation of the glacier surface, the ice velocity and the front position. Video of the project are also worth examining. In two of these images below, the red arrows in each indicate the thin relatively uncrevassed lower reach. The low slope suggests the lake basin will continue to expand as this area is lost. These are 2013 images and in fact some of this retreat has occurred. Upglacier of the red arrows there is limited crevassing but the slope does increase.
In 2010 -2014 glacier mass balances across Norway were negative. The nearby Sporteggbreen Glacier is experiencing signficant area and volume loss.

2012 Google Earth Image.
Images above from Pål Gran Kielland at the Norsk Bremuseum, a partner in the Tunsbergdalsbreen Project.
Penny Ice Cap southwestern margin retreat
Examination of 1991 and 2009 Landsat imagery highlights the retreat of the Penny Ice Cap at its southwestern margin. The glaciers and lakes in this region are unnamed. The Penny Ice Cap is one of two large ice caps on Baffin Island and is the southernmost of the two, with an area of more than 5600 square kilometers. On the east side the glacier exit the ice cap through spectacular mountains. The westside spreads across rolling upland terrain. In this post we examine the margin at the southwest corner, where the ice cap ends in a series of upland lakes. Changes in the margin are identifed from Landsat images from 1991-top, 2003-middle and 2009-bottom. The snowline in this region is near 900 meters in the 1991 and 2003 images. In the 2009 image the snowline is at least 1100 meters leaving the southwest corner of the Penny Ice Cap with a minimal accumulation zone. Zdanowizc et al (2012) note that in recent years the ice cap has experienced heightened melt and that little retained snowpack survives the summer, that most of the retained accumulation is refrozen meltwater (superimposed ice). In each image key locations are indicated: the nunataks are marked with violet arrows as is the margin downstream of the nunataks, key islands and peninsulas are noted with green arrows that are at the 1991 margin, the orange arrow indicates a region just east of a key marker lake. Landsat imagery from 2003 and 2009 indicates the same locations. It is evident that new islands, lakes and peninsulas are developing.

 The retreat and formation of new lakes at the orange and violet marginal arrow are apparent the appearance of new islands in the lakes at the green arrows is also evident. One of the largest marginal changes is downstream of the nunataks. In 1991 the margin here had no notable indent from the rest of the margin and the glacier surface was not notably debris covered. In 2009 the margin has developed a new lake as an indent has formed and the glacier surface has more evident debris. This debris is too thin to insulate the ice underneath and instead will reduce the albedo and enhance melting. The nunatak is also expanding particularly toward the margin.
  Overlaying the 1991 and 2009 images in Google earth provides comparison of the margin of 1991 to the Google Earth imagery and 2009 imagery. The retreat along this section of the ice cap is 300-400 meters during this 18 year period.
 The driving force has been an increase in temperature and this has caused mass losses on ice caps throughout the Canadian Arctic (Gardner, et al. 2011) and (Sharp et al, 2011). The mass losses of the Penny Ice Cap are also affecting the eastern margin around Coronation Glacier.
Ngozumpa Glacier Retreat Tongue Disintegration, Nepal
Ngozumpa Glacier (also Ngozumba) is a large debris covered valley glacier draining south from Cho Oyu and Gyanchung Kang one valley west of the Khumbu valley. The lower kilometers of this glacier is heavily debris covered, similar to the Khumbu Glacier and Imja Glacier.  Above image from Doug Benn. From the terminus at 4700 meters to 4900 meters a distance of 8 kilomters the glacier is increasingly riddled with supraglacial lakes (lakes on top of glacier) as this section downwastes. Velocity in this reach is less than 5 meters/year, essentially stagnant. The snowline of the glacier has been at nearly 6000 meters in recent years. On the following image the snowline (blue dots), accumulation areas (A) and terminus blue arrow are indicated. It is evident that more than 50% of this glacier is debris covered.
  An examination of Landsat imagery from 1992, 2000 and 2009 indicates the expansion of these lakes near the terminus. These lakes (S) in the 2010 (Goggle Earth imagery) are beginning to coalesce and look to be creating a proglacial lake (lake at front of glacier) at the terminus of the glacier. Benn et al (2001) examining the supraglacial lakes hypothesized that the glacier was close to forming a moraine dammed proglacial lake. This is a scenario very similar to what has developed on Menlung Glacier, which is just over the pass into Tibet from the Ngozumpa.
 Further upglacier the surface of the glacier is riven with more lakes amidst the debris covered relatively stagnant ice. Further upglacier the thinning is evident in the expansion of a bedrock knob in the midst of the glacier (A), the decrease in surface elevation compared to the lateral moraine-trimline (L) and the quite high equilibirum line for 2009 (E). Strong thinning in the accumulation zone, though less than the ablation zone, of Khumbu Glacier was found by Bolch et al(2011)

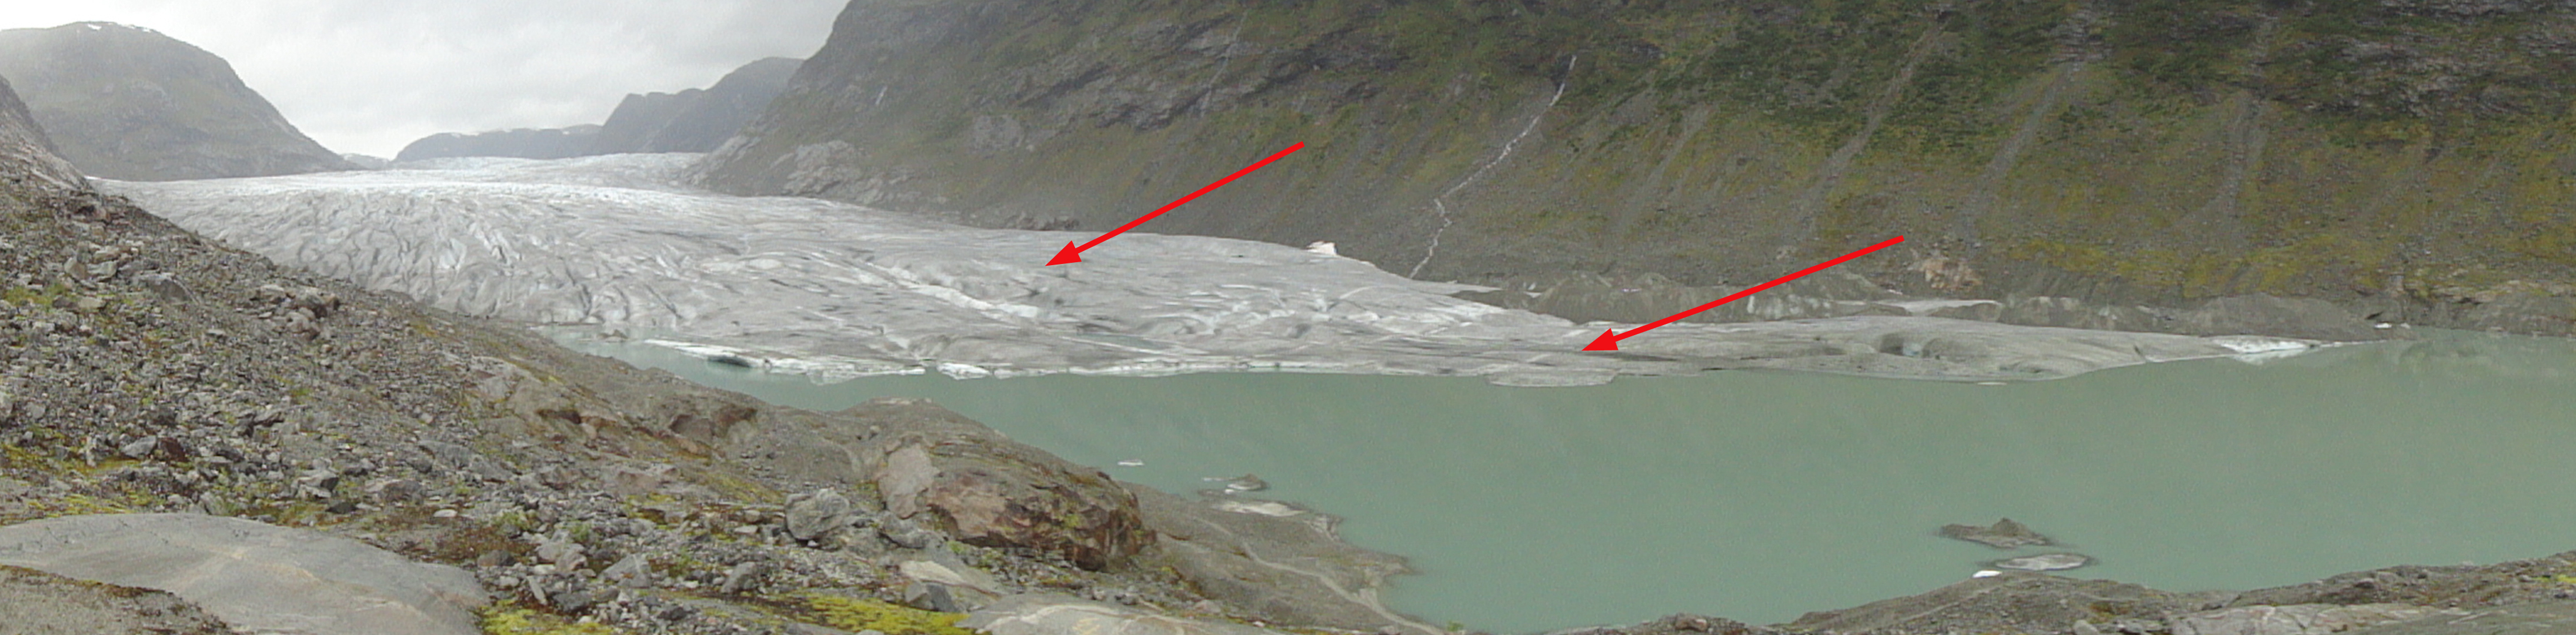
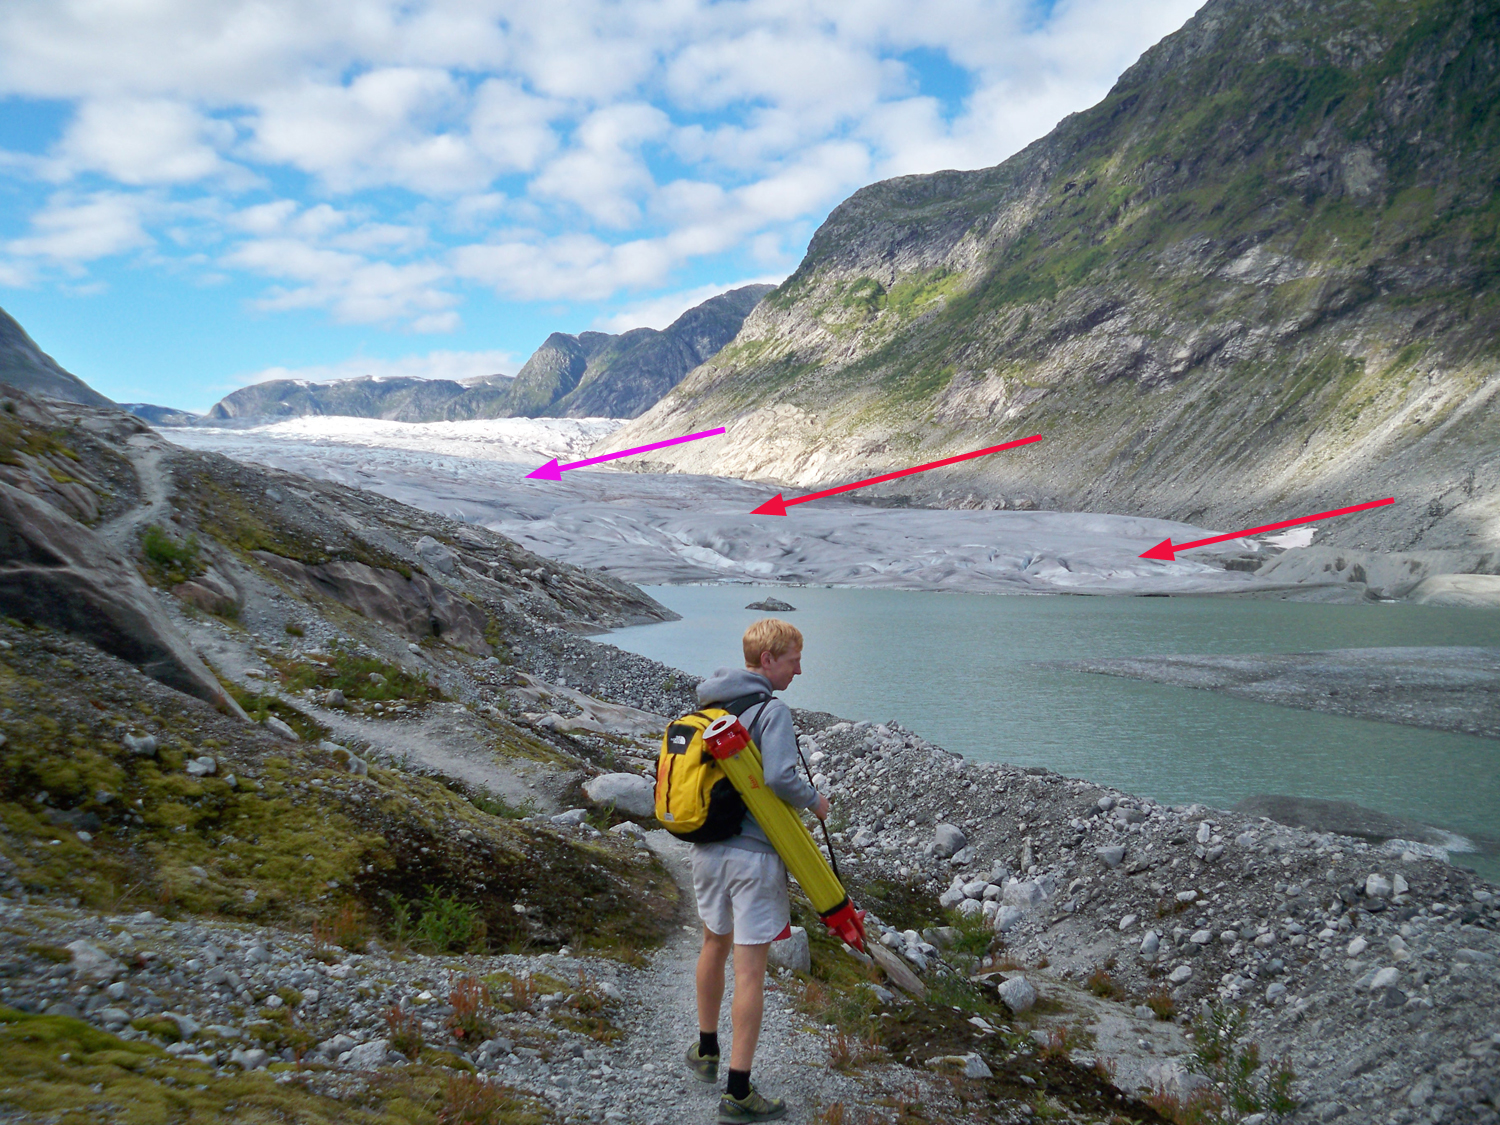
Speel Glacier Retreat, Coast Range Alaska
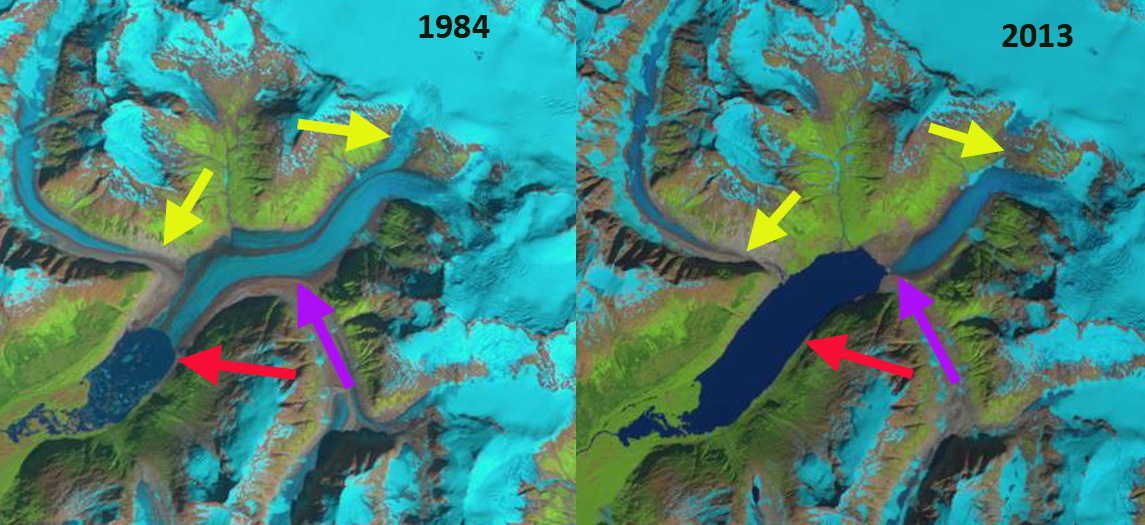
Speel Glacier a 3.2 km retreat from 1984-2013, lake expansion and tributary separation.
In 1984 I had a good chance to observe Speel Glacier while flying into Juneau, AK to work with the Juneau Icefield Research Program on the Juneau Icefield. Speel Glacier is south of the Taku Inelt east of Juneau, Alaska. Unlike the map on my lap, there was now a big lake at the terminus of the glacier. This post examines the retreat of this remote glacier and the expansion of the unnamed lake at its terminus. In 1948 Speel Glacier ended at the head of a braided outwash plain, generated by the Speel River. Upglacier in 1948 there was a lake impounded by the glacier, Speel Lake. 
 Today Speel Lake is gone and a much larger proglacial lake exists. The lower part of the glacier was heavily debris covered and stagnant in 1948. By 1968 the glacier had retreated 1 km just to the edge of the current lake. In 1984 the lake was 2.2 km long. In the images below Landsat 1984, Google Earth 2003, Landsat 2006, Landsat 2009 and 2013, the primary accumulation zone is marked ACC, secondary accumulation areas are indicated by black arrows, the 1984 terminus pink arrow, 2003 terminus blue arrow, 2006 terminus green arrow, 2009 terminus yellow. In the 1984 Landsat image the glacier had retreated 2 kilometers from the 1968 position and was fed by a shared accumulation zone with the Wright Glacier-black arrows in addition to the main accumulation area of the glacier above the main icefall on the east side of the glacier. By 2003 the glacier had retreated 1.9 km to where the lake bends east, and the main tributary from the north separated from the glacier. In the 2006 imagery the glacier has retreated an additional 1.8 km. The connections with the Wright Glacier accumulation area had been lost. The tributary from the north that has its own accumulation zone was now completely separated. The glacier was then solely dependent on a single accumulation zone, ACC. In 2009 the glacier had retreated 200 meters from 2006. By 2013 the glacier had retreated from the lake entirely a 6 km retreat since 1948. This should lead to a reduced rate of retreat.
The rapid retreat of this glacier has reduced its area at low elevation considerably. This is improving the glaciers accumulation area ratio, to be in equilibrium the glacier needs at least 60% of its area to be in the accumulation zone, in this region Pelto (1987) noted that no glaciers in the region were advancing that did not have an accumulation area ration above 67. In 1984 the accumulation area ratio was 48. In 2006 the AAR is 54, ablation area is being lost faster than accumulation area. The icefall marks the boundary between the ablation zone and the accumulation zone.The retreat of this glacier fits the pattern of other glaciers in the region Eagle, Field, Gilkey, and Chickamin. Today the lake averages nearly 1.5 km in width and is over 5 km long. 
Landsat imagery 1984

2003 Google Earth image

Landsat imagery 2006

2009 Landsat image

2013 Landsat image- Red arrow is 1984 terminus, purple the 2013 terminus and yellow arrows detached former tributaries.
Severnaya Zemlya Glacier Change, Russia
Severnaya Zemlya is a Russian Island group at the transition from the Kara Sea to the Laptev Sea. This island group is 50 % ice covered, with 18,000 square kilometers of glacier cover. Severnaya Zemlya has been the focus of a detailed remote sensing based study of glacier change by Sharov et al (2010) They observed a mean change in Severnaya glacier thickness of -7.8 m since the 1980’s. The annual rate of ice loss is 4.8 km³/a, a strongly negative net balance. They found that most ice caps have steepened since 1980, Albanov and Dezhnev have both gotten thicker in the center while retreating at the margin. Imagery from this region is scant. The glacier in this region have both small snow accumulation and small melting. Overall most of the ice caps are composed of superimposed ice, that is snow that melted and then refroze before exiting the ice cap.
  Several ice cores have been drilled through the ice sheets identifying the rate of accumulation through time Klementyev et al (1991) and Kotlyakov et al (2004) the last 8000 years on Vavilov Ice Cap.
First on the Dezhnev Ice Cap thickening of up to 13 m was noted at the top of the ice cap by Sharov et al (2010). In this post we examine a 2000 (top) and a 2010 (middle) Landsat image that shows all of the Dezhnev Ice Cap with the Albanov Ice Cap being half obscured by clouds in the 2000 image. In the Landsat comparison pay particular attention to the region just beneath Points A-C. At Point A we see an expansion of the small proglacial lake. At Point B and C we see exposure of new bare ground as areas of thin ice near the periphery of the ice cap have been lost. In 2010 there is no snow remaining on Dezhnev, however, this by itself does not indicate there was no accumulation that year, as superimposed formation cannot be distinguished from areas of bare ice that experienced ablation in the image. For Albanov Ice Cap there is a modest retreat from the locations noted with arrows that are linear-low spots often sometimes filled with meltwater. In the bottom image a closeup of Dezhneve, an arrow indicates a low spot in the midst of the ice cap that will be prone to melt out. In this image a melt pond has developed there. 


Hallstatter Glacier, Austria retreat
The Hallstatter Glacier (also sometimes called Dachstein Glacier along with the Gosau Glacier) is on the north slope of Dachstein an area of heavy recreational use. The result is good photographic records of glaciers change. This record combined with a recent cooperative project between University of Innsbruck, Blue Sky Weather Analysis and Energie AG Upper Austria provides a good snapshot of glacier change in northern Austria. The glacier begins at 2800 meters and descends to 2200 meters, image below from University of Innsbruck.  This project has compiled the annual terminus change of the glacier from 1950-2007, in the image below. The retreat from 1950-1975 averaged 8 meters per year. A period of minor readvance from 1977-1991 occurred, followed by increasingly rapid retreat from 1992-2007 averaging over 10 meters per year in the last decade. Total retreat has been 350 meters from 1950-2007.
  Over the last century the change is chronicled in the two images, 1900 and 2007, from the Dachstein Project and the 2009 margin is traced in a Google Earth Image, blue line. This project was undertaken because of the importance of the glacier runoff to hydropower production along the Traun and Gosau Watersheds in particular. The change in terminus via mapping from 1969-2002 is evident in the Innsbruck image (2002), the Google Earth image is from 2009. There is thinning particularly of the width of the two main terminus tongues.

 The mass balance of the glacier has been measured since 2007, every year has had negative balances. In 2011 the snowline was again high, snowpack very limited at the end of the melt season which persisted into October. An Ikonos image from October 2, 2011 indicates that 30-35 percent of the glacier is snowcovered, this is the AAR and it needs to be at 60 for equilibrium.
Northwest Vega Island, Antarctica Glacier Retreat
Vega Island is a heavily glaciated island just east of the northernmost section of the Antarctic Peninsula (map from Davies et al, 2010 Aberystwyth University). The mass balance of Bahia Del Diablo Glacier (BDD green arrow) located on this island has been monitored by an Argentina research group since 1999/2000 (Skvarca et al 2004 and WGMS, 2010). Nine of these ten years have seen negative mass balances, four substantial losses. The glacier begins at 600 meters and ends at 100 m, with an ELA of 425 meters on average, an image from Pedro Skvarca of Bahia Del Diablo indicates the ice cap nature of the glaciers on Vega Island.  Eight kilometers west of Bahia Del Diablo is are three adjacent glaciers at the northwest corner of the island (NW: burgundy Arrow on Vega Map) that is the focus here. In the initial glacier inventory these were listed as glacier 02-04 on Vega Island (Rabassa et al, 1982) This glacier barely reaches to the ocean, but the amount of bare land exposed at the coast along the glacier front is increasing. Further during several recent years this glacier has lost all of its snowcover. This glacier has only a tiny bit of its total area above 400 meters, below the observed ELA of the last decade on Bahia del Diablo. This is an issue for a couple of adjacent glaciers as well. Note the 1999 Google Earth imagery and the Landsat imagery from 2000 that indicate the lack of snowcover, green arrows. In 1999 and 2000 the glacier reached the coast along a distance of 900 meters, red arrows in second image. Note the change in the size of the bedrock exposed near the terminus, burgundy arrow from 1999 to 2011. The glacier frontage by 2011 had been reduced to 250 meters, the bare brown red areas have nearly merged along the coast, soon this glacier will not be reaching the shoreline. The bare rock area between two lobes of the glacier has also expanded, from 1999-2011, burgundy arrows. In 2007 and 2008 there was very little if any snowpack left on this glacier by the end of the melt season. The issue for a glacier without a consistent accumulation zone, is that it will not survive (Pelto, 2010). These glaciers are more like ice caps are not thin and are not melting away quickly. The glacier volume loss is consistent with that observed all around the Antarctic Peninsula, Nordenskjold Coast


Northwest Vega Island, Antarctica Glacier Retreat
Vega Island is a heavily glaciated island just east of the northernmost section of the Antarctic Peninsula (map from Davies et al, 2010 Aberystwyth University). The mass balance of Bahia Del Diablo Glacier (BDD green arrow) located on this island has been monitored by an Argentina research group since 1999/2000 (Skvarca et al 2004 and WGMS, 2010). Nine of these ten years have seen negative mass balances, four substantial losses. The glacier begins at 600 meters and ends at 100 m, with an ELA of 425 meters on average, an image from Pedro Skvarca of Bahia Del Diablo indicates the ice cap nature of the glaciers on Vega Island. Eight kilometers west of Bahia Del Diablo is are three adjacent glaciers at the northwest corner of the island (NW: burgundy Arrow on Vega Map) that is the focus here. In the initial glacier inventory these were listed as glacier 02-04 on Vega Island (Rabassa et al, 1982) This glacier barely reaches to the ocean, but the amount of bare land exposed at the coast along the glacier front is increasing. Further during several recent years this glacier has lost all of its snowcover. This glacier has only a tiny bit of its total area above 400 meters, below the observed ELA of the last decade on Bahia del Diablo. This is an issue for a couple of adjacent glaciers as well. Note the 1999 Google Earth imagery and the Landsat imagery from 2000 that indicate the lack of snowcover, green arrows. In 1999 and 2000 the glacier reached the coast along a distance of 900 meters, red arrows in second image. Note the change in the size of the bedrock exposed near the terminus, burgundy arrow from 1999 to 2011. The glacier frontage by 2011 had been reduced to 250 meters, the bare brown red areas have nearly merged along the coast, soon this glacier will not be reaching the shoreline. The bare rock area between two lobes of the glacier has also expanded, from 1999-2011, burgundy arrows. In 2007 and 2008 there was very little if any snowpack left on this glacier by the end of the melt season. The issue for a glacier without a consistent accumulation zone, is that it will not survive (Pelto, 2010). These glaciers are more like ice caps are not thin and are not melting away quickly. The glacier volume loss is consistent with that observed all around the Antarctic Peninsula, Nordenskjold Coast
