28th Field Season of the North Cascade Glacier Climate Project 8-1 to 8-20

During the interval of 8-1 to 8-20 there will be no blog updates, we will be in the field for the entire period. This is the 28th consecutive year we will monitoring the terminus behavior and mass balance of these glaciers identifying how they respond to climate change. In these 28 years all the glaciers have retreated significantly they have lost 20% of their volume and two of the glaciers we monitored every year have disappeared.
If you are in need of glacier observations, please take a look back at the index of 100+ posts to date
Or look at the video footage below from the 2010 field season and the 2009 field season

North Cascades Glacier Documentary Promo 2010 from Cory Kelley on Vimeo.


2009 field season video

We begin the field season on Columbia Glacier near Monte Cristo, WA.
We will then head north to the Lower Curtis Glacier on Mount Shuksan. A traverse west will takes us to Sholes and Rainbow Glacier on the ne side of Mount Baker.

We will then drive around Mount Baker and examine the Easton, Deming, Squak, Talum and Boulder Glaciers on the south and east side of Mount Baker.

We then head to Cache Col Glacier near Cascade Pass and finally south to Mount Daniels for Ice Worm, Daniels and Lynch Glacierto finish the field season. It was a historically cool and wet spring and the glaciers still have a thick blanket of snowcover. How thick is what we will be measuring one glacier at a time.

Umiamako Glacier Acceleration and Retreat

Draining the West side of the Greenland Ice Sheet just north of Disko Island, Umiamako Glacier unlike most of the others in the region reaches close to the end of its fjord. The glacier flows 50 km down this fjord, though in the last 10 years this distance has decline sharply. A recent paper by McFadden et al (2011) explores the dynamic changes of this glacier. The glacier was first chosen for examination in the late 1930’s by the British West Greenland Expedition. The first good data on velocity come from the survey of Carbonell and Bauer in 1964, who reported a velocity of 1200-1900 meters per year. The terminus and the velocity of the glacier both were pretty stable for the next 40 years, much as was the case on the Jakobshavn to the south. In the McFadden et al (2011) paper the velocity is still in the same range of 1500 meters per year until 2005, top box in image below. From 2005 to 2009 the velocity increased to 5000 meters per year. The associated retreat is in the middle box of this image. The extent of the acceleration inland is not identified here directly, but in the surface profiles the bottom of the three boxes in the McFadden image, the inland thinning in 2008 is significant to 20 km inland, suggesting an acceleration to here. The fjord reach of the glacier still extends another 25-30 km, so the acceleration has not reached to the inland ice. In the Joughin et al (2010), second figure below,the extent of high velocity is quite limited for Umiamako compared to Rinks just to the south inn 2005/06. Is this still true? After the retreat of 2003-2005 the acceleration began. This is typical for the marine terminating outlet glaciers as thinning usually leads to retreat and the thinning leads to decoupling of the glacier to extent from the fjord walls and its bed. This typifies the third type of Greenland glaciers reviewed by Bailey and Pelto (2011). The reduced frictional forces lead to acceleration and further retreat. In this case the fjord is longer than many in the sector of West Greenland, leading to a smaller area of contribution from the inland ice and less capability to drawdown this ice. The terminus change can be seen in the map from McFadden , but also in the three images below, first from Google Earth in 2004( top image), than from MODIS in 2010 (middle image)and 2011(bottom image). C marks the terminus position, B the juncture with the first southerly tributary glacier and A the juncture with the second tributary glacier. The two tributary glaciers that clearly feed the glacier in 2004, B now enters the fjord below the glacier and A is right at the terminus. In the McFadden image the 2009 terminus is still downstream of tributary A. Total retreat in the last decade is at least 7.5 km. Extreme Ice Survey set up a camera at the terminus and has a time sequence from 2008, this same camera location in 2011 would show a much different scene as the glacier has retreated 2 kilometers.

Sommelier Glacier, France Disappearing

Index list of over 100 glaciers examined to date
The Sommelier Glacier is close up against the France-Italy border. The glacier is on the north side of Punta Sommelier centered on 3000 meters. The glacier has retreated 1800 meters from its Little Ice Age Maximum and is currently 600 meters long. The most notable aspect of the glacier today is its thin nature and the fact that there are three separated and stagnant ice masses (B, C), the main glacier section is outlined in blue. The large deglaciated fluted moraine is noted by point A. Within the area of the main glacier there are several rock outcrops protruding indicating the thin and decaying nature of the glacier, note blue placemarks. Also note that the glacier has limited snowcover. Both of these indicate a glacier is not forecast to survive. This is not surprising for the Sommelier Glacier given the fate of the nearby Galambra Glacier noted by the Italian Glacier Commission, inn this photo pair from 1954 and 2009. This glacier no longer graces the slopes of Punta Galambra. Punta Sommelier likewise will lose its glacier cover. This is the trend of alpine glaciers in Italy, other examples include Dosde Glacier, Italy and Presena Glacier.

Mazama Glacier Retreat, North Cascades, Washington

Mazama Glacier flows down the north side of Mount Baker, a strato volcano in the North Cascades of Washington. The glacier begins at the summit plateau, 3260 meters, and terminates at the head of Wells Creek 1470 meters. This is a glacier we visit briefly each summer since 1984, but is not a focus of detailed observations. In 2010 we descended from its divide with Rainbow Glacier at 2100 meters to just above the terminus. In the 1970’s the USGS map (top image in sequence) indicates the terminus extended down valley to 1200 meters, this was after a period of advance for the glacier. The glacier advance 450 meters from 1950-1980 (Pelto and Hedlund, 2001). In 1987 we observed the glacier to have begun to retreat. By 1993 the glacier had retreated 200 meters. From 1993 (middle) to 2009 (bottom image) the glacier retreated an additional 750 meters. The rate of retreat has been higher for this glacier because of the loss of the low elevation debris covered terminus that had existed from the 1950’s-1990’s. The glacier is still heavily crevassed and active. The retreat will continue as indicated by thinning near the snowline of the glacier from 1993 to 2009. Note the expansion of the rock outcrop in glacier center (A) from the top image, 1993 to 2009 bottom image. There is also considerably less crevassing near Point A. Also note the stranded glacier ice at Point B and C in 2009. This loss has been due to 7 of the last 10 years having a snowline that rose above the elevation necessary for equilibrium. In 2009 at the end of the summer just 36% of the glacier was snowcovered, 65% needs to be snowcovered for equilibrium. .
In two weeks we will be visiting Mazama Glacier again. Given the heavy 2011 snowpack it is unlikely we will get to see the terminus which should be under avalanche debris.

Retreat of Hansbreen, Svalbard

Hansbreen is tidewater glacier flowing into Hornsund in sw Svalbard. The glacier has been examined in detail over the last twenty years from the Polish Research Station. The glacier has retreated 2.7 kilometers from 1900 to 2008. The chart below from Oerlemans, Jania and Kolandara (2011) illustrates this retreat as does the comparative images from the Polish Research Station. The glacier mass balance has been measured since 1989 and is submitted to the World Glacier Monitoring Service. In a detailed review of this calving glacier Oerlemans, Jania and Kolandra (2011) report that The average surface mass balance has been -0.36 meters per year, but this is equaled by the calving loss, leading to a loss of 0.8 meters per year. The low slope of this glacier 1.6 degrees makes it difficult to reestablish equilibrium as it retreats. The bed of the glacier remains below sea level for at least 70% of its length, note Figure 3 in Oerlemans et al (2011). The glacier retreated 400 meters from 2000-2005, and has continued this rate of recession. In the two side by side Landsat images below from 2001 (right) and 2010 (left) changes are evident at the front of the neighboring Paierbreen-circle, Hansbreen (H) and Nannbreen (A) Focusing just on the Hansbreen a red line from the summit of two adjacent mountains is added to the 2001 and 2010 image to illustrate the terminus change. The 2001 images is on top, 2010 image below.

Retreat of Nannbreen, Svalbard

Nannbreen is a 5 km long land terminating glacier in southwest Svalbard. The glacier is just north of Hornsund. During the course of the 20th century Nannbreen retreated from its Little Ice Age moraine complex forming a new proglacial lake. The glacier ends at an elevation of 150 meters descending from 600 meters, the snowline in several Landsat images from the last decade has been 400-450 meters. By 2000 (first image below)the glacier had retreated 750 meters from the moraine complex and the glacier ended in a lake, that was over 500 meters long. In 2010 (second image below) the glacier had retreated out of the lake, 250 meters of retreat in 10 years, 1000 meters of retreat in the last century. Certainly the 21st century retreat rate is far above the average 20th century retreat rate. Most of the large glaciers in Svalbard are tidewater calving glaciers, such as the nearby Hansbreen, which retreated 400 meters from 2000-2005. Svalbard glaciers have been losing considerable volume, indicative of negative mass balance and glacier retreat. Nuth et al (2010) concluded that over the past 40 years for Svalbard ice loss is 9.71 ± 0.55 cubic kilometers/year. This is an average thinning of 0.36 meters/year for an annual contribution to global sea level rise of 0.026 mm yr.

Chüebodengletscher and Ghiacciaio del Pizzo Rotondo, Switzerland nearly gone

Chüebodenhorn is 3,070 meter high in the Lepontine Alps. The Ghiacciaio del Pizzo Rotondo lies at the foot of its north face and Chüebodengletscher is on its south side. Chüebodengletscher is confined to a small cirque, and currently ends in a lake . In several recent years including 2010 the glacier lost all of its snowcover. The glacier is currently 500 meters long and has an elevation range of 75 meters. The lake which fringes the glacier will turn into a circular alpine lake as the glacier melts away. At present the crescent shaped lake is 140 meters wide. The annual layers in this glacier are evident much like tree rings, that the are all emergent at the surface indicates that all the snow and firn that is supposed to cover most of a glacier at the end of the summer, has been lost from all of the glacier. There are at least 75 annual layers evident. The youngest layer (y) is at the top of the glacier and oldest (o) at the bottom.
Ghiacciaio del Pizzo Rotondo is a thin slope glacier. This glacier also has a short elevation span of 80 meters from the terminus to its head in a distance of 500 meters. The glacier is a slope glacier that has little apparent thickness. The glacier will be lost faster than the thicker Chüebodengletscher. Ghiacciaio del Pizzo Rotondo also has lost all of its snowcover, and without a persistent and consistent accumulation zone it cannot survive. These two glaciers are losing mass like many neighboring such as the large Gries Glacier monitored by the In the graph below From the Swiss Glacier Monitoring Network the cumulative mass loss of Gries Glacier has been 20 meters. Swiss Glacier Monitoring Network. This mass loss of Swiss Glaciers led to 86 of the 95 glacier observed to retreat, while six were stationary and three advanced. The lack of an accumulation zone indicates that the glaciers will follow the path of Presena Glacier and Dosde Glacier unlike Oberaar Glacier which retains an accumulation zone.

Spectacular Retreat of Melbern Glacier, British Columbia

The combined Melbern and Grand Pacific Glacier with a length of 55 km and width of 2-5 km, is a large valley glacier draining from the Saint Elias Mountains near the British Columbia-Alaska boundary. The glacier separates into two distinct glacier termini at Grand Pacific Pass. One of the tongues, Melbern Glacier, flows 20 km northwest ending in . Grand Pacific Glacier flows southeast to Tarr Inlet of Glacier Bay, just across the Alaska boundary. The Melbern Glacier turns north and ends in Lake Melbern. Lake Melbern began to form around 1979 as noted by Clague and Evans (1994). By 1986 the lake had expanded greatly as the former tributary to Melbern Glacier, Konamoxt Glacier had separated, and a 7km retreat of Melbern Glacier from the Konamoxt Glacier had ensued, first image from their paper. Clague and Evansin the second image further note that the ice dam of the Konamoxt Glacier that blocks Melbern Lake had broken by 1991 and the lake level had dropped. The retreat has continued unabated up through 2009. Here we use a series of Landsat images and one Google Earth Image to illustrate the retreat up to 2013. The first is a 1986 Landsat Image, K=Konamoxt and M=Melbern. In this image Konamoxt still blocks Melbern Lake and Melbern Glacier terminates adjacent to another tributary from the south, orange marks the 1986 terminus of both glaciers. The second image is a false color Landsat image from 2001. Konamoxt Glacier extends partly across the lake but not completely. The lake to the northwest of Konamoxt is filled with icebergs. Melbern Glacier has retreated 3 km since 1986. The third image is the Google Earth image also from 2001 showing the 1986 margin as well, in orange and the 2007 terminus in purple. The fourth image is from 2007, indicating a 1.5 km retreat of Melbern Glacier in the last six years. By 2013 the retreat is 2.25 km since 2001 and 5.25 km since 1986. Konamoxt Glacier no longer reaches Lake Melbern proper and is beginning a retreat up its own valley. The lake itself has changed color and lost its fleet of icebergs. The last image is from July 2013 and Lake Melbern is now 20 km long and still expanding. melbern glacier 2013
Melbern Glacier is following the same pattern as nearby Yakutat Glacier and Grand Plateau Glacier. The lower 3 km of the glacier appears stagnant. However, there is a moraine band 10m km above the terminus that has shifted down glacier 1000-1500 meters from 2001 to 2007 as seen in images from those dates below. The green line indicates the moraine position in 2007. This indicates significant flow at this point. Thus, it is evident that retreat will continue on Melbern Glacier, but should slow as either the lake basin is left behind, or the moraine band is approached

BAMS State of Climate 2010-Glacier Chapter


STATE OF THE
CLIMATE IN
2010
Published June 2011
Below is the chapter that I author on Alpine glacier and ice sheets. The full BAMS report is an invaluable resource for understanding the climate of 2010 and how it fits into the context of climate change and recent climate. The editorial process is rigorous. The picture below is of Lemon Creek Glacier in Alaska, one of the glaciers discussed.
g. Land surface properties
1) Alpine glaciers and ice sheets—M. S. Pelto
The World Glacier Monitoring Service (WGMS) record of mass balance and terminus behavior(WGMS 2008; WGMS 2009) provides a global index for alpine glacier behavior. Mass balance was negative in 2009 for the 19th consecutive year. Preliminary data for 2010 from Austria, Greenland, Italy, Norway,New Zealand, and the United States indicate it is highly likely that 2010 will be the 20th consecutive year of negative annual balances. Alpine glaciers have been studied as sensitive indicators of climate for more than a century, most commonly focusing on changes in terminus position and mass balance (Oerlemans 1994). The worldwide retreat of mountain glaciers is one of the clearest signalsof ongoing climate change (Haeberli et al. 2000). The retreat is a reflection of strongly negative mass balances over the last 30 years (WGMS 2008). Glacier mass balance is the difference between accumulation and ablation. A glacier with a sustained negative balance is out of equilibrium and will retreat. The recent rapid retreat has led to some glaciers disappearing (Pelto 2010).

The cumulative mass balance loss of the last 30 years is 12.3 m w.e., the equivalent of cutting a 14 m thick slice off the top of the average glacier (Fig. 2.60). The trend is remarkably consistent from region to region (WGMS 2009). WGMS mass balance results based on 30 reference glaciers with 30 years of record are not appreciably different from the results for all reporting glaciers. The decadal mean annual mass balance was -198 mm in the 1980s, -382 mm in the 1990s, and -654 mm for 2000–09. The declining mass balance trend during a period of retreat indicates alpine glaciers are not approaching equilibrium and retreat will continue to be the dominant terminus response.

In 2010 winter accumulation on Austrian and Italian glaciers was about average, and summer temperature was above the mean in 2010. The result was mass losses on glaciers in the Alps: Sonnblickkees, Austria, -790 mm; Ciardoney, Italy, -830 mm; and Fontana Bianca, Italy, -130 mm. The Swiss Glacier Monitoring Network reported that in 2010 the termini of 86 glaciers were in retreat, six were stationary, and three advanced. In Norway, terminus fluctuation data from 30 glaciers for 2010 indicate 27 retreating, one stable, and two advancing. The average terminus change was -17 m, compared to -183 m in 2009. Mass balance surveys found deficits on all Norwegian glaciers. Winter 2009/10 was cold but with little snow on the glaciers, 50%–80% of the long-term normal. Summer was warmer than normal in the south and a bit colder than normal in the north. (L. Andreasson 2011, personal communication).

In the North Cascades, Washington (M. Pelto 2011, personal communication), a transition from El Niño to La Niña conditions led to equilibrium mass balances. El Niño winter conditions led to reduced winter snowfall. La Niña conditions developed by summer causing low summer melting, which offset the low accumulation. The result was positive annual balance on four glaciers, negative balance on five glaciers, and an equilibrium balance on one glacier. All 33 glaciers observed retreated in 2010. In southeast Alaska, snowlines were 50 m above average on Lemon Creek and Taku Glacier of the Juneau Icefield indicative of moderate negative balances. In New Zealand, El Niño led to normal to below normal temperatures through summer and into fall 2010, leading to snowlines in a near steady state (J.Hendrikx 2011, personal communication). On 50 glaciers surveyed, the average snowline was at the equilibrium snowline elevation, after two strongly negative years in 2008 and 2009.

For information on 2010 ice melt on the Greenland ice sheet and in Antarctica please refer to sections 5f and 6e, respectively.

Fig. 2.60. The (top) annual mean and cumulative annual mean balance and (bottom) decadal mean cumulative
specific mass balance (mm w.e.) reported for the 30 reference glaciers to the WGMS.

Brady Glacier Retreat Leads to Rapid Lake Expansion 2004-2010

This post details changes in Brady Glacier between the 2004 Google Earth imagery and a 2010 Landsat image and that are examined in more detail by (Pelto et al, 2013). A detailed look at retreat up to 2004 is detailed in a previous post on Brady Glacier.. Brady Glacier is a large glacier at the south end of the Glacier Bay region, Alaska. When first seen by George Vancouver it was a calving tidewater glacier in 1794 filling Taylor Bay with ice. Brady Glacier ceased calving and advanced approximately 8 km during the 19th century (Klotz, 1899). As Bengston (1962) notes, the advance is likely another example of an advance following a change from tidal to non-tidal status rather than that of a more positive mass balance. Bengston (1962) further notes that the massive outwash plain at the terminus is primarily responsible for Brady glacier maintaining itself well other glaciers in the Glacier Bay region retreat. The ELA on this glacier is 800 m, the line above which snow persists even at the end of the average summer, this is one of the lowest in Alaska. The main terminus was still advancing in the 1960’s and 1970’s and has managed a 250-300 meter advance since the USGS map of the 1950’s. The main terminus is not advancing any longer and has begun to retreat, the retreat to date is less than 300 meters. The glacier has been thinning and this has caused many of the subsidiary termini to retreat significantly.
There have been significant changes cause by continued retreat since 2004. For North Tripp Lake, labelled A in images. The glacier lake has separated into two parts since 2004, at the red arrow in the images below, as the glacier margin has pulled back an additional 250 meters. The lake level has dropped resulting in this separation. The drop in elevation is due to drainage south from the lake adjacent to the glacier underneath and beside the glacier, instead of solely to the west. This new drainage path was evident in the 2004 image and noted in the previous post. The color of the two lakes is markedly different, the deeper blue of the lake more distant from the glacier indicates less glacier eroded material in suspension. . Deception Lake, labelled B, has expanded by 500 meters as the glacier has retreated this same amount. At this rate this lake may soon follow the pattern of North Tripp Lake. Across the glacier, an unnamed arm, labeled C has begun to disintegrate. The white arrows in the 2010 image indicate the new open lake area. The area of this lake is now 1.5 square kilometers. North of Lake C is Abyss Lake, labelled D, this lake has expanded due to the 240 meters of retreat of the glacier in the 2004-2010 period. 
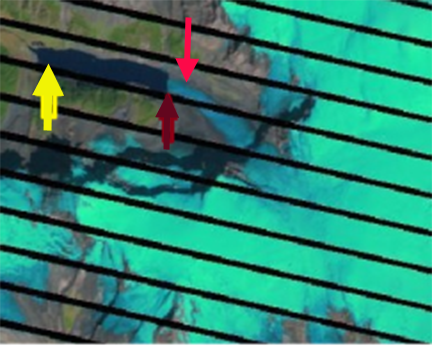
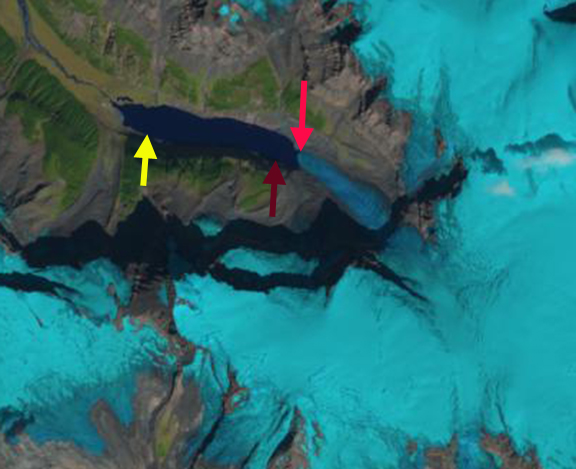
. To the west of Brady Glacier an unnamed glacier arm that used to join a branch of the Brady Glacier has now retreated fully from lake created by its retreat. Note point A in the time sequence below. The retreat from 1950 to 2004 was 3600 meters northeast up the lake basin, top image map from 1950, middle image Google Earth 2004. From 2004 to 2010 the glacier has retreated an additional 600 meters the retreat turning the elbow and now progressing northwest, bottom image 2010 Landsat image. Clearly the Brady Glacier thinning as indicated by tributaries on both its east and west side, continue do demonstrate that a rapid retreat of the main terminus will begin.

Index of Glacier Posts June 2009-June 2011

Glacier Index List
Below is a list of the individual glacier posts examining our warming climates impact on each glacier. This represents the first two years of posts, 115 total posts, 108 different glaciers. I have worked directly on 34 of the glaciers described below. Other glaciers were selected based on fine research that I had come across, cited in each post, I then look at additional often more recent imagery to expand on that research. The imagery comes either from MODIS, Landsat, Geoeye or Google Earth.
North America
Columbia Glacier, Washington
Lyman Glacier, Washington
Boulder Glacier, Washington
Ptarmigan Ridge Glacier, Washington
Anderson Glacier, Washington
Milk Lake Glacier, Washington
Paradise Glacier, Washington
Easton Glacier, Washington
Redoubt Glacier, Washington
Honeycomb Glacier, Washington
Vista Glacier, Washington
Rainbow Glacier, Washington
Daniels Glacier, Washington
Colonial Glaer, Washington
Quien Sabe Glacier, Washington
Fairchild Glacier, Washington
White Glacier, Washington
Banded Glacier, Washington
Hinman Glacier, Washington
Bubagoo Glacier, British Columbia
Hector Glacier, Alberta
Helm Glacier, British Columbia
Warren Glacier, British Columbia
Castle Creek Glacier, British Columbia
Hoboe Glacier, British Columbia
Tulsequah Glacier, British Columbia
Decker and Spearhead Glacier, British Columbia
Columbia Glacier, British Columbia
Freshfield Glacier, British Columbia
Devon Ice Cap, Nunavut
Penny ice Cap, Nunavut
Minor Glacier, Wyoming
Grasshopper Glacier, Wyoming
Grasshopper Glacier, Montana
Harrison Glacier, Montana
Sperry Glacier, Montana
Hopper Glacier, Montana
Old Sun Glacier, Montana
Yakutat Glacier, Alaska
Grand Plateau Glacier, Alaska
Gilkey Glacier , Alaska
Gilkey Glacier ogives, Alaska
Lemon Creek Glacier, Alaska
Taku Glacier, Alaska
Bear Lake Glacier, Alaska
Chickamin Glacier, Alaska
Okpilak Glacier, Alaska
Sawyer Glacier, Alaska
Antler Glacier, Alaska
East Taklanika Glacier, Alaska
Brady Glacier, Alaska
Thiel Glacier, Alaska

New Zealand
Tasman Glacier
Murchison Glacier
Donne Glacier
Africa
Rwenzori Glaciers
Himalaya
Zemu Glacier, Sikkim
Theri Kang Glacier, Bhutan
Zemestan Glacier, Afghanistan
Khumbu Glacier, Nepal
Imja Glacier, Nepal
Gangotri Glacier, India
Satopanth Glacier, India
Menlung Glacier, Tibet
Boshula Glaciers, Tibet
Urumquihe Glacier, Tibet
Sara Umaga Glacier, India

Europe
Mer de Glace, France
Dargentiere Glacier, France
Obeeraar Glacier, Austria
Ochsentaler Glacier, Austria
Pitzal Glacier, Austria
Dosde Glacier, Italy
Maladeta Glacier, Spain
Presena Glacier, Italy
Triftgletscher, Switzerland
Rotmoosferner, Austria
Stubai Glacier, Austria
Ried Glacier, Switzerland
Forni Glacier, Italy
Peridido Glacier, Spain
Engabreen, Norway
Midtdalsbreen, Norway
TungnaarJokull, Iceland
Gigjokull, Iceland
Skeidararjokull, Iceland
LLednik Fytnargin, Russia
Rembesdalsskaka, Norway

Greenland
Mittivakkat Glacier
Ryder Glacier
Humboldt Glacier
Petermann Glacier
Kuussuup Sermia
Jakobshavn Isbrae
South America
Colonia Glacier, Chile
Artesonraju Glacier, Peru
Nef Glacier, Chile
Tyndall Glacier, Chile
Zongo Glacier, Bolivia
Llaca Glacier, Peru
Seco Glacier, Argentina
Antarctica and Circum Antarctic Islands
Pine Island Glacier
Fleming Glacier
Hariot Glacier
Amsler Island
Stephenson Glacier, Heard Island
Neumayer, South Georgia
Ampere, Kerguelen

North Cascade Glacier Climate Project Reports

Forecasting Glacier Survival
North Cascade Glacier Mass Balance 2010
Columbia Glacier Annual Time Lapse
North Cascade Glacier Climate Project 2009 field season

Retreat of Columbia Glacier, Columbia Icefield, Canada

The Columbia Glacier drains west from Columbia Icefield into British Columbia. The glacier in 1964 was 8.5 km long, by 1980 9.5 km long and in 2009 6.5 km long. The glacier drops rapidly from the plateau area over a major ice fall, which created a series of ogives, as seen in this 1964 Austin Post (USGS) photograph. Ogives are annual wave bulges that form at the base of an icefall due to differential seasonal flow velocity. The outermost moraine emplaced by the glacier is dated to 1724. By 1924 the glacier retreated 400 meters and then an additional 1300 meters by 1950, according to Ommaney, 1980 (page 225 of link). Ommaney (page 251) noted that the glacier than advanced over one kilometer from 1966 to 1980 the glacier again completely fill the large proglacial lake. A comparison of 1985 and 2009 Landsat images indicates the change in terminus position and lake size. The yellow arrow is the 1985 terminus, red arrow the 2009 terminus and pink arrow 2013. The black lines in the 2009 image are scan line errors. There is a 3000 meter retreat in the 25 years and 300 meters from 2009-2013. The lake is now 4 km long. Tennant and Menounos (2013) examined changes in the Columbia Icefield 1919-2009 and found a mean retreat of 1150 m and mean thinning of 49 m.

columbia glacier bc 1985
1985 Landsat image
columbia glacier bc 2009
2009 Landsat image

columbia glacier BC 2014
2013 Landsat image

That is 120 meters per year 1985-2009, and 75 m per year 2009-2013. By 2001 satellite imagery indicates a proglacier lake that is 2700 meters long ending at the terminus (top image). In the 2004 Google Earth image the terminus had retreated 300 meters, middle. In 2009 Landsat imagery indicates a further 500 meter retreat. In the images below the yellow line is the 1964 terminus, orangeis 2001, blue is 2004 and green is 2009. Thus, Columbia Glacier, British Columbia has retreated at least 800 meters in the last decade (bottom image). A further change is noted in the absence of ogives at the base of the icefall. As the icefall has narrowed and slowed the result has been a cessation of this process. The current terminus is still active with crevassing near the active front. The glacier does lose ice to calving as the glacier reaches the end of the depression filled by the lake, its rate of retreat should slow. At the current retreat rate that will be within the next 10-20 years. Examining the surface elevations and crevasse patterns of the lower glacier, there is no sign that the lake will not continue to expand for at least another kilometer.