Storstrømmen Glacier, NE Greenland Retreat Releases New Islands

stormstrommen-2013-2023

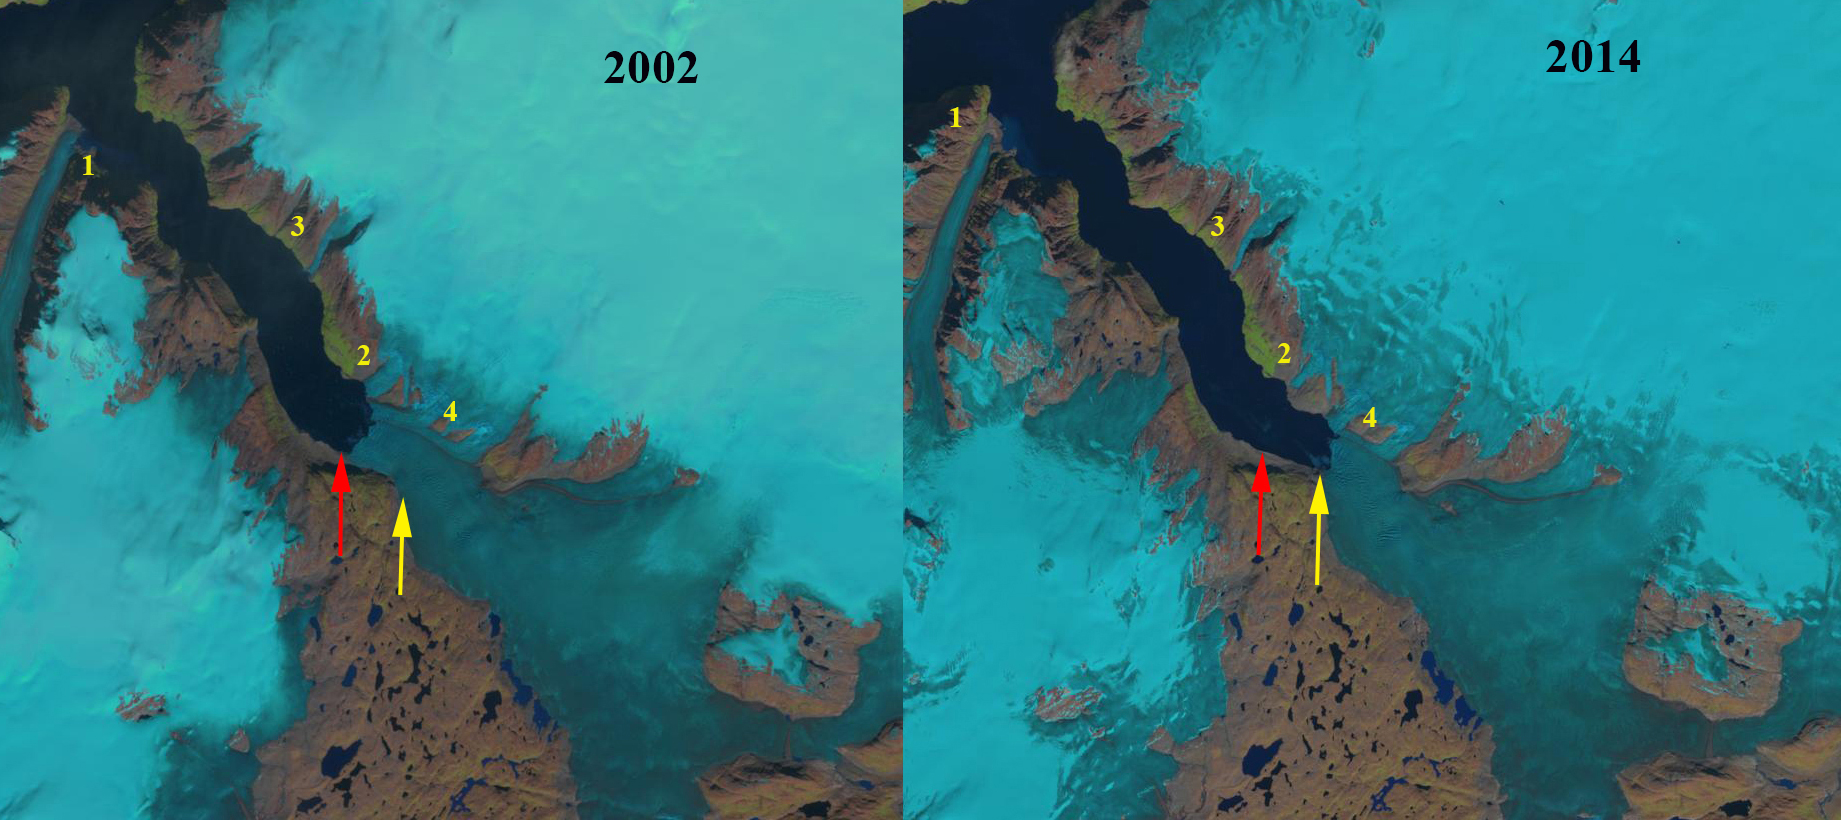
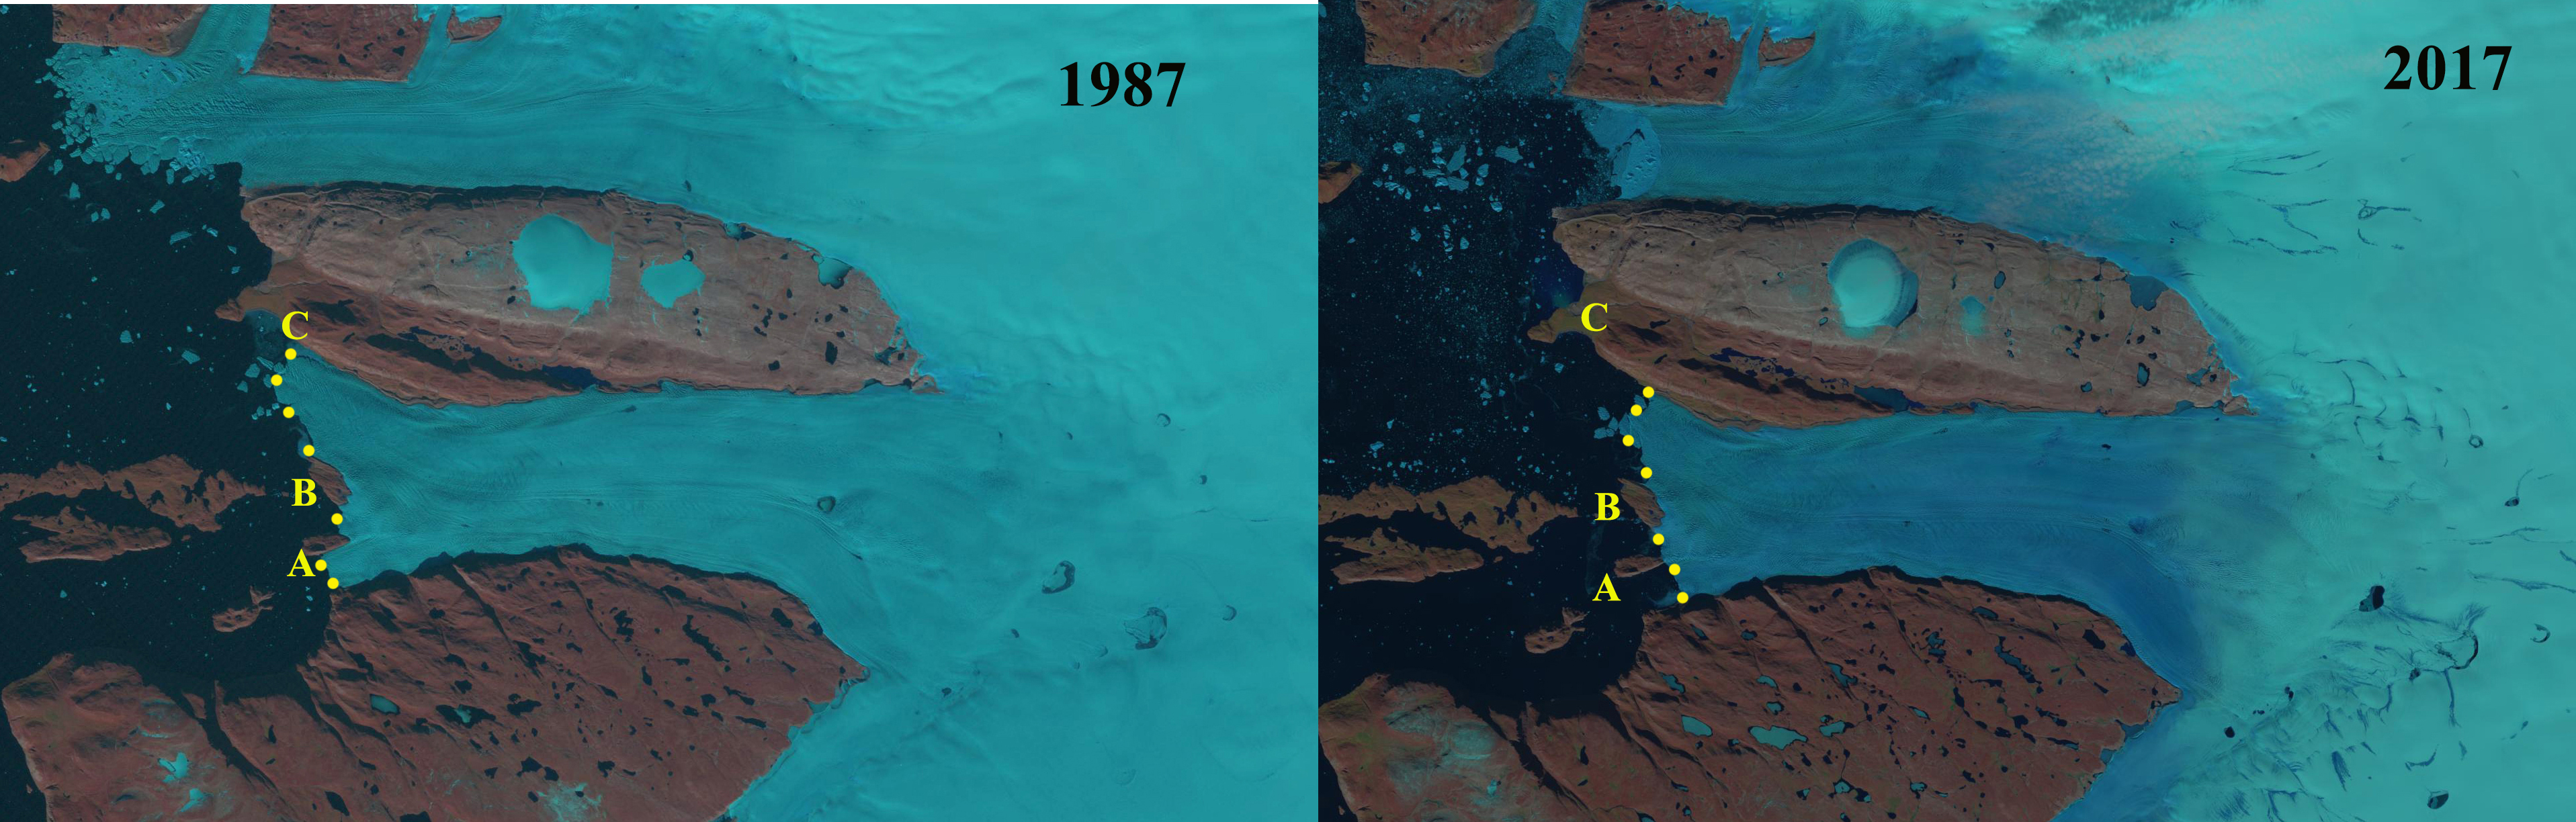
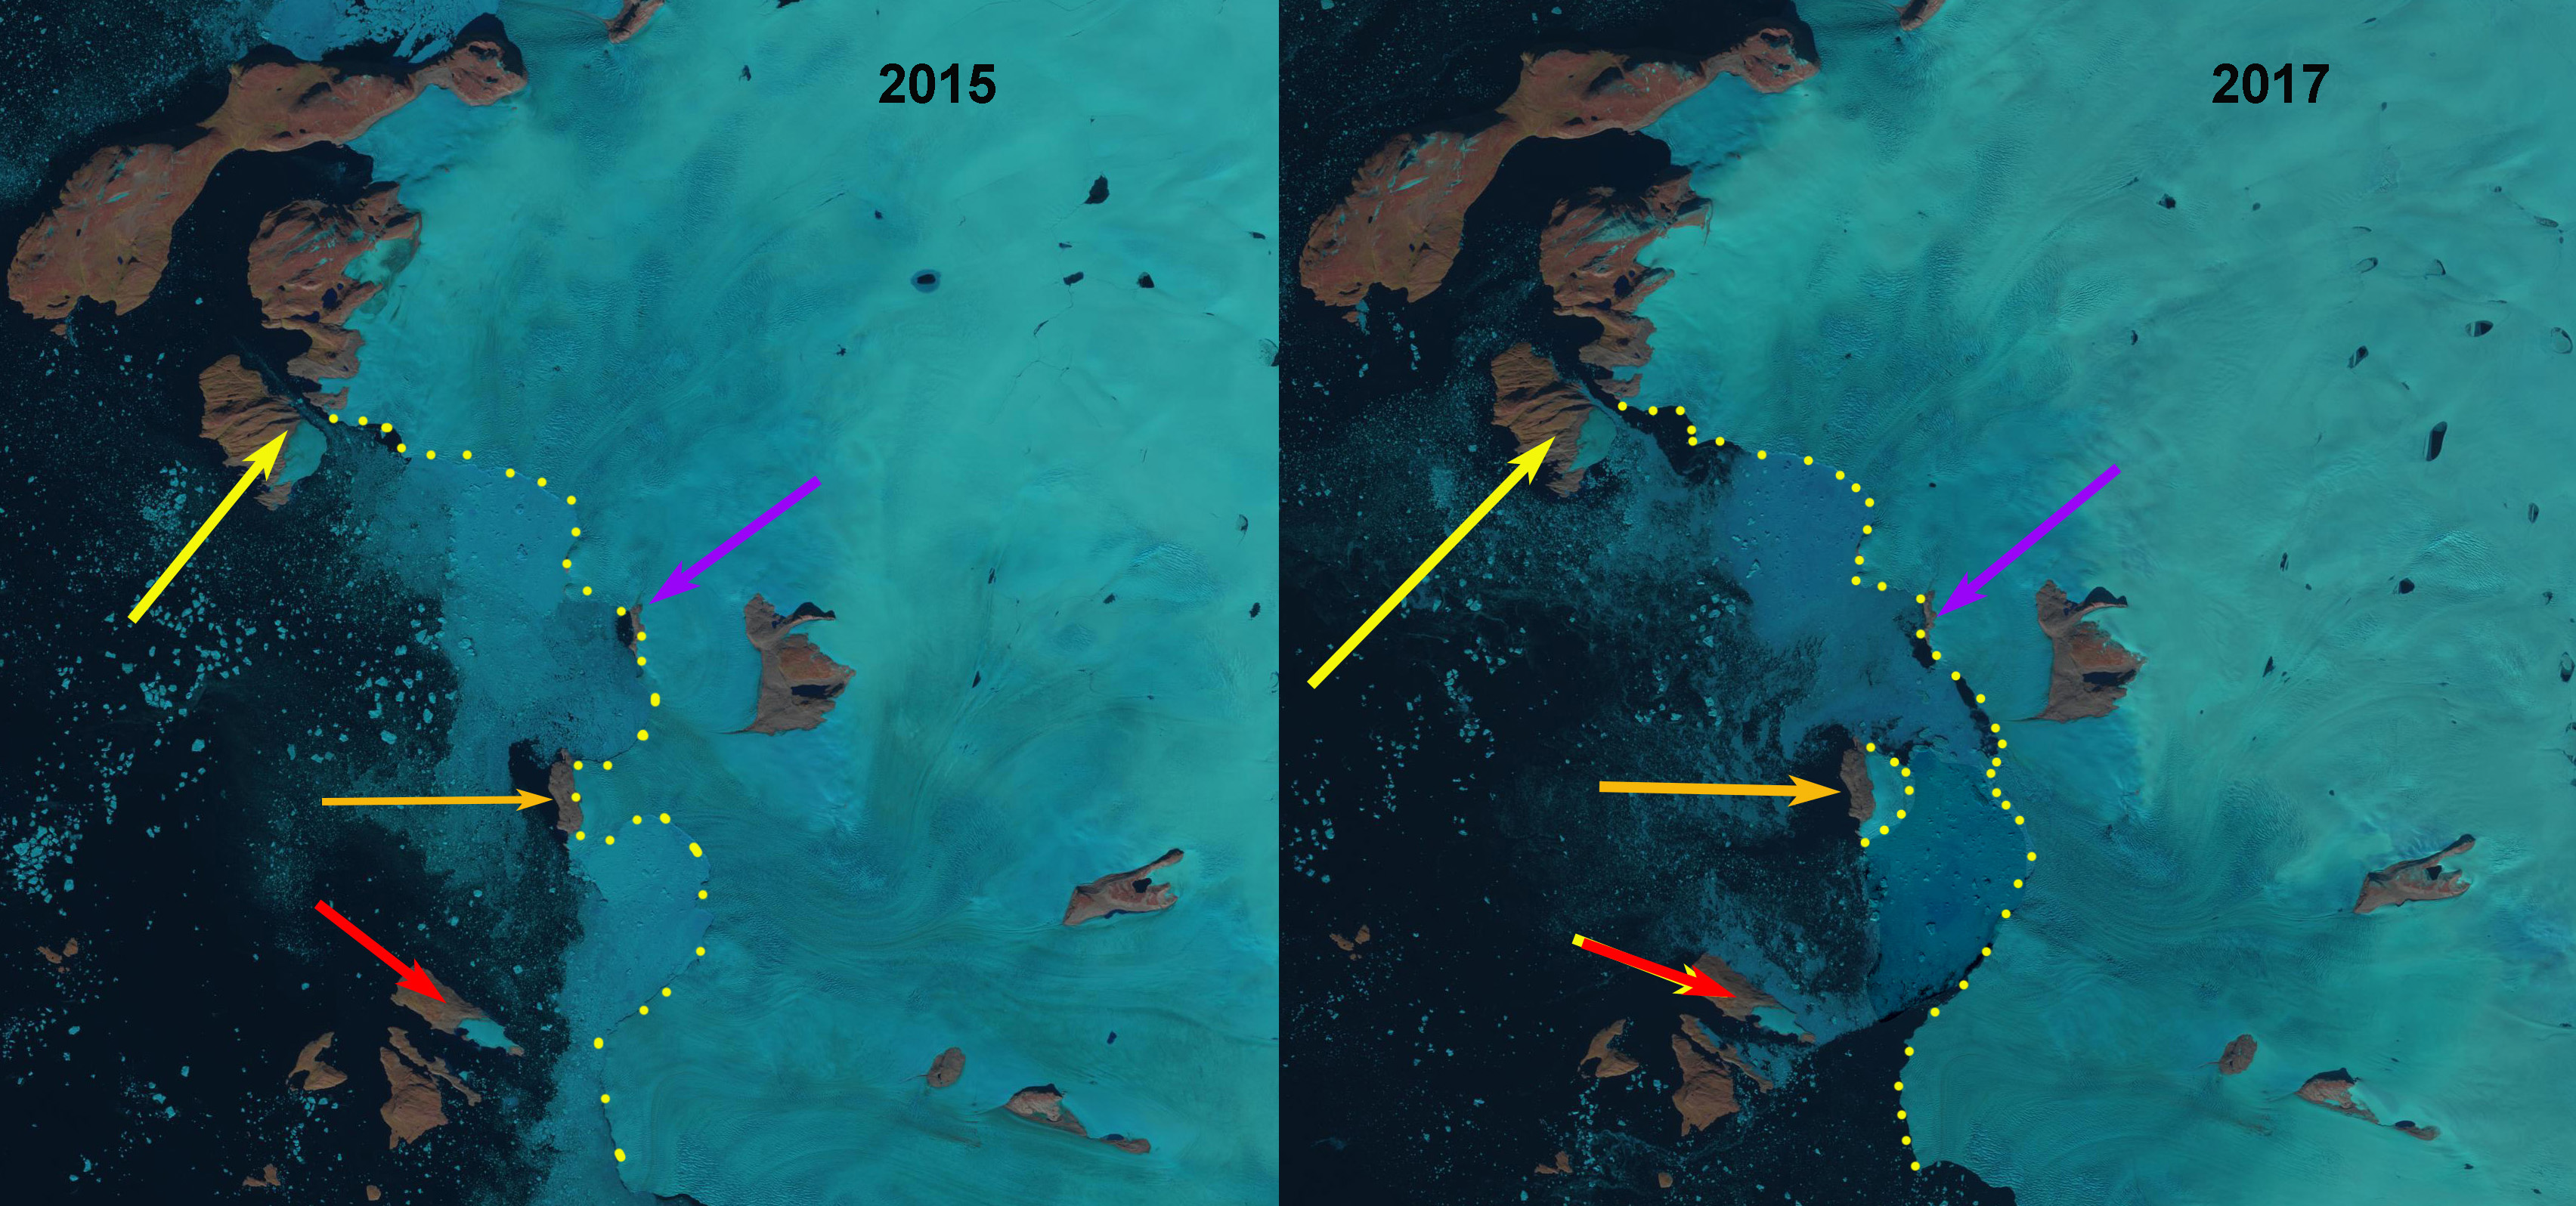
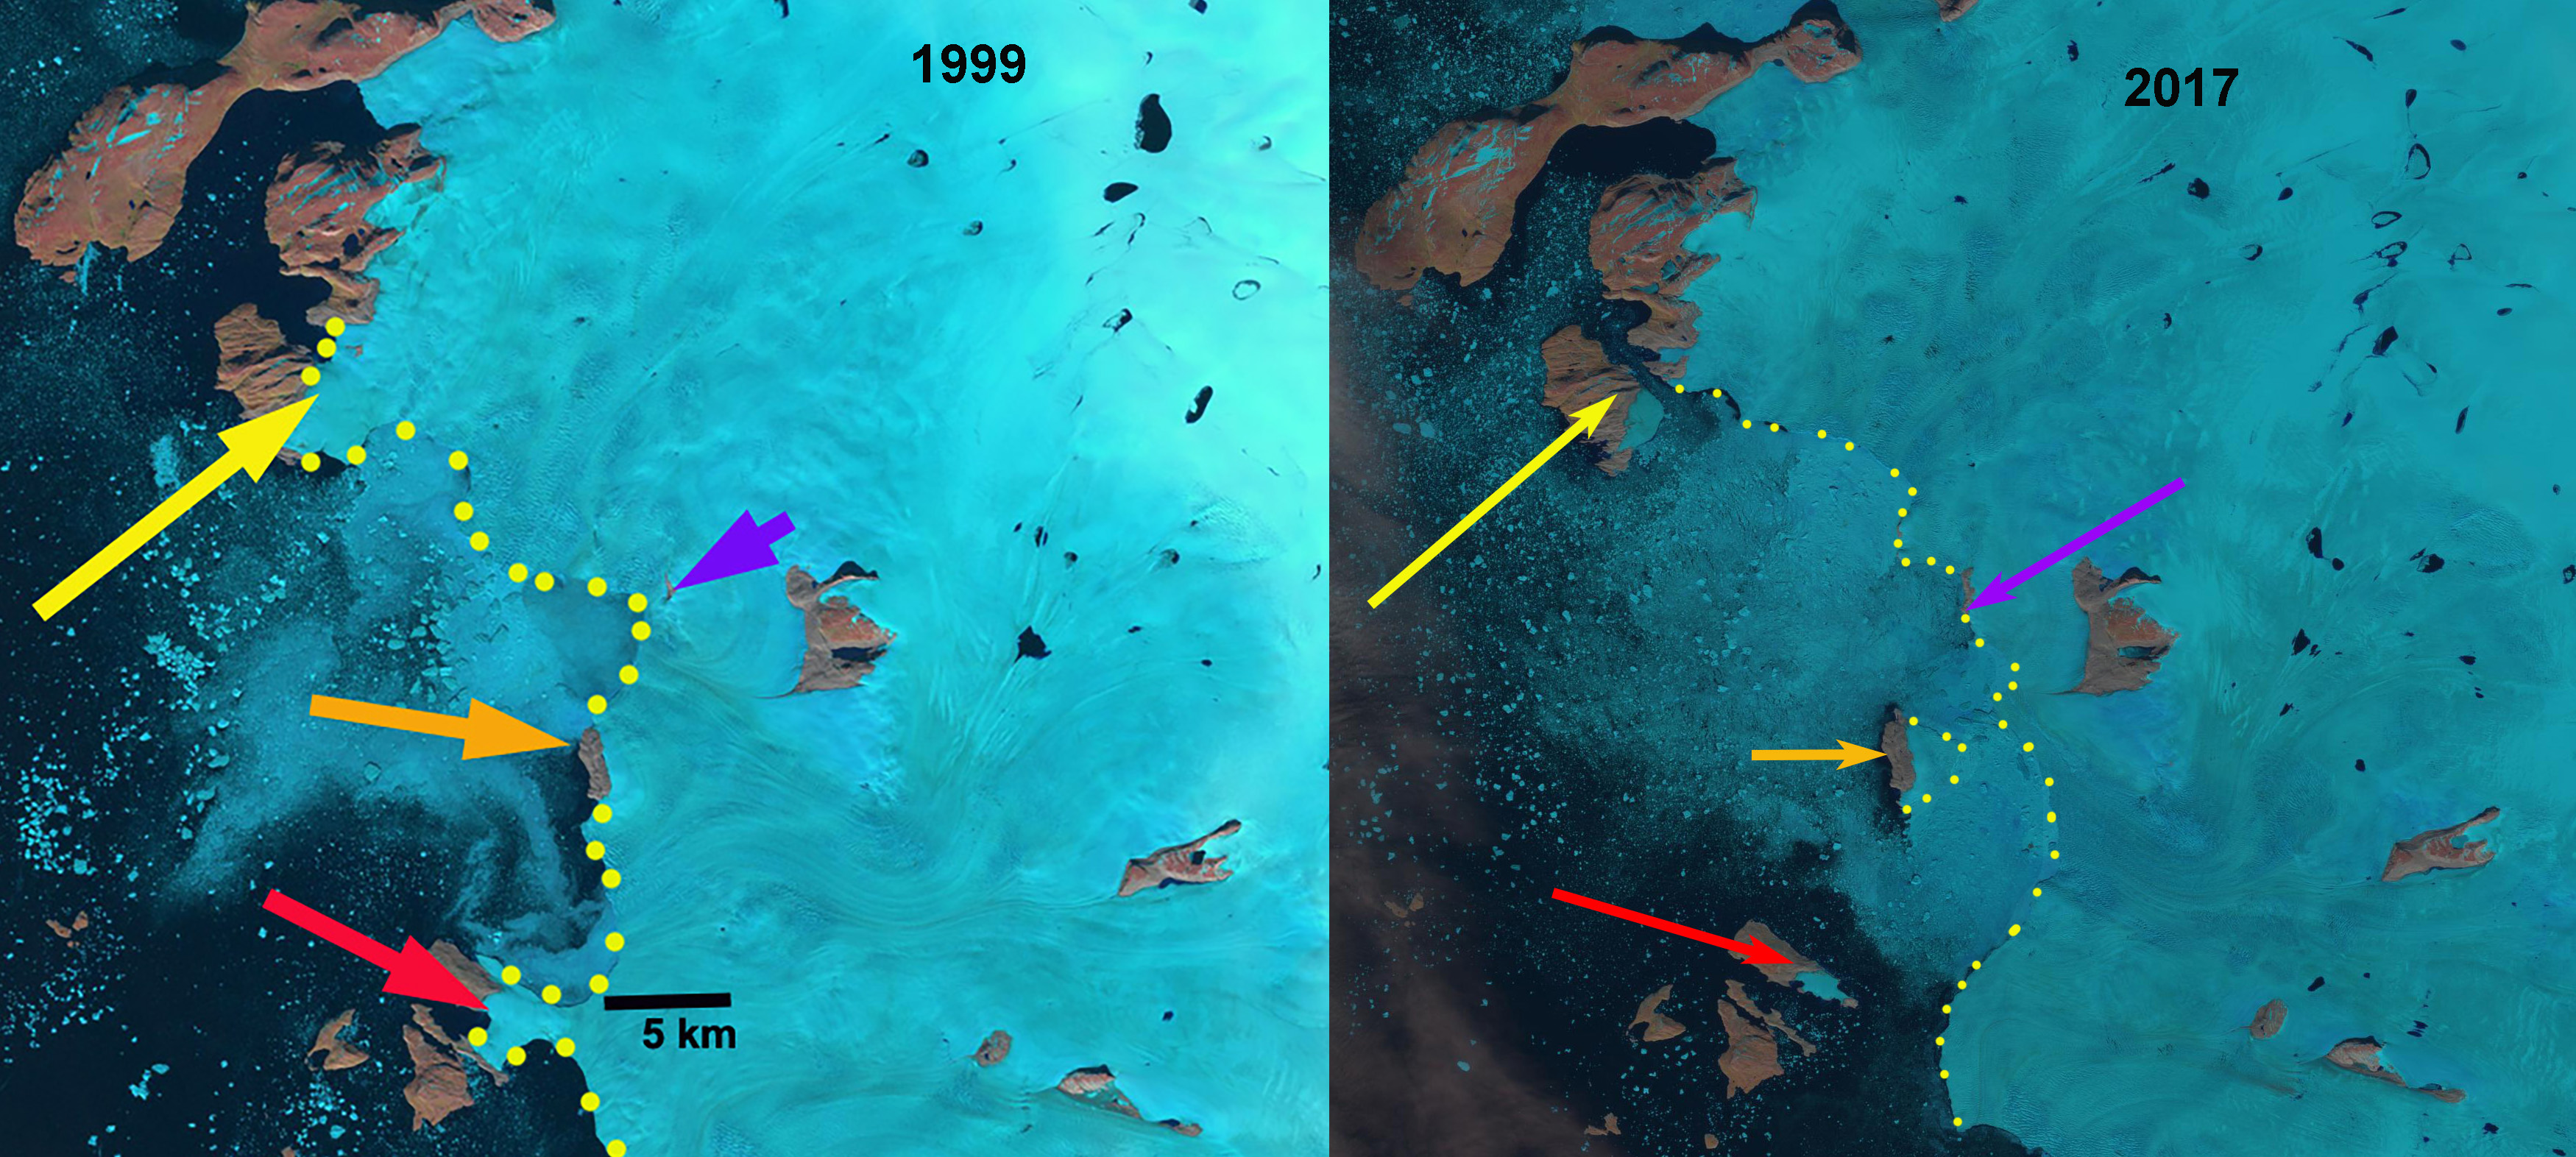
Storstrømmen and L. Bistrup Brae in Landsat imagery from 8-23-2013 and 8-26-2023. Green dots on 2013 image is the 2023 margin. Yellow dots on 2023 image is the 2013 margin. Island A and Island B are at the glacier front in 2013 and are fully separated by 2023. R=Randsoen proglacial lake.

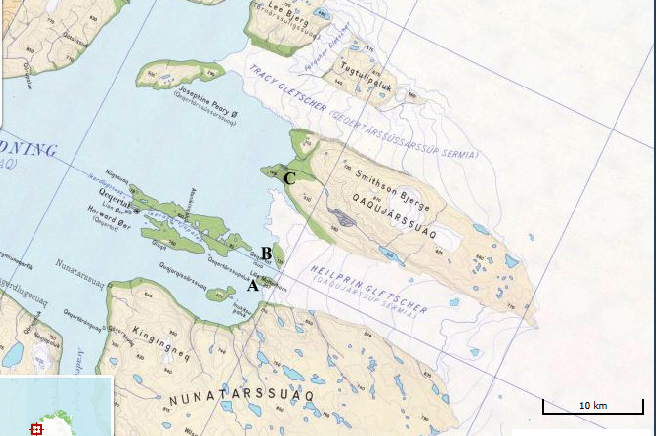
Storstrømmen and L. Bistrup Brae are large outlet glaciers in northeast Greenland that join at their terminus.  The calving front is long and has numerous island pinning points. They comprise a large relatively flat low lying terminus region, the southernmost floating ice tongue in East Greenland. Rignot et al (2022) radio echo soundings in August 2020 reveal a seabed at 350–400 m depth the ice shelf front, with shallower terrain (<100 m) over a 30-km wide region to the east that blocks the access of warm, salty, subsurface Atlantic Intermediate Water. This water would accelerate ice shelf bottom melting. They note a ~23 m thinning near the grounding line on Storstrømmen from 1999-2014. They also report a 1.1 km retreat of the grounding line from 2017-2021. Storstrømmen is a surging glacier fed by the NEGIS, that surged 3 times during the 20th century and is in a quiescent phase. The last surge was in 1978-1982. Mouginot et al (2018) indicate the differential between inland thickening and terminus thinning will yield pre-surge conditions by 2027-2030, this transition in elevation change occurs ~50 km inland of terminus. Grinsted et al (2022) point out that the NEGIS has accelerated and expanded laterally, above a point ~200 km inland, between 1985 and 2018, Storstrømmen terminus area is still slowing. Will these inland changes in the NEGIS impact the next surge cycle?

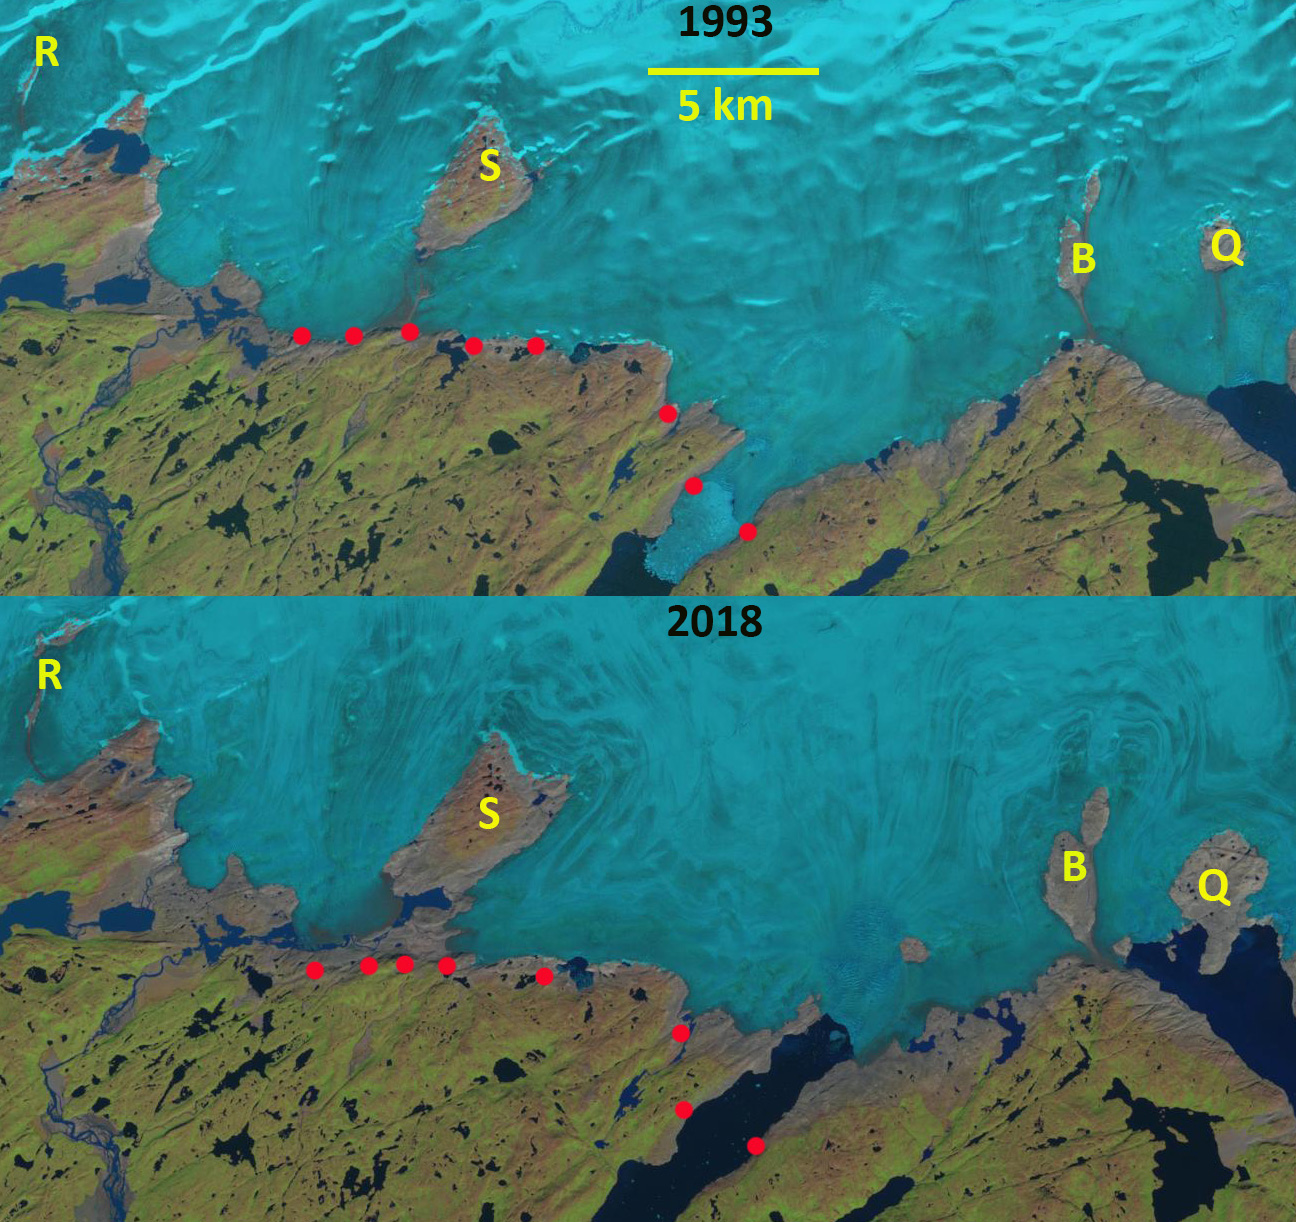
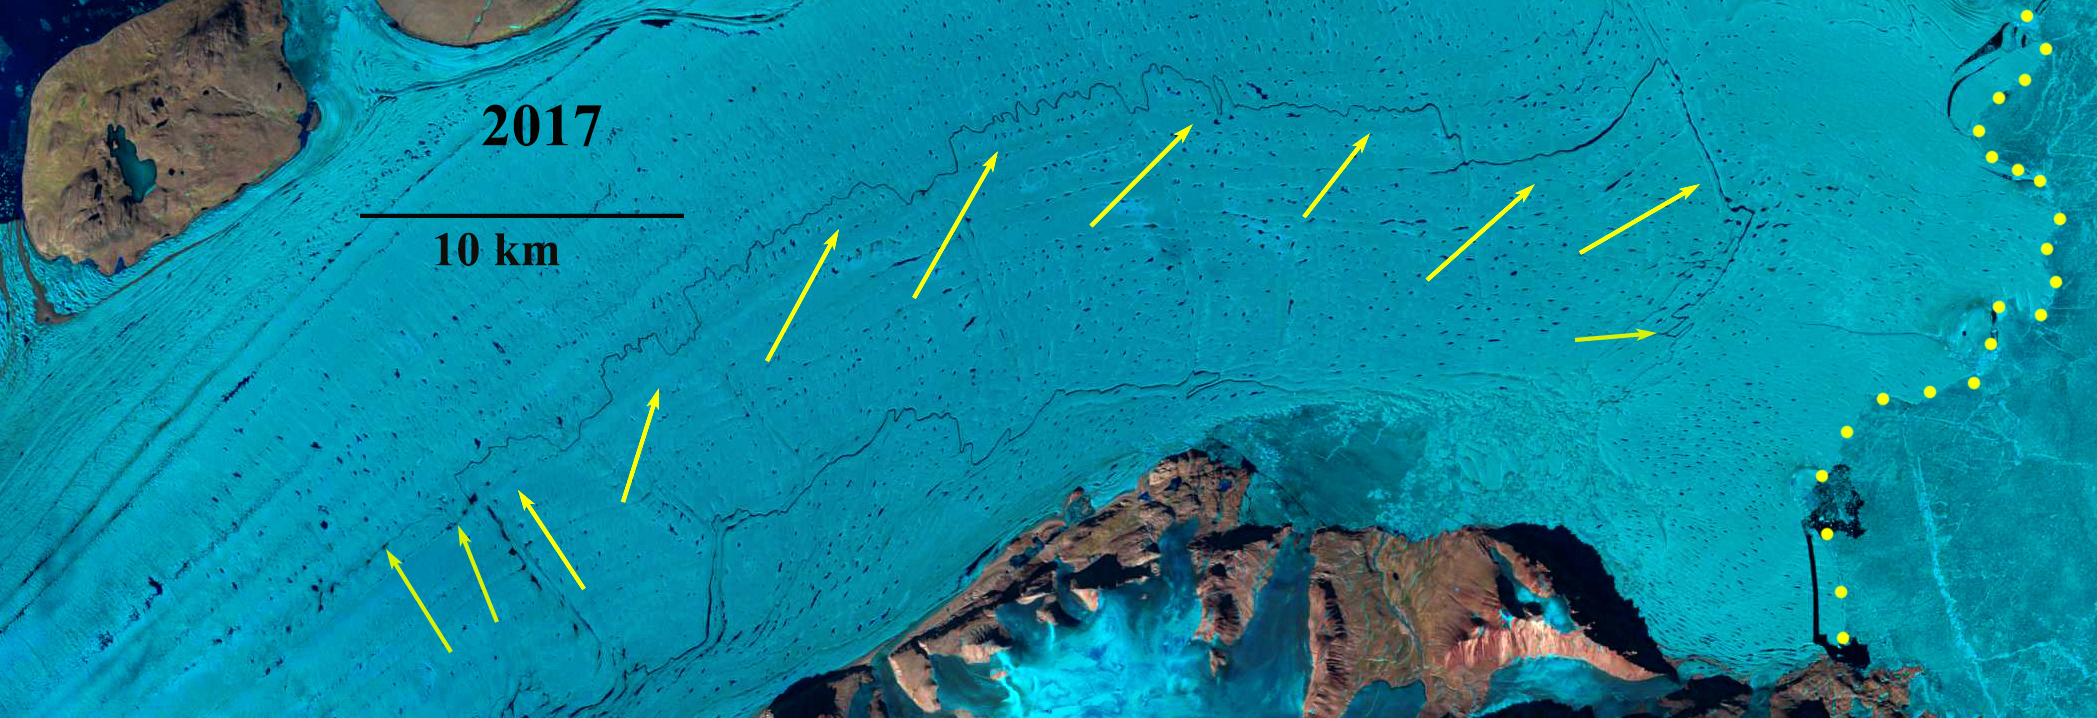
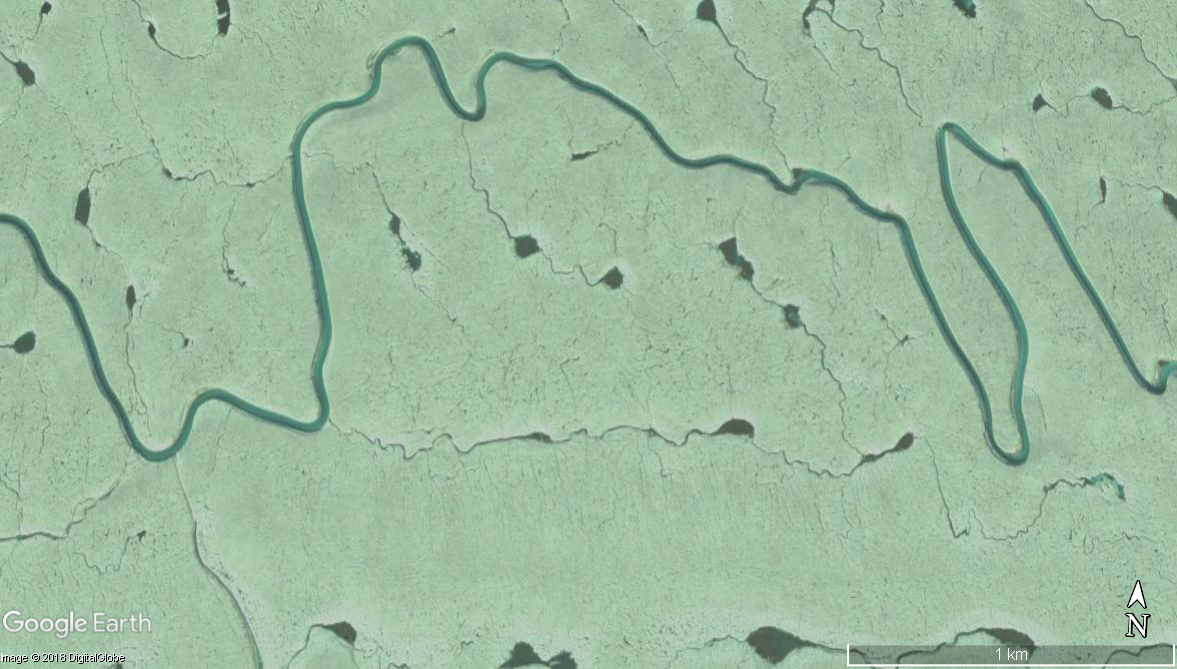
The thinning of the floating ice is leading to retreat and the release of new islands from the glacier. Here we examine Landsat images from 2013 and 2023 to illustrate. Island A is  at the front of Storstrømmen in 2023 is 2.1 km from the ice edge. Island B is at the front of L. Bistrup Brae in 2013 and by 2023 is 0.9 km from the ice edge. The other notable change is the expansion of the Randsøen proglacial lake (Point R). The glacier width between Randsøen and the ice front has narrowed from 10 km to 7 km from 2013-2023, with 2.3 km retreat of the main terminus in the embayment. This embayment with a narrow connection between the two glaciers developed in the early 1970’s, but the two glaciers did remain connected (Mouginot et al 2018).  There is substantial rifting in this section suggesting the next few years will see significant additional rifting. The supraglacial stream that drains Randsøen, flows along the boundary between Storstrømmen and Bistrup. The flow of this stream parts the sea ice in the Aug. 30, 2023 Sentinel image below. Will the glaciers separate in the next decade and how would that impact the next surge cycle? This post is an update to the 2013 post indicating that Storstrømmen is susceptible to rapid retreat

Screenshot

Storstrømmen and L. Bistrup Brae in Sentinel image from 8-30-2023. Island A and Island B  that were at the glacier front in 2013 are fully separated by 2023. R=Randsoen proglacial lake with the yellow arrows indicating surpaglacial stream draining this lake across the glacier and then making a channel through the sea ice and icebergs. Pink arrows indicate rifts that indicate areas prone to calving in next few years.

Isortuarsuup Sermia Lake Drainage September 2022

Isortuarsuup Sermia ice dammed lake drains between 9-9-2022 and 9-19-2022. The lake area on 9-9-2022 is 29 km². False color Sentinel images illustrate.

Isortuarsuup Sermia terminates in Isortuarsuup Tasia on the west margin of the Greenland Ice sheet   at 63.8 N  W. The glacier dams a proglacial lake that when full has had an elevation of 710 m, and has been observed to periodically drain from 1937-2011 (Geological Survey of Denmark and Greenland, Bull. 27, 2012). Here we examine the drainage event between Sept. 9 and Sept 19, 2022 that has resulted in a lower than usual drained lake level.

The history of this lakes filling and drainage has been relatively conistent  period of 8-10 years from 1937-2011 (GEUS, 2012). The typical low lake elevation of ~650 m.  The lake drains along a marginal channel on the north side of the glacier into Isortuarsuup Tasia. The lake is dammed at Point A. The lake level during July 2017 was at 660-670 m, during the fill cycle. By July 2021 the lake was essentially full. The lake had an area of ~29 km² from July 2021 through 9-9-2022. A rapid drainage event occurred by 9-19-2022 stranding many icebergs on the lake bottom, reducing lake area to 10 km². There is no remaining lake along the Isortuarsuup Sermia glaciers northern margin, indicating a lower lake level than typical during drainage, ~630-640 m. There is ice at the front of Isortuarsuup Sermia after this event, likely from small bergs draining down the outlet channel. By 7-8-2023 the lake shows no indication of filling in a Landsat image. Given the lower drainage level of this event, will this lake refill as has been its pattern for the last century? How et al (2021) in an inventory of Greenland Ice Sheet proglacial lakes, noted a 75% increase in lake frequency from 1985 to 2017 along the western margin of the Ice Sheet, with a decline in average lake area. This lake may fit that pattern.

Isortuarsuup Sermia on July 22, 2017 with lake level on the rise at ~680-690 m, false color Sentinel image.


Isortuarsuup Sermia on July 8, 2023 with lake level on the rise at ~640 m, Landsat image.

Figure from GEUS Bulletin 27 (2012) of lake 710 m.


Expanding Proglacial Lakes on Land Terminating Margin of Sermeq Kujalleq

Expansion of proglacial lakes (A-D) along west margin of Greenland Ice Sheet along southern land terminus of Sermeq Kujalleq in 1985 and 2022 Landsat images.

How et al (2021) in an inventory of Greenland Ice Sheet proglacial lakes, noted a 75% increase in lake frequency from 1985 to 2017 along the western margin of the Ice Sheet. In 1985 I had a chance to work on the Sermeq Kujalleq (Jakobshavn Glacier) and observed a few small proglacial lakes along the southern land terminating section of this glacier. At the time we were assessing the volume flux of the glacier, which led us to conclude the glacier was at the time in an equilibrium state (Pelto et al 1989). We were there to map the velocity field before the impacts of climate change kicked in. Here we look at the changes of these lakes from 1985-2022. Image below is from the margin of the glacier a short distance north of Point A, note the prominent trimline in foreground.

In 1985 Lake B and C did not exist, Lake A=0.4 km² and Lake D=2.2 km². By 2002 as the main glacier accelerated, thinned and retreated Lake B (0.9 km²) and C (0.4 km²) formed while Lake A expanded to 0.6 km² and lake D to 3.2 km². By 2022 this new lake district is still expanding with Lake A at km², Lake B at 1.8 km², Lake C at 1.2 km² and lake D at 5.5 km². The total lake area expanded from 2.6 km² to 13.5 km² , a 425% area expansion. Lake A and D are poised to continue expanding, while Lake B and C look to be near maximum size. This region of numerous small lakes being formed by glacial retreat, reminds me of what the  Boundary Waters region along the Minnesota/Ontario border or  Mikkeli region of Finland  would have looked liked as ice sheet retreat occured. Some of these lakes could drain away with continued retreat.

Expansion of proglacial lakes (A-D) along west margin of Greenland Ice Sheet along southern land terminus of Sermeq Kujalleq in 2002 and 2022 Landsat images.

Margin of glacier in 1985 a short distance from Point A. Note trimline of recent deglaciated terrain in foreground.

Proglacial lakes (A-D) along west margin of Greenland Ice Sheet along southern land terminus of Sermeq Kujalleq in 8-27-2022 false color Sentinel images.

Paarliit Sermia, Southern Greenland Terminus Separation

Paarliit Sermia in 2000 and 2020 Landsat images.  The red arrow indicates the 2000 terminus location and the yellow arrow the 2020/21 terminus location. A denotes the junction of two main glacier branches, while B,C and D indicate tributaries

Paarliit Sermia is one of the most southerly tidewater glaciers in Greenland.  It is an outlet glacier of a mountain icefield and not part of the main ice sheet.  Similar to other icefield outlet glaciers whether in Alaska  (Dawes Glacier) or Patagonia (Upsala) retreat is leading to glacier separation. Greenland tidewater outlet glaciers in this region have experienced substantial retreat since 1990, Weidick et al (2012) and Howat and Eddy (2011).  There was also an increase in sea surface temperature (Straneo et al, 2013).  Moon et al (2020) noted a there is a rapid reconfiguration of the Greenland Ice Sheet Coastal margin due to retreat. The retreat of glaciers in southern Greenland is changing the physical geography and hence the physical oceanography of the fjords.  Here we examine Landsat imagery from 2000-2021 to identify the changes of Paarliit Sermia.

The Greenland Topographic map indicates the terminus down fjord from tributary B, 6.5 km from the main junction of two glacier branches at Junction A.  Tributary B, C and D all feed the main glacier. By 2000 the glacier has retreated beyond tributary B and C.  The snowline is between 550 m and 600 m in 2000 and 2002. In 2017 the glacier has retreated beyond Tributary D, and the snowline is slightly above 600 m. The two main branches are still joined, with the terminus now just 1 km from Junction A. Former Tributary C and D no longer reach tidewater. In 2020 the two main branches have separated and Point A is no longer a junction glacier has separated into two branches, the snowline is at ~600 m. In mid-June of 2021, the snowline is already at 500 m, despite being early in summer.  Paarliit Sermia has retreated 2.4 km from 2000-2021, a rate of ~200 m/year.

Nearby Kangersuneq Quingordleq Glacier retreated 2.8 km from 1999-2016. To the northeast Qaleraliq has experienced a 3.2 km retreat of its west arm and 1.2 km of its east arm from 1992 to 2012.   To the northeast Tingmiarmiit Glacier’s retreat from 1999-2015 has led to complete separation of the western and northern tributary. The western tributary is the main glacier and has retreated 2.4 km and the northern tributary has retreated 2.2 km in the 16 year period. In the case of nearby Tasermiut Fjord retreat has led to the fjord losing its tidewater connection.

Paarliit Sermia in 2002 and 2017 Landsat images.  The red arrow indicates the 2000 terminus location and the yellow arrow the 2020/21 terminus location. A denotes the junction of two main glacier branches, while B,C and D indicate tributaries

Paarliit Sermia in 1980’s Greenland Topographic map (from Nuna GIS) and 2021 Landsat images.  In the Landsat image the red arrow indicates the 2000 terminus location and the yellow arrow the 2020/21 terminus location.  On both map and image A denotes the junction of two main glacier branches, while B,C and D indicate tributaries

Hutchinson Glacier, Greenland Releases New Island

Cape Deichmann becomes an island as it disconnects from Hutchinson Glacier. Landsat images from 2010 and 2019.

The Hutchinson (H) and Polaric Glacier (P) region of East Greenland indicating three locations of island forming or about to form in 2010 and 2019 Landsat images.  Point #1 is Flado Island, Point #2 and Point #3 is Cape Deichmann

Ziaja and Ostafin (2019)  noted the formation of a new island at Cape Deichmann (3) due to recession of Hutchinson Glacier (H). Here we use Landsat images from 2010-2019 to examine the release of this island and other islands and pinning points  in the Hutchinson and Polaric Glacier area. This is one of a growing number of examples of glacier retreat leading to island formation.

In 2010 a tongue of Hutchinson Glacier connects to Cape Deichmann.  Hutchinson Glacier also connects to five other islands along its front, helping provide stability to the ice front.  Pinning points such as these islands reduce calving directly (Hill et al 2017), but also suggest limited water depth, which would reduce the impact of warm ocean water.  The center of Polaric Glacier also has Island #2 that provides stability.  At Flado Island (#1) the west margin of Polaric Glacier does not reach this island, but a melange of ice fills the space between the glacier front and the island, which does provide a degree of stability (Moon et al 2015). In 2012 there is no change in the Cape Deichmann or at Island #2.  Flado Island has lost its melange during this summer of exceptional warmth, but an ice tongue still reaches to within 1 km of the island.  In 2015 there is no change at Cape Deichmann or at Island #2.  The gap between the Polaric Glacier front and Flado Island is filled by a melange again.  In 2019 the Hutchinson Glacier ice tongue to Cape Deichmann is gone.  The ice front is now 0.6 km from the now Deichmann Island.  Island #2 is still embedded in the Polaric Glacier front.  Flado Island  has lost its melange in the warm summer of 2019, the central ice front of Polaric Glacier has also retreated 1.5 km, while the east and west margins changed little.  This will make it more difficult to develop a persistent melange of ice between the glacier front and Flado Island. There will be new island formed in the near future in this region.

The Hutchinson (H) and Polaric Glacier (P) region of East Greenland indicating three locations of island forming or about to form in 2010 and 2019 Landsat images.  Point #1 is Flado Island, Point #2 and Point #3 is Cape Deichmann

Flado Island with the removal of the melange in front of Polaric Glacier and the retreat of the glacier front from 2010-2019.

Map of the Hutchinson Glacier terminus region.

Sonderarm Glaciers Retreat, Southern Greenland

Three glaciers at the head of Sonderarm fjord in 1999 and 2018 Landsat images.  Yellow arrows indicate terminus location in 2018 of each glacier, pink arrow indicates a separate valley glacier that has diminished.

Sonderarm is a fjord that extends south from Lindenow Fjord in southern Greenland. The glacier is a short distance east of Kangersuneq Qingordleq, where recent retreat has led to glacier separation and a just south of Norrearm where glacier retreat has led to fjord extension.

In 1999 the Eastern Sonderarm Glacier (ESG) extended beyond its inlet into Sonderarm.  The Southern Sonderarm Glacier (SSG) extended to the end of its arm of the fjord.  The Northern Sonderarm Glacier (NSG) terminated 600 m from the end of its arm of the fjord.  At the pink arrow the separate valley glacier was just in contact with tidewater.  By 2002 there was significant narrowing of the terminus front of ESG and the separate valley glacier no longer reaches tidewater.  There is considerable calving in Sonderarm, with NSG appearing to be the most active. In  2017, the snowline is relatively high at 700-800 m in early August, there is limited calving evident in Sonderarm.  By 2018 the retreat of NSG is 1100 m since 1999, of SSG 1300 m and of ESG 400 m with a significant reduction in the width of the calving front. The snowline in 2018 is again above 700 m in early August.  There are no evident icebergs in Sonderarm.  The separate valley glacier now terminates 300 m from tidewater.  The reduction in calving accompanying retreat indicates that it is surface melt as indicated by higher snowlines that is driving retreat of the Sonderarm glaciers.  NSG begins at 1200 m with only a limited area above 1000 m, while ESG and SSG begin at 1000 m.

Greenland tidewater outlet glaciers in this region have experienced substantial retreat since 1990 (Weidick et al 2012).  Murray et al (2015) examined 199 tidewater glaciers in Greenland and noted significant retreat of 188 of them.

Three glaciers a the head of Sonderarm fjord in 2002 and 2017 Landsat images.  Yellow arrows indicate terminus location in 2018 of each glacier and purple dots the snowline.

Sonderarm region map with glacier flow of the three Sonderarm glaciers in blue.  Pink arrow indicates valley glacier that has diminished and formerly reached tidewater.

Glaciers Retreat from Evighedsfjord, Greenland

Evighedsfjord (E) with glaciers terminating in the fjord in 2000 and 2018 Landsat images. Q=Qingua Kujatdleq is at the head of Evighedsfjord (Q), Tapa Glacier (1), Unnamed glaciers (2 and 3), and developing nunatak area (4) .  The red arrow is the 2000 terminus and the yellow arrow is the 2018 terminus. 

Evighedsfjord (Kangerlussuatsiaq Fjord) in southwest Greenland has numerous glaciers that reach or did reach this 75 km long fjord. Here we examine the termination of the fjord at Qingua Kujatdleq. Here we examine Landsat imagery from 2000, 2002, 2014 and 2018 to identify changes in four glaciers that in 2000 terminated in the fjord. Leclercq et al (2012) note that the glacier retreated 1.5 km from 1850-2009.

In 2000 Tapa Glacier (1) terminated in the fjord. Glacier #2 and #3 also terminated in the fjord in 2000. Quingua Kujatdleq Glaicer terminated at the red arrow, and #4 represents small nunataks within the ice. The snowline is at ~1000 m.  In 2002 all four glaciers reach Evighedsfjord still and the snowline is at ~1000 m.  There are no evident sediment plumes where the glaciers reach the fjord.  By 2014 only Qingua Kujatdleq still reaches the fjord, the snowline is at ~1100 m.  There is a sediment plume emanating from Tapa Glacier. In 2018 Qingua Kujatdleq has retreated 2200 m since 2000. This is a greater retreat than Leclercq et al (2012) show for the entire 1850-2009 period.  Tapa Glacier has retreated ~500 m and no longer reaches the ocean and has a persistent summer sediment plume. Glacier #2 no longer reaches the ocean having retreated 500 m.  Glacier #3 no longer reaches the ocean having retreated 300 m.  The two small bedrock outcrops at #4 in 2000 have merged into one large nunatak by 2018.   The loss of glacier ice reaching fjords has also been documented at Alangordlia Fjord and Tasermiut Fjord.

Evighedsfjord (E) with glaciers terminating in the fjord in 2002 and 2014 Landsat images. Q=Qingua Kujatdleq is at the head of Evighedsfjord (Q), Tapa Glacier (1), Unnamed glaciers (2 and 3), and developing nunatak area (4) . The red arrow is the 2000 terminus and the yellow arrow is the 2018 terminus.

Greenland topographic map of the region right and 2018 Landsat image of with Qingua Kujatdleq (Q), Tapa Glacier (Point 1). Unnamed glaciers #2 and #3 also noted. 

Sermip Nunataa, Greenland No Longer a Nunatak

Sermip Nunataa (S) and nearby nunataks in 1993, Q, R and B in 1993 and 2018 Landsat images.  Red dots indicate the 1993 margin. 

Sermip Nunataa (Nunatak-Island within ice sheet glacier) was a nunatak of the southern Greenland Ice Sheet between Sermilik Brae and Sondre Qipisaqqu Brae.  Here we examine changes from 1993-2018 of the margin of the ice sheet in the area and the impact on this and neighboring nunataks.

In 1993 the Sermip Nunatak was 2.5 km inland from the ice sheet margin.  At Nunatak R there is a single short ridge, 1.5 km long.  Nunatak Q is 3 km from margin and Nunatak B is 1.5 km from margin.  By 2004 the two glacier tongues encircling Sermip are beginning to separate. Nunatak R is 2 km long. Nunatak B has expanded in length and width. Nunatak Q is now just reaching the glacier front.  By 2017 Sermip is no longer a nunatak and a second ridge has formed at Nunatak R.  By 2018 only one of the four nunataks remains surrounded by ice and is still an a nunatak.  The mass loss and recession in this area is due to surface melt as there is very limited calving at the ice fronts.   The retreat of Qaleraliq (Nunatak B and Q) and of Tasermiut are other example of local glacier retreat. Glaciers in this region have experienced substantial retreat since 1990 Weidick et al (2012) and Howat and Eddy (2011)NSIDC (2018) illustrates that 2018 had a positive melt day anomaly in this region of the GIS.

Sermip Nunataa (S) and nearby nunataks in Greeland Topographic map.

Sermip Nunataa (S) and nearby nunataks in 1993, Q, R and B in 2004 Landsat image.  Red dots indicate the 1993 margin. 

Sermip Nunataa (S) and nearby nunataks in 1993, Q, R and B in 2017 Landsat image.  Red dots indicate the 1993 margin. 

Nioghalvfjerdsbræ 70 km+ Long Supraglacial stream, Greenland’s Longest?

Landsat image of Nioghalvfjerdsbræ in 2017 with supraglacial stream indicated by arrows and calving front yellow dots. 

I first observed the impressive discharge and length of the supraglacial streams working on Jakobshavn Glacier more than 30 years ago.  The longest persistent supraglacial stream in Greenland at present that I am aware of is on Nioghalvfjerdsbræ (79 Glacier).  The longest streams will occur on glaciers with low slopes in the ablation zone and limited crevassing, suggesting an extended region of compressive flow. The compressive flow and low slope also would help suppress moulin formation. Rignot et al (1997) first noted that flux from glaciers in this region was 3.5x the iceberg production due primarily to ice loss from basal melt, Nioghalvfjerdsbræ has a 20 km wide ice shelf, and the bed remains below sea level over a distance of 150 km upstream from the grounding line, and 200 km inland of the calving front, as indicated Bamber (2013). The basal melt rate in this reach is comparatively low  less than 10 m per year maximum and ~5 m per year average seen in figure 2 from Wilson et al (2017) and.  The velocity declines from 1000 m/year near the start of the stream to less than a 100 m/year near the calving front.

Landsat image of Nioghalvfjerdsbræ in 2011 with supraglacial stream indicated by arrows. 

The supraglacial stream indicated in the 2011 and 2017 images along most of its length has the same path.  The streamflow directly to the ice front in 2011 with a length of 73 km without measuring secondary wiggles.  In 2017 the stream  turns south to reach southern margin with a length of 71 km.  Below are three images of the stream in 2014 Google Earth images.  The width of the stream remains relatively constant over most of the length ranging from 20-35 m.  You can also see how the stream drains numerous small supraglacial lakes.  This reduces the size of the lakes and on Petermann Glacier, was observed to reduce the destabilizing nature of the lakes on the floating tongue (Macdonald et al, 2018).  The smaller lakes are less likely to develop moulins or force fracture propagation. This stream survival depends on not encountering a moulin or crevasse.  In West Greenland the melt rates are higher and the surface slopes greater where the detailed observations of supraglacial streams and moulins have led to model development for stream discharge see the fantastically detailed work of Banwell et al (2012) and  (Smith et al., 2017)

Lower reach of supraglacial stream

Mid reach of supraglacial stream

Upper reach of supraglacial stream

Heilprin Glacier, NW Greenland Pinning Point Decline 1987-2017

Heilprin Glacier in 1987 and 2017 Landsat images.  The ice front is shown with yellow dots. Island A, Island B and Point C also are noted. Island A and B both have reduced ice contact, but remain as important pinning points. How much longer for Island A?  Retreat from 1987-2017 is 1.6 km to the south, 1.1 km in the center and 2.2 km on the northern margin.

Heilprin Glacier is an outlet glacier in northwest Greenland. Along with the neighboring Tracy Glacier it drains ~12,000 square kilometers of the ice sheet into Inglefield Bay.  Hill et al (2017)  note that neither glacier has a floating tongue and that Tracy Glacier has retreated faster. The velocity of Tracy Glacier is also higher than Heilprin Glacier, with most of the calving front exceeding 1200 m/year (Joughin et al, 2010).  Heilprin Glacier has a only a narrow section on the northern side that exceeds 1000 m/year (Joughin et al, 2010). Sakakibara and Sugiyama (2018) examined glacier velocity and frontal positions of 19 glaciers in the region including Tracy and Heilprin Glacier. They  observed that retreat began in ~2000 which coincided with a regional rise in summer mean air temperature.  The outlet glaciers also accelerated and those that did had the greatest acceleration generally retreated the most. Here we examine Landsat images from 1987-2017 illustrating terminus changes.

In 1987 The Heilprin Glacier front was 12 km long with two islands providing pinning points and separating the terminus into three calving regions.  The southernmost was south of Island A, Lille Matterhorn, which was 1.7 km wide and extended 1.6 km west from the east end of Lille Matterhorn, total ice contact was 2.4 km.  Island B was in contact with the ice on the east side from the southwest to the northwest corner, 3.5 km.  The northern segment was the longest calving front at 5.6 km ending at Point C.  By 1998 the glacier southern segment at Island A had changed little. Island B was still in contact with the ice along its east side from the southwest to northwest corner.  The northern segment had retreated from Point C by 1.4 km.  In 2009 retreat south of Island A has begun. In 2017 at Island A the glacier was barely in contact with the island with the southern most calving section having retreated 1.5 km since 1987.  Island B was still in contact with ice on the east side from the southwest corner, but no longer at the northwest corner.  retreat from the northwest corner is 1.1 km. The total contact with Island B in 2017 is 2.6 km, 70% of the 1987 contact.  At Island A the contact is 0.2 km a 90% reduction since 1987.  When Island A separates the loss of this pinning point will enhance retreat of the southern section of the ice front. The northern margin near Point C has retreated 2.2 km since 1987. Sakakibara and Sugiyama (2018)  identify a velocity change in the terminus reach of 13 m/a from 2000-2014.  They also note the retreat rate increased to 109 m/year from 2000-2014.

Heilprin Glacier in 1998 and 2009 Landsat images.  The ice front is shown with yellow dots. Island A, Island B and Point C also are noted. 

Nuna GIS map of the region indicating Island A and B and Point C. The margin here is from before 2000. 


Sermeq Kuadtleq, Greenland Retreat Island Development Nunatak Expansion.

Sermeq Kuadtleq in Landsat images from 1999, 2013 and 2017.  The red arrow is the 1999 terminus location, yellow arrow is the 2017 terminus location. Nunatak 1 and 3 are noted and the developing Island 2. 

Sermeq Kuadtleq (not only glacier in Greenland with this name) flows south to Prince Christian Sound from an icecap peripheral to, but connected to the Greenland Ice Sheet.  As such the glacier is not impacted directly by ice sheet changes.  Here we examine changes from 1999-2017. Greenland tidewater outlet glaciers in this region have experienced substantial retreat since 1990 Weidick et al (2012) and Howat and Eddy (2011). Tasermiut Fjord and Alangordlia Fjord are southern Greenland fjords that have lost their tidewater glacier connections. Kangersuneq Qingordleq is a similar example near Prince Christina Sound that is a retreating tidewater glacier that is not connected to the main GIS.

In 1999 the glacier extends to within km of the main sound, red arrow on west margin.  There are two nunataks noted Nunatak 1 is in the ablation zone and Nunatak 3 is in the accumulation zone.  In 1999 and again in 2002 the snowline is a short distance above Nunatak 1 at 600-650 m.  By 2013 the glacier has retreated expanding the fjord, and a new island at the margin, Island 2 has emerged from beneath ice and is helping stabilize the east half of the terminus.  Nunatak 1 and 3 are also more expansive. In 2013 and 2016 the snowline is at 700 m.  In 2017 the western margin of the glacier has retreated 1600 m since 1999 and eastern margin has retreated 600 m.  The connection to Island 2 is also been reduced since 2013. Once the connection is lost the east margin will retreat faster.  The glacier is still a tidewater glacier, but is within a km of what will be the head of the fjord, based on the steep surface slopes shortly above the terminus.  The glacier will lose its connection to tidewater like glaciers in Tasermiut Fjord.  Currently the retreat is relatively rapid like other tidewater glaciers near the southern edge of the GIS.  The glacier just to the east has lost connection to tidewater, pink arrow, note on map as emptying into Sermilerajik. The behavior of this glacier matches other nearby glaciers including  Kangersuneq Qingordleq and the glacier entering the Kangerdluk Fjord just to the west (This is again not the only fjord with this name).

Greenland topographic map, from Nuna GIS, of the eastern end of Prince Christina Sound.  Note blue arrow indicates Sermeq Kuatdleq and pink arrow Sermilerajik, which no longer reaches tidewater. 

Sermeq Kuatdleq in Landsat images from 2002 and 2016.  The red arrow is the 1999 terminus location, yellow arrow is the 2017 terminus location. Nunatak 1 and 3 are noted and the developing Island 2. 

Steenstrup Glacier, NW Greenland Releases New Island in 2017

Steenstrup Glacier front in 2015 and 2017 illustrating location with respect to the new islands at: Red Head-red arrow, Tugtuligssup Sarqardlerssuua at yellow arrow , and the 2017 new island at orange arrow.  Yellow dots indicate icefront and purple arrow another future island to be released from the glacier.  

Steenstrup Glacier is located at 75.2 N in Northwest Greeland terminating in Melville Bay. The glacier terminates on a series of headlands and islands, the glacier immediately to the south is Kjer Glacier. The boundary between Steenstrup Gletscher and Kjer Glacier is Red Head and Steenstrup Glacier’s northern margin is at Cape Seddon. A previous post examined changes in the terminus position of Steenstrup and Kjer Glacier from 1999 to 2013 including formation of a new island at Red Head.  Another post in 2014 examined the formation of an additional island at Tugtuligssup Sarqardlerssuua.  Here we report formation of another new island at the glacier front in 2017 that is southwest of the Kloftet Nunatak.  The islands act as pinning points stabilizing the front, when a connection is lost there is typically a significant retreat of the glacier in the vicinity of the new island. 

In 1999 the Front of Steenstrup was pinned on three headlands at the yellow, orange and red arrows.  By 2005 the glacier had retreated from Red Head (Van As, 2010).  By 2013 the connection of ice at the yellow arrow at Tugtuligssup Sarqardlerssuua was thin and on the verge of failure which did occur in 2014.  In 2015 the connection to the pinning point at the orange arrow was thinning, this continued in 2016 and failed in 2017 creating a new island.  Retreat from Red Head 2005 to 2017 is 6 km, retreat from the orange arrow pinning point from 2016 to 2017 is 4 km and retreat at Tugtuligssup Sarqardlerssuua from 1999-2017 is 3 km.  The ice front is approaching Kloftet Nuntak just south of the purple arrow. McFadden et al (2011) noted several glaciers in Northwest Greenland Sverdrups, Steenstrup, Upernavik, and Umiamako that had similar thinning patterns. Each glacier also had a coincident speed-up with a 20% acceleration for Steenstrup Glacier (McFadden et al, 2011). This is a familiar pattern with thinning there is less friction at the calving front from the fjord walls, pinning points and the fjord base, leading to greater flow. The enhanced flow leads to retreat and further thinning, resulting in the thinning and the acceleration spreading inland.  Changes in the position of the ice front can also be viewed at  the Polar Portal.

Steenstrup Glacier front in 1999 and 2017 illustrating location with respect to the new islands at: Red Head-red arrow, Tugtuligssup Sarqardlerssuua at yellow arrow , and the 2017 new island at orange arrow.  Yellow dots indicate icefront and purple arrow another future island to be released from the glacier.  

Steenstrup Glacier front in 2016 indicating connection still to the pinning point that becomes an island in 2017, orange arrow.