Shafat Glacier Separation and Stagnation, India

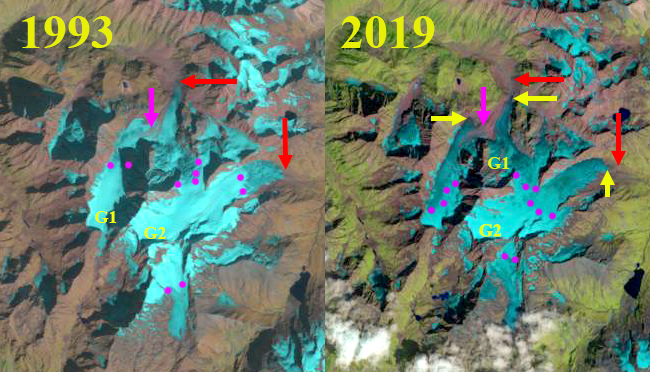
Shafat Glacier in 1997 and 2020 Landsat images.  1-6 are different tributaries with the main glacier being #1. A marks the junction of #1 and #6.

Shafat Glacier occupies the northeast flank of Nun Kun Peak in Ladakh India and drains into the Suru valley. The main valley glacier (1) has been fed by a decreasing number of tributaries. Shukla et al (2020) identified an increase in annual temperature has driven a 6% loss in regional glacier area and a 62% expansion in debris cover from 1971-2017. Here we compare Landsat imagery from 1997-2020 to identify this glaciers response to climate change.

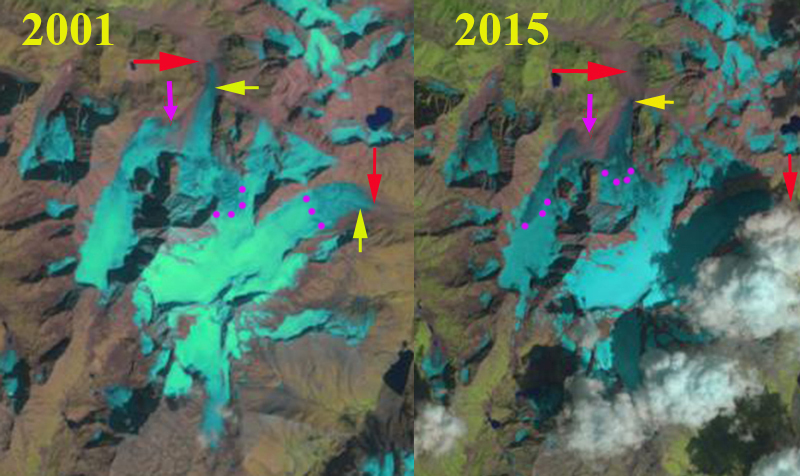
In 1997 and 1998 tributary 2 and 3 join and then the debris covered sections connects to the main valley glacier #1. Tributary 4 terminus is the meeting point of two glacier tongues.  The active non-debris covered ice of Tributary #6 reaches to the valley adjacent to Point A where it meets the main valley tongue.  The active clean ice of the main tongue extends beyond Point A.  In 1997-2000 the terminus is heavily debris covered with the main discharge from beneath the glacier at Point B.  The active ice of Tributary 6 extends to within 1.5 km of the terminus, while the active/clean ice of the main tongue extends to within 1.3 km of the terminus. The snowline is at 4900 m in 1997 and 5100 m in 1998. By 2018-2020 the active ice area now ends 2.5  km from the terminus for Tributary 6 and 5.1 km from the terminus for the main glacier.  Debris cover extends 5.3 km from the terminus up the main tongue and 2.7 km from terminus at Point B up Tributary 6. Retreat is hard to discern with the extensive stagnant debris covered area. Tributary 4 has separated into two parts, and tributary 2 and 3 have separated from each other and the main valley glacier. In 2018 the snowline is at 5200 m, while in 2020 it is 5050 m.  The consistent high snowlines have led to glacier thinning, debris cover expansion, and increasing stagnation of the main glacier tongue. The stagnation is indicated by the increasingly concave cross profile and the lack of crevassing in the lower 5 km of the main glacier tongue below 4600 m. The low slope of the glacier from 4250-4400 m, of 4.8% suggests a proglacial lake could form in this reach of the main valley.

The glacier volume loss is more substantial than the area loss, with retreat less than on Kolahoi Glacier, but volume loss similar (Rashid et al 2019). Loss of glacier area leads to summer glacier runoff declines, which impacts irrigation Rashid et al 2019). The Suru River also has a 44 MW run of river Chutak Hydropower plant.

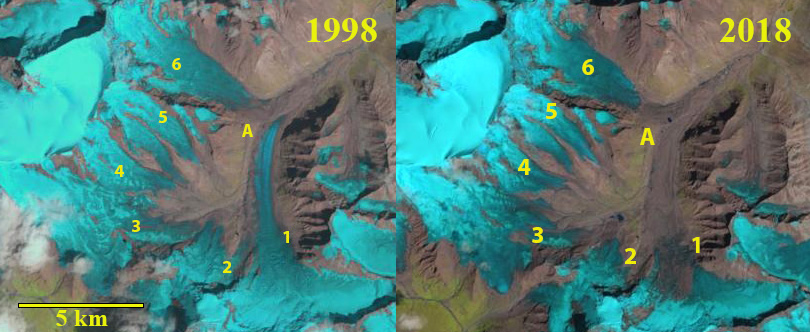
Shafat Glacier in 1998 and 2018 Landsat images.  1-6 are different tributaries with the main glacier being #1. A marks the junction of #1 and #6.

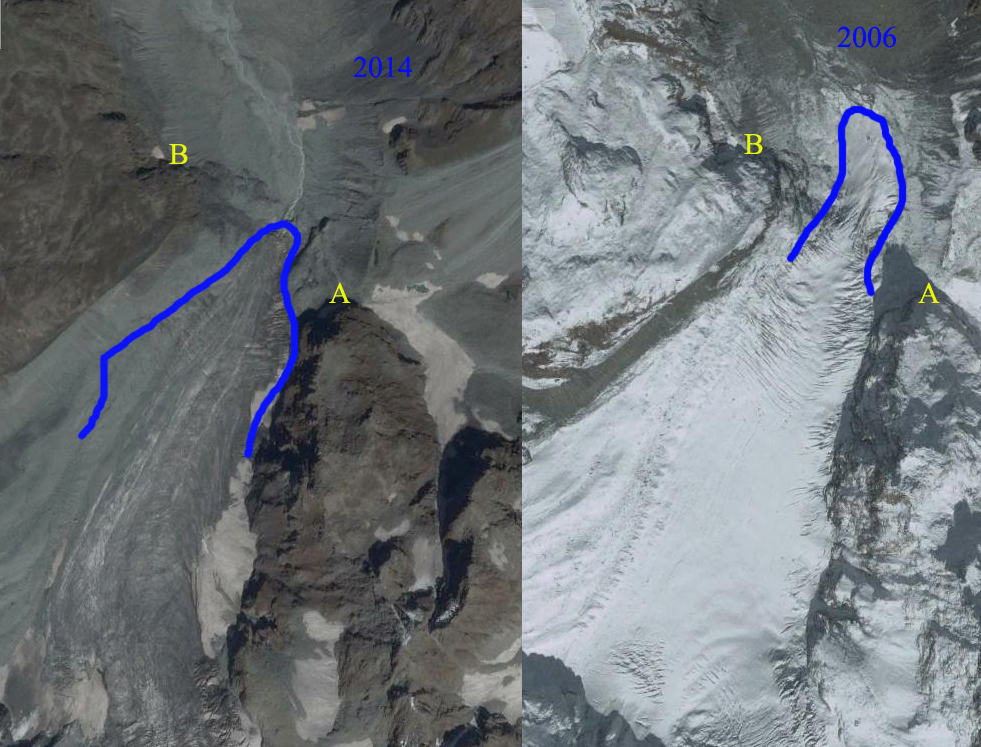
Digital Globe image of the terminus reach in 2000 and 2019. B marks the location of main river exiting from beneath the glacier. A marks the junction of the two glaciers. 1 and 6 indicate the two main glaciers that join 2 km above the Shafat Glacier terminus. Note debris cover spread particularly on main tongue.

Kolahoi Glacier Retreat and Lidder Watershed Changes, Kashmir

Kolahoi Glaciers (G1 and G2)  in 1993 and 2019 Landsat images.  Red arrow indicates 1993 terminus location and yellow arrow the 2019 terminus location.  The purple arrow indicates a debris covered area of a tributary to G1 that does not have active flow and will be disconnected. A new terminus is forming at yellow arrow left of purple arrow.  Purple dots is snowline.

The Kolahoi Glacier in Kashmir is known as the—”goddess of light”—Gwash Brari. The glacier descends the north side of the mountain with two tongues of the glacier merging above the terminus. The glacier drains into the Lidder River and then the Jhelum River system.  A publication out this week in Water from Irfan Rashid, Ulfat Majeed, Sheikh Aneaus at the University of  Kashmir and Mauri Pelto at Nichols College examined the retreat of the two largest glaciers on Mount Kolahoi, decline in Lidder River streamflow below the glaciers and changes in agricultural land use in the Lidder watershed.

Change in glacier extent of G1 and G2 from 1962-2019 a ~24% decline.

For the Kolahoi Massif climate warming has led to a cumulative deglaciation of ~24% from 1962-2018.  The terminus of  the two largest glaciers G1 and G2 retreated at a rate of 18.3 m/year and 16.4 m/year from 1962-2018 accelerating substantially after 2000. Our analysis identified an upward shift of ELA (end of summer snowline) by ~120 m that indicates an expanding ablation zone and mass loss from the glacier.  The 1993 snowline above is at 4300 m, in 2001 at 4450 m, in 2015 at 4450 m and in 2018 and 2019 at 4650 m, not all of the images are at the end of the melt season. The negative glacier mass balance  prevalent over the region will continue to drive the glacier recession and result in growing season glacier runoff declines. The Landsat images from 1993, 2001, 2015, and 2019 indicate retreat, snowline rise and that the east and west branches of G1 are about to separate.  G1 has been harder hit because less of the total glacier area has remained above the snowline in the accumulation zone than at G2. The higher snowlines have also driven less ice flow which reduces crevassing as the glacier thins and flow is reduced, note adjacent to  Point A between 2006 and 2014.

Terminus of G1 in 2006 and 2014 Digital Globe images, thickness is reduced near Point A and creveassing.

Kolahoi Glaciers (G1 and G2)  in 2001 and 2015 Landsat images.  Red arrow indicates 1993 terminus location and yellow arrow the 2019 terminus location.  The purple arrow indicates a debris covered area of a tributary to G1 that does not have active flow and will be disconnected.  Purple dots is snowline.

The streamflow measured at 5 sites in the Lidder watershed show statistically significant depleting trends that have been a factor in forcing extensive land system changes downstream. At Aru station 8 km below G1, 17 of the last 20 years have had streamflow below average  of 447 m3/sec.  At Gur 68 km downstream from G1 streamflow has been below average 18 of the last 20 years. Stream discharge is reduced here from Aru averaging 183 m3/sec, reflecting the impact of irrigation on reducing flow. Lidder River has  a 4.5 MW Pahalgam Mini Hydel Project, located  ~30 km downstream of G1 snout. The Jhelum River has several large operating hydropower stations and several more under construction including the Karot Hydropower Project a 720 MW run of river project.

Lidder River Annual Mean Streamflow at Aur 8km from glacier and Gur 68 km from glacier.

The area under agriculture in Lidder watershed shrunk by 39% during the same period.  There was a massive expansion of 176% in orchards extent and 476% in built-up areas respectively from 1980-2018. The conversion of irrigation intensive agriculture lands, mainly rice paddy to orchards is attributed to economic considerations and depleting streamflows reported in the region. In the bottom image you can see the appearance of orchards, individual trees evident at Point A-C along with more housing development such as at Point D.

Downstream land-use changes in Lidder watershed between 1980 and 2018.

Images of the same location in 2001 and 2019 in the Lidder Valley. Point A-C are locations that were rice paddies and are now orchards. PointD is an area of increased housing development.