
Quebrada Carhuascancha Glacier is in the Cordillera Blanca of Peru, draining the northeastern slopes of Huantsan. A glacier lake outburst flood was reported in the valley in 1965 from a landslide into one of the lakes. The region has experienced ongoing glacier loss with Racoviteanu et al (2008) noting a 22% loss in area from 1970-2003 in the Cordillera Blanca. They further observed an average rise of terminus elevation by 113m and an average rise in the median glacier elevation of glaciers of 66 m, with the greatest changes on the eastern side of the Cordillera. Vuille et al (2008) observed that the glacier in the Cordillera Blanca are not in balance with regional climate, and that tropical glaciers shrink in response to increased air temperature, which was the observed case in the Cordillera Blanca region. On three glaciers on nearby Nevado Queshque Marks and Seltzer (2005) observed volume loss and retreat due to warming. Examining temperature records from 29 stations in the Cordillera Blanca they found an average rising temperature trend ofof 0.26 1C per decade over the 1962-1999 period.
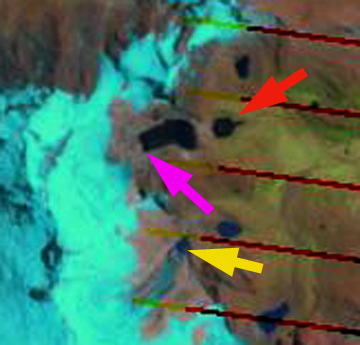
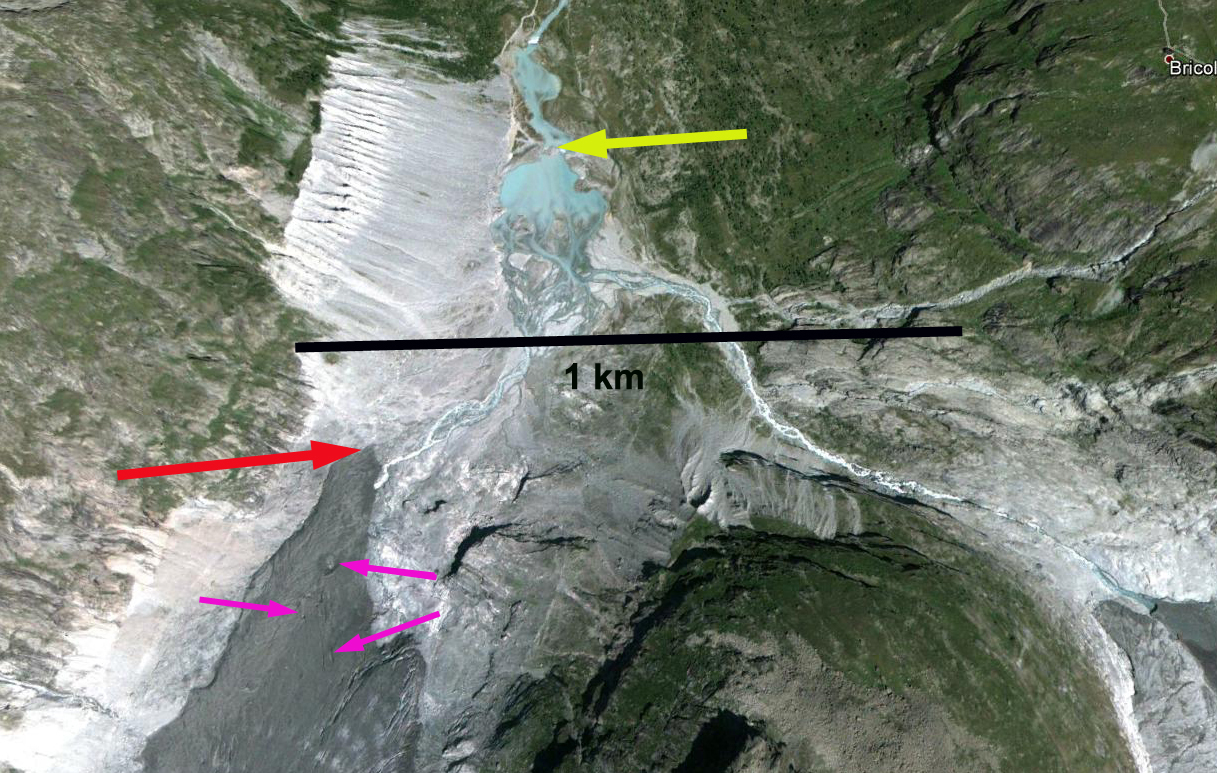
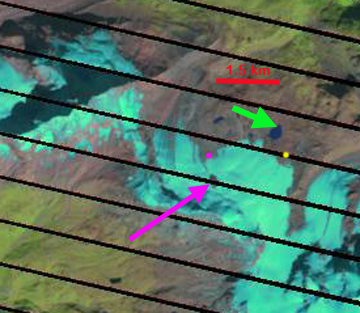
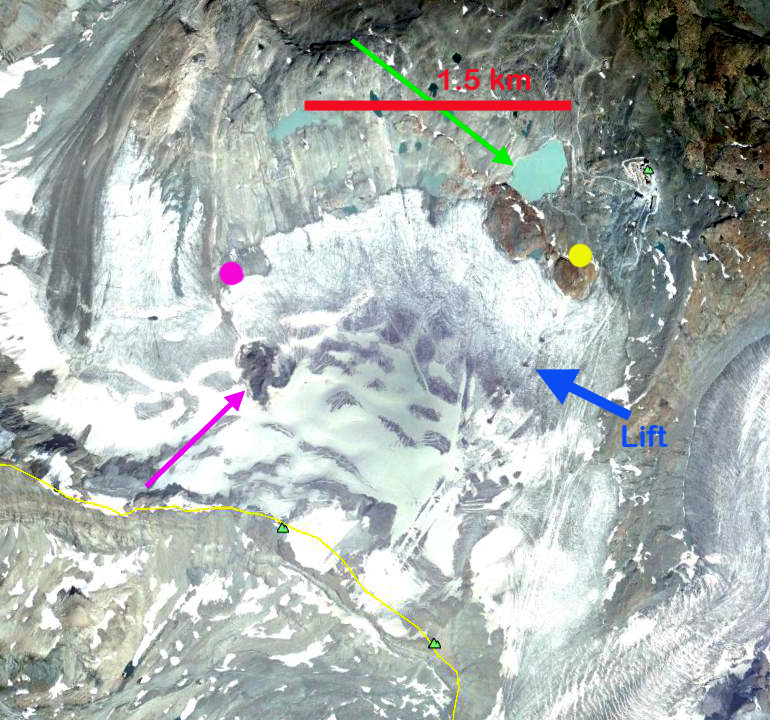
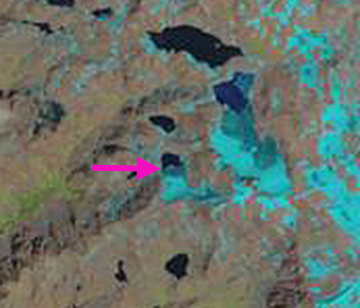
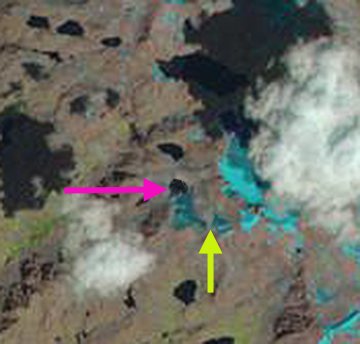
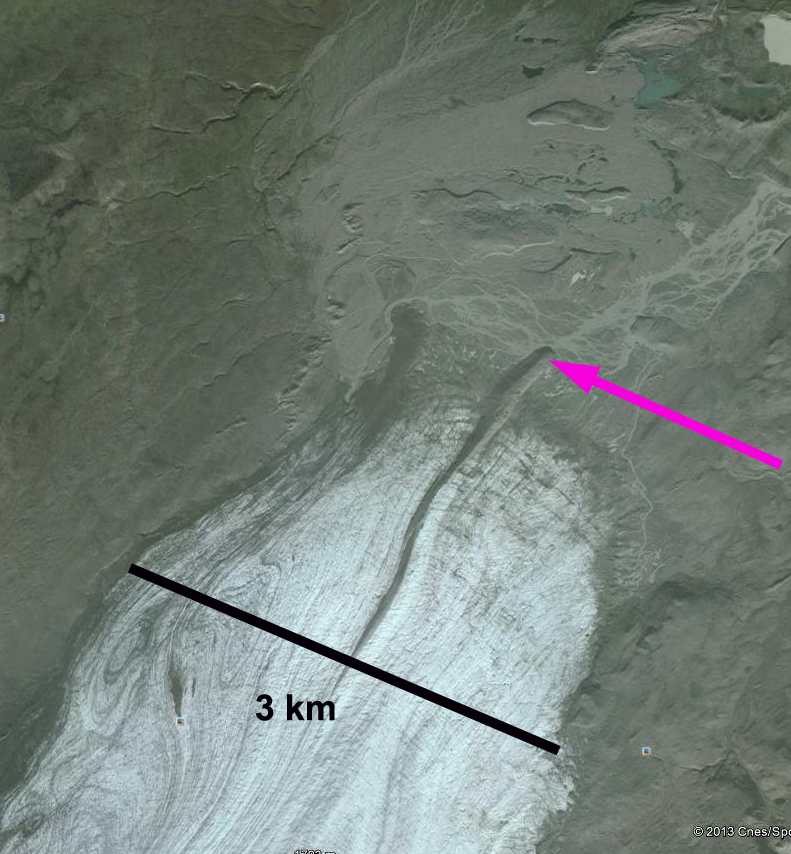
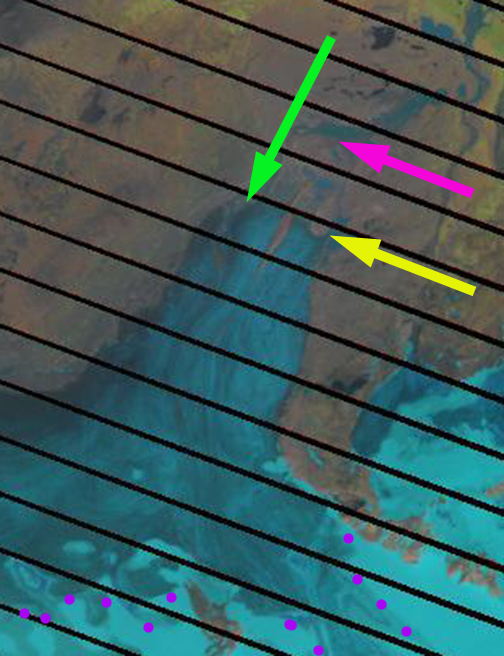
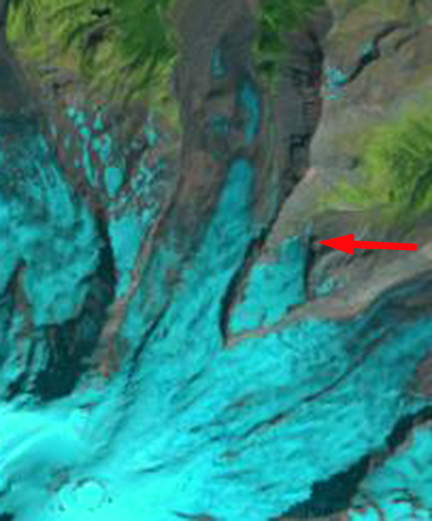
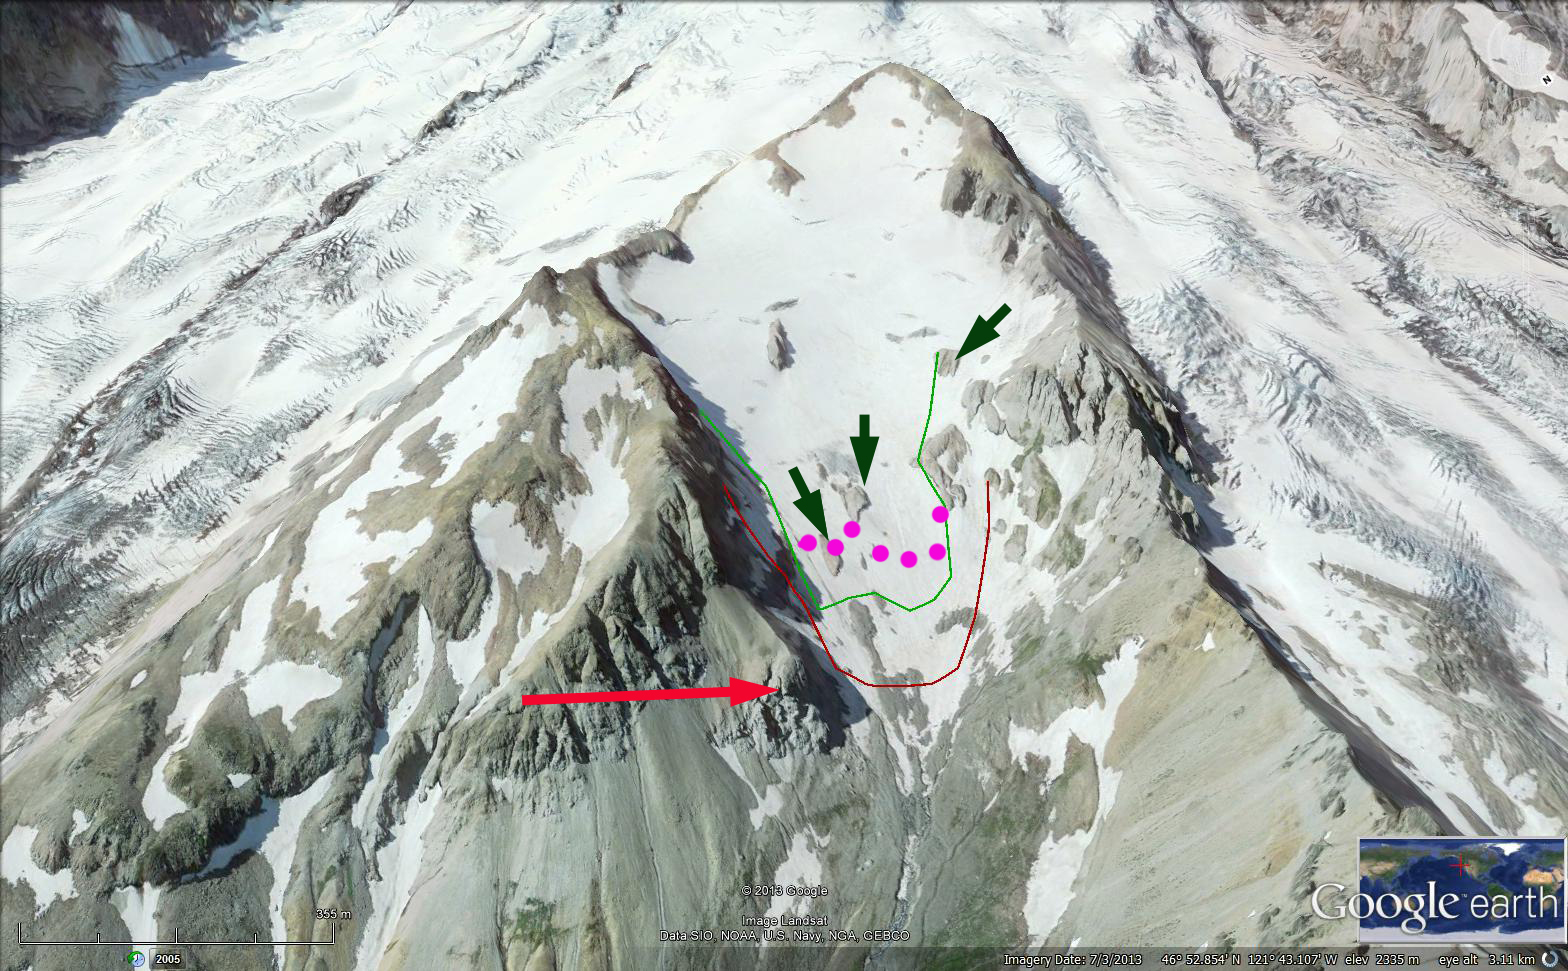
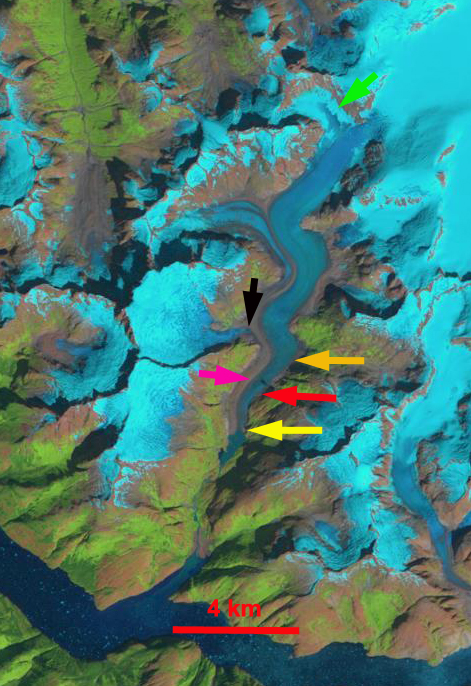
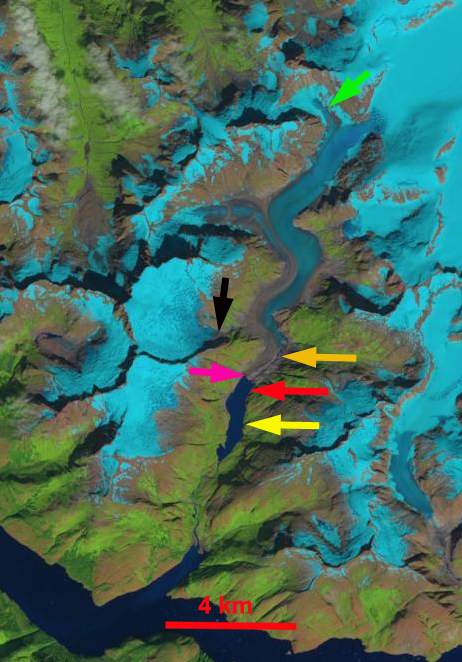
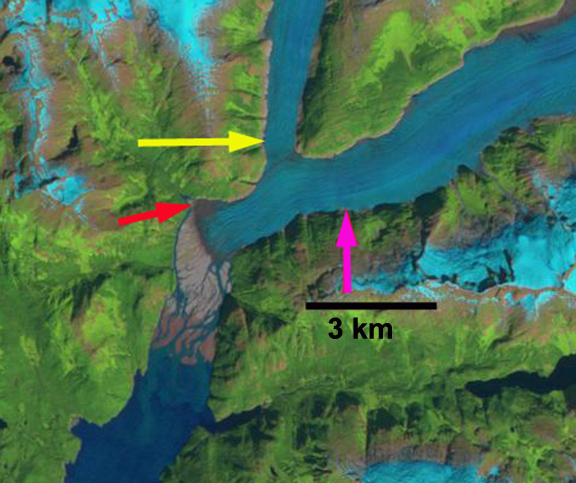
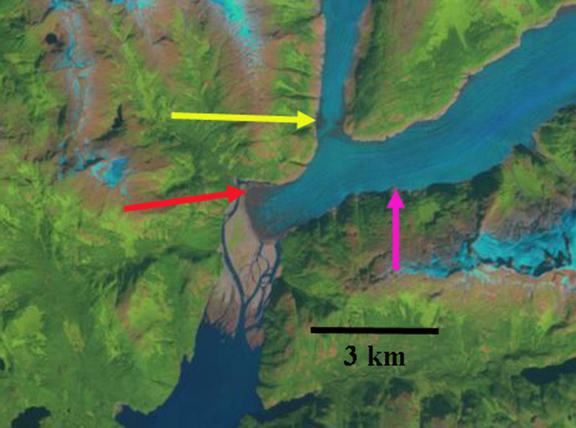
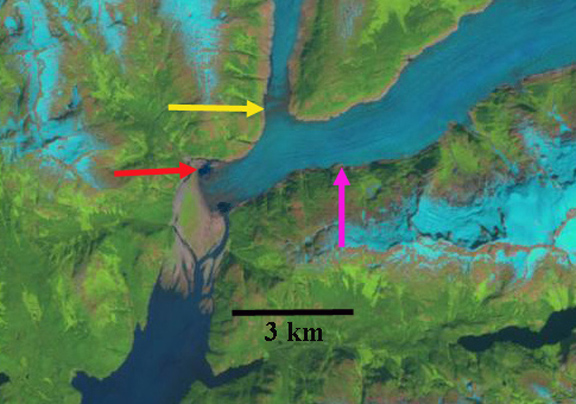
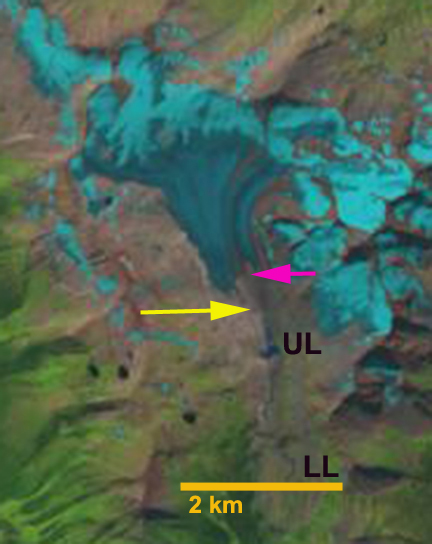
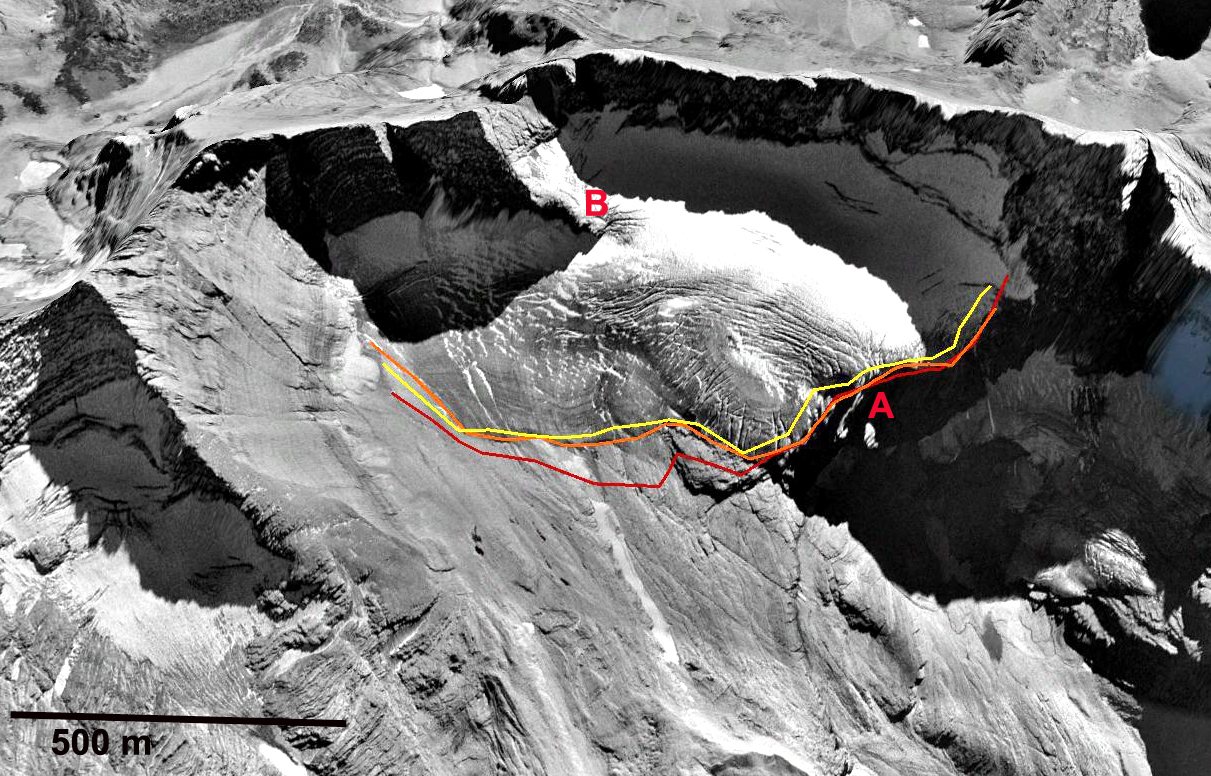
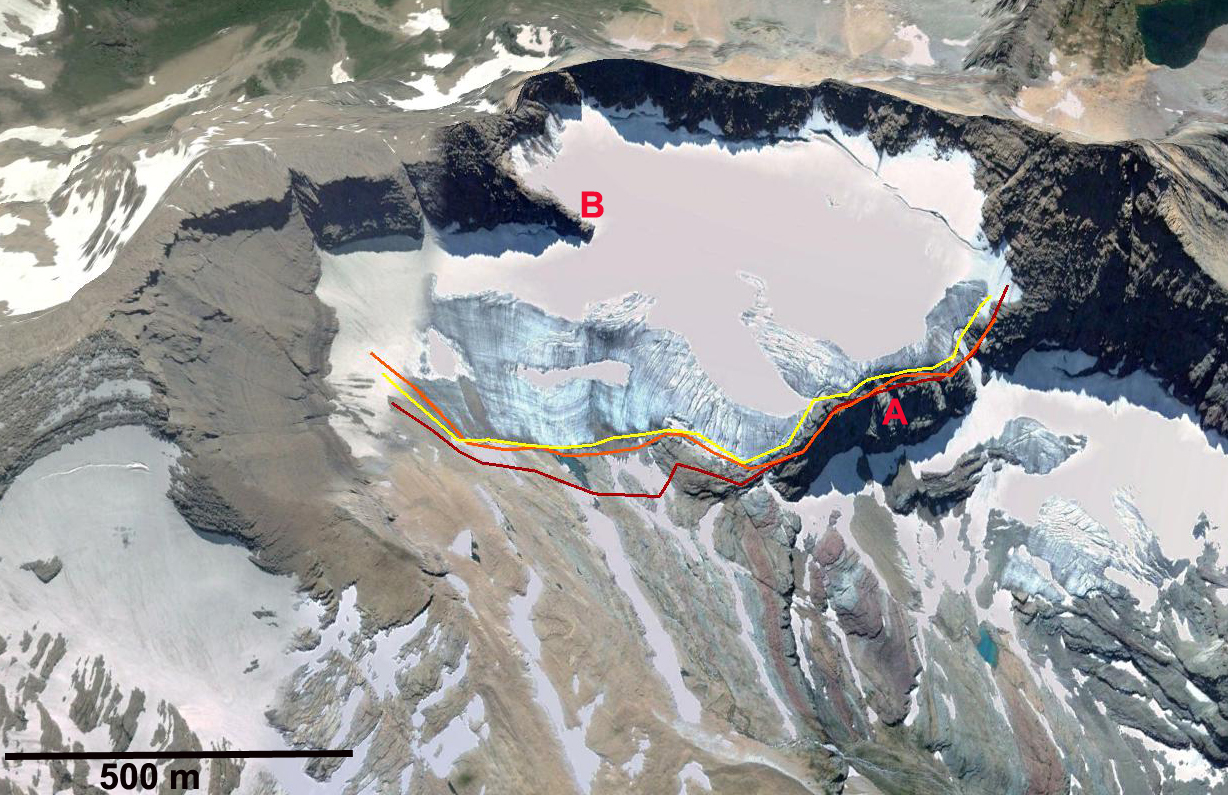
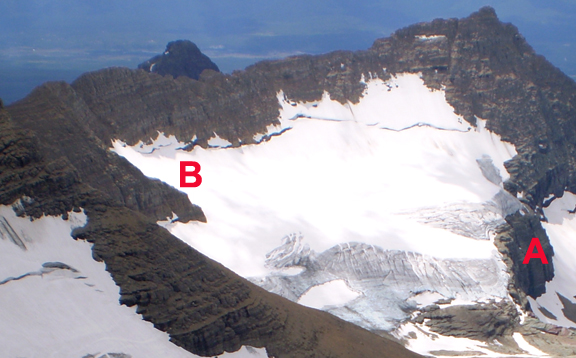
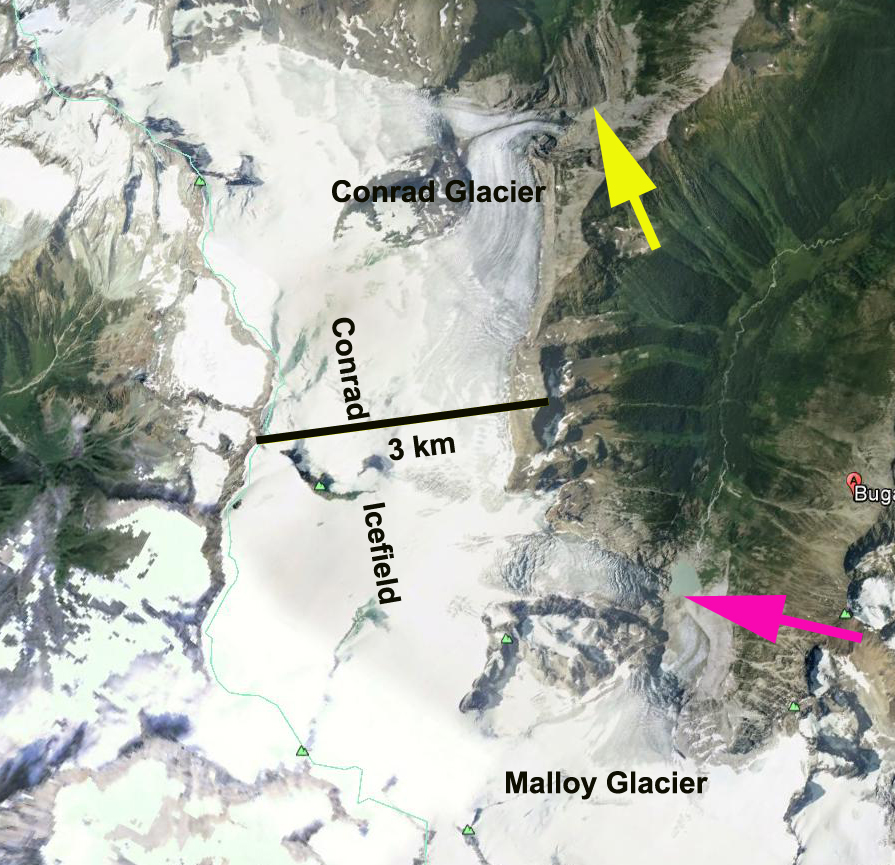
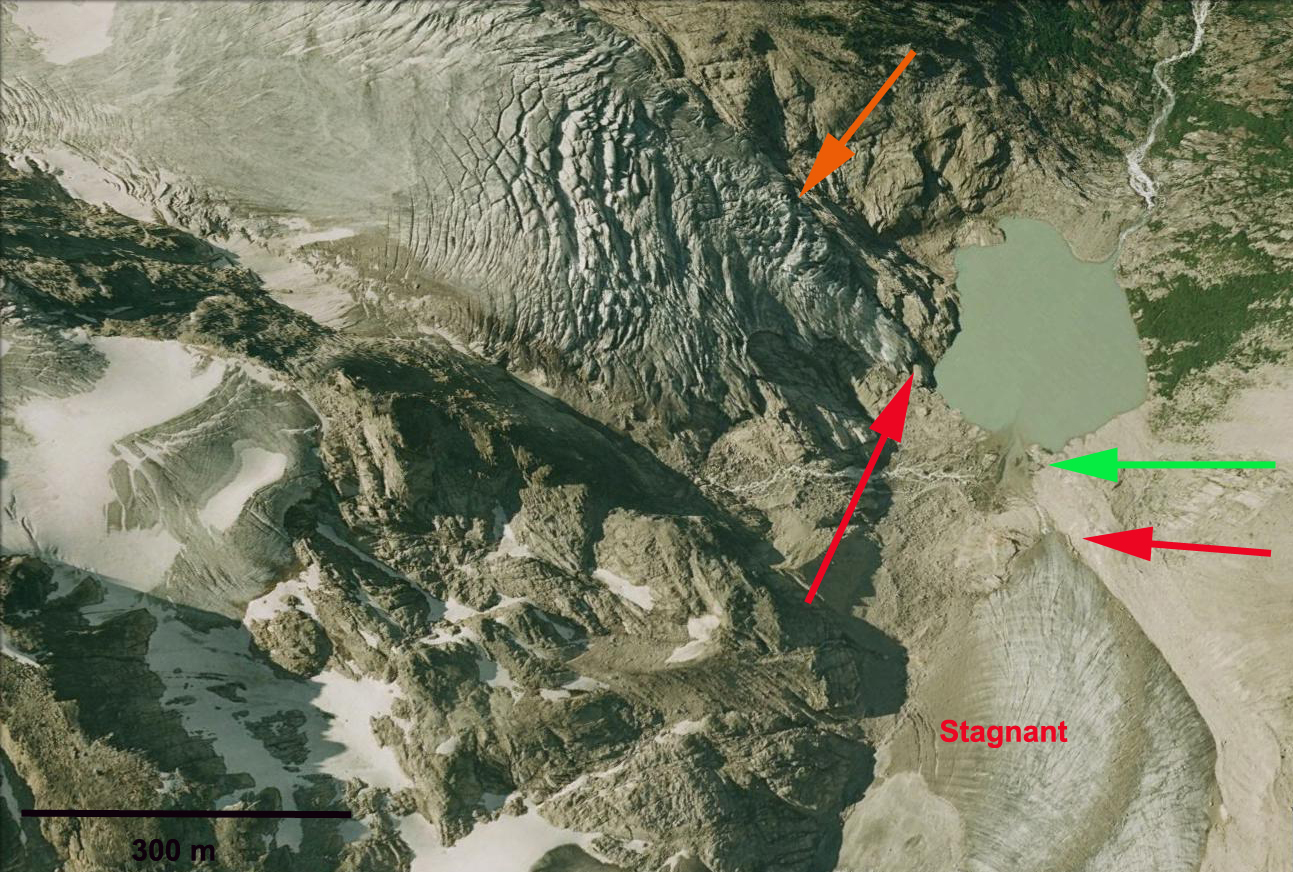
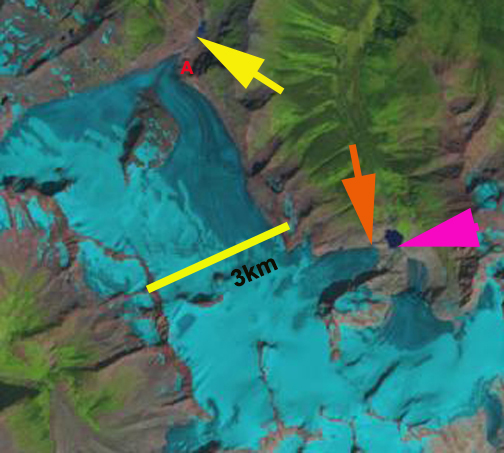
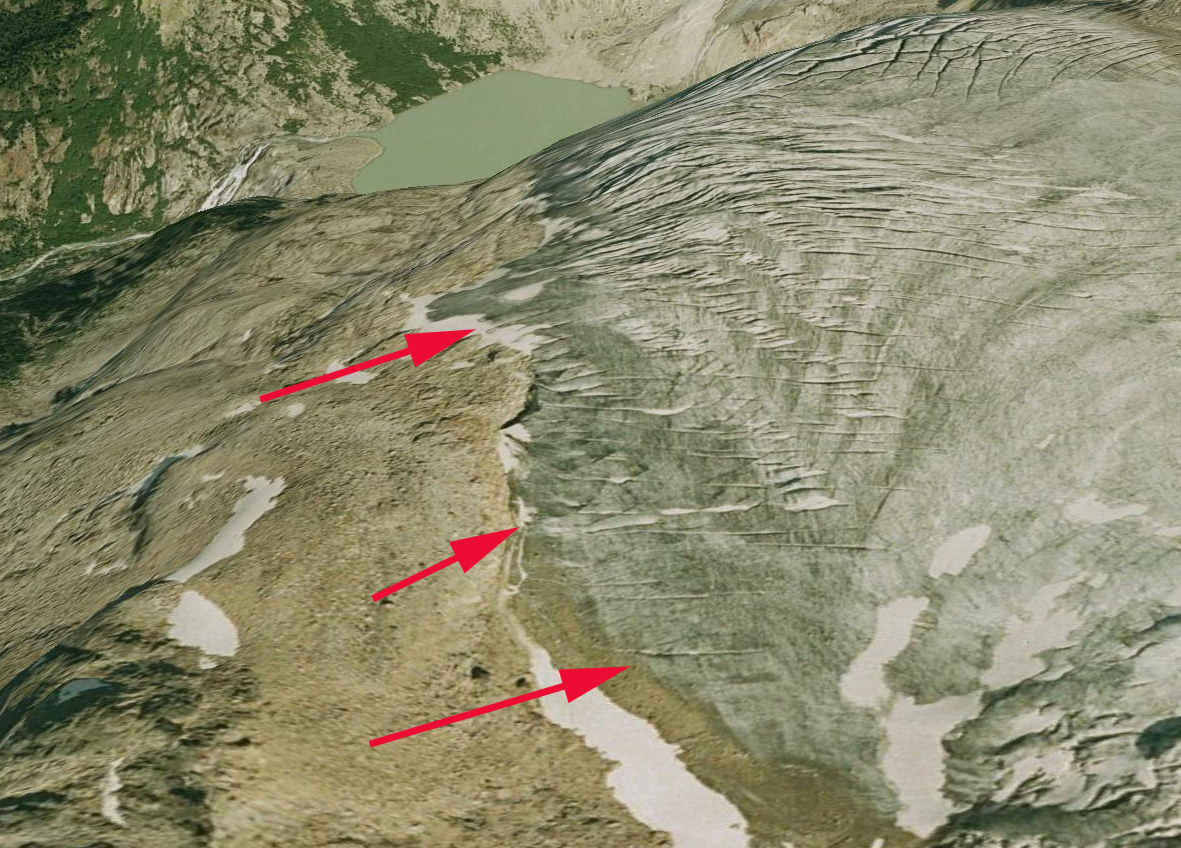
In this post the pink arrow notes the western margin of the lake that Carhuascancha reached in 1999 and 2000. The yellow arrow notes the terminus of the next glacier to the south of Carhuascancha, and the orange arrow a terminal-lateral moraine from the Little Ice Age. In 1999 and 2000 the glacier reaches just to the margin of the Laguna, and the southern glacier ends against a bedrock ridge. In both 2013 images Carhuascancha no longer reaches the lake terminating 250 m short of the lake and 200 m above the lake in elevation. The southern glacier terminates in a small lake that has formed. This small lake is also evident in the Google Earth imagery, which is an unknown date. Corihuasi Glacier and Chuecon Glacier in Cordillera Centrale, Yanashallasa Glacier and Artespnraju Glacier have all had a similar recent retreat. 
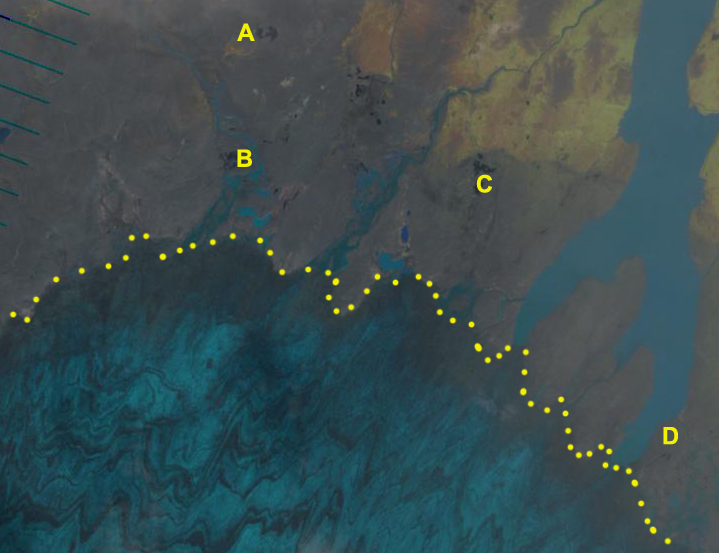
1999 Landsat image

2000 Landsat image
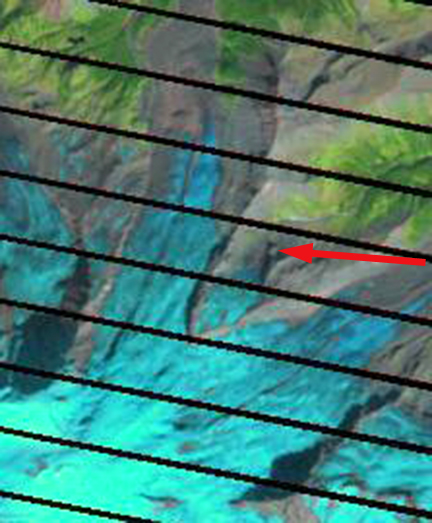
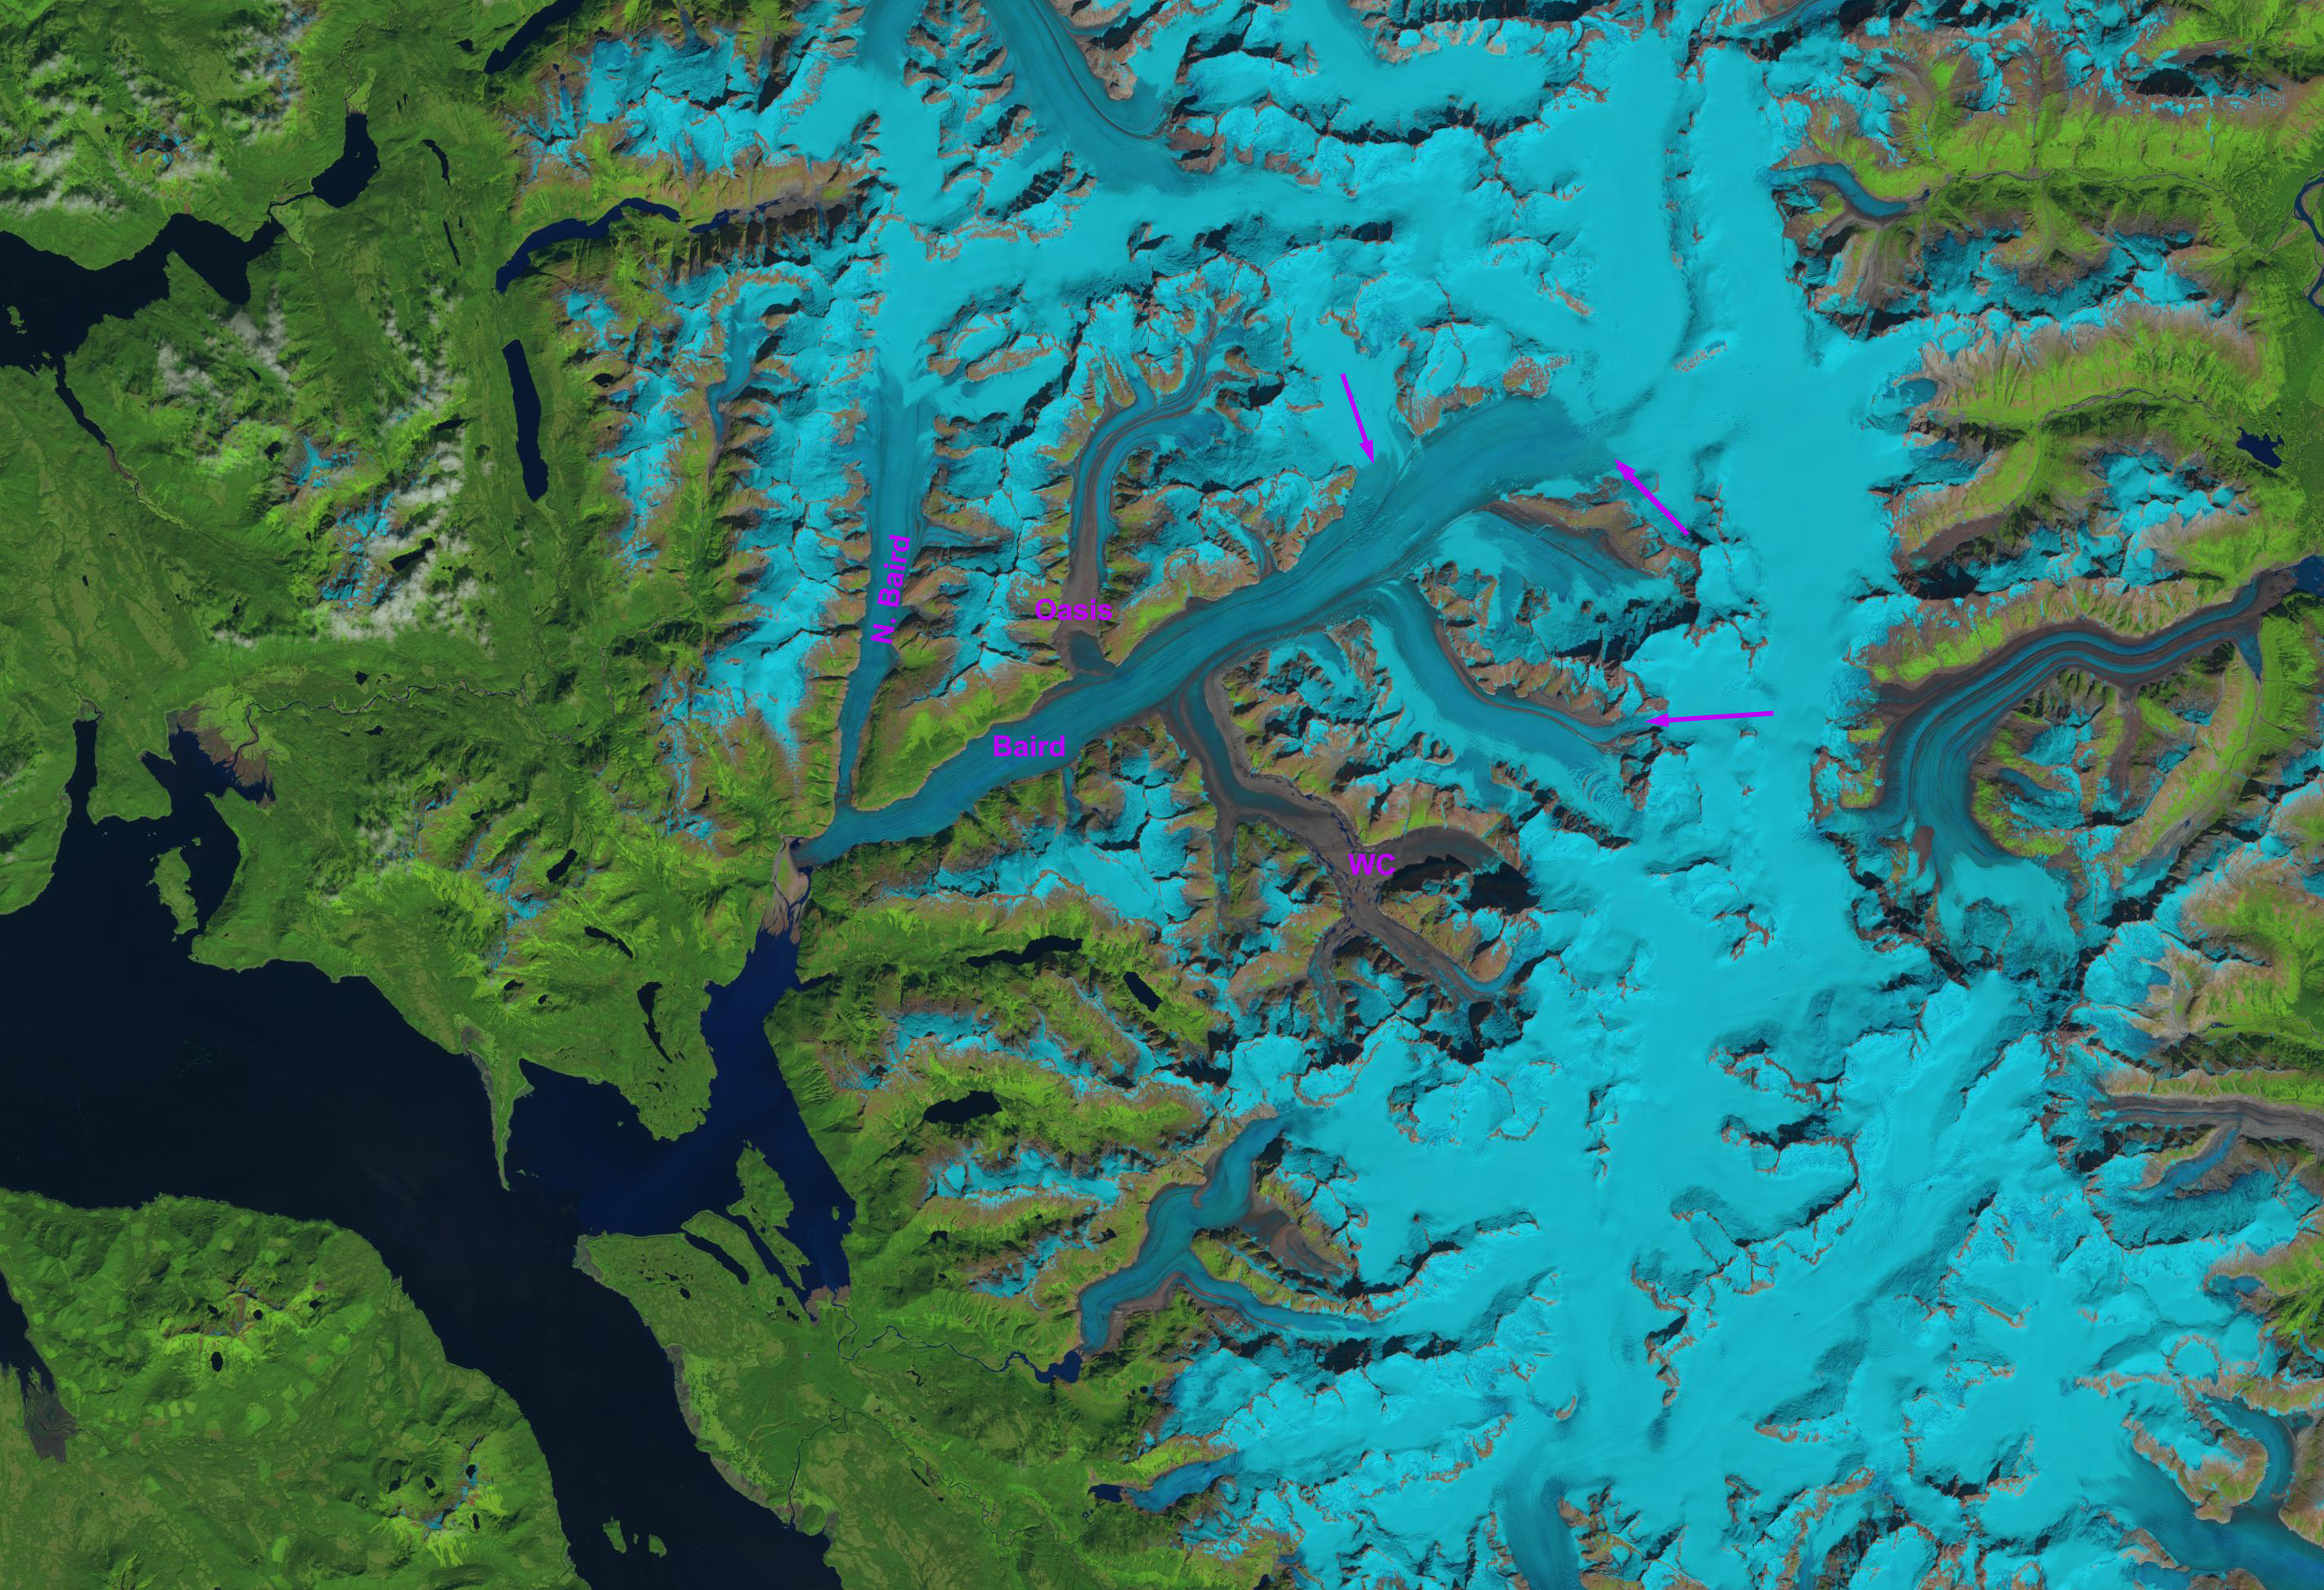
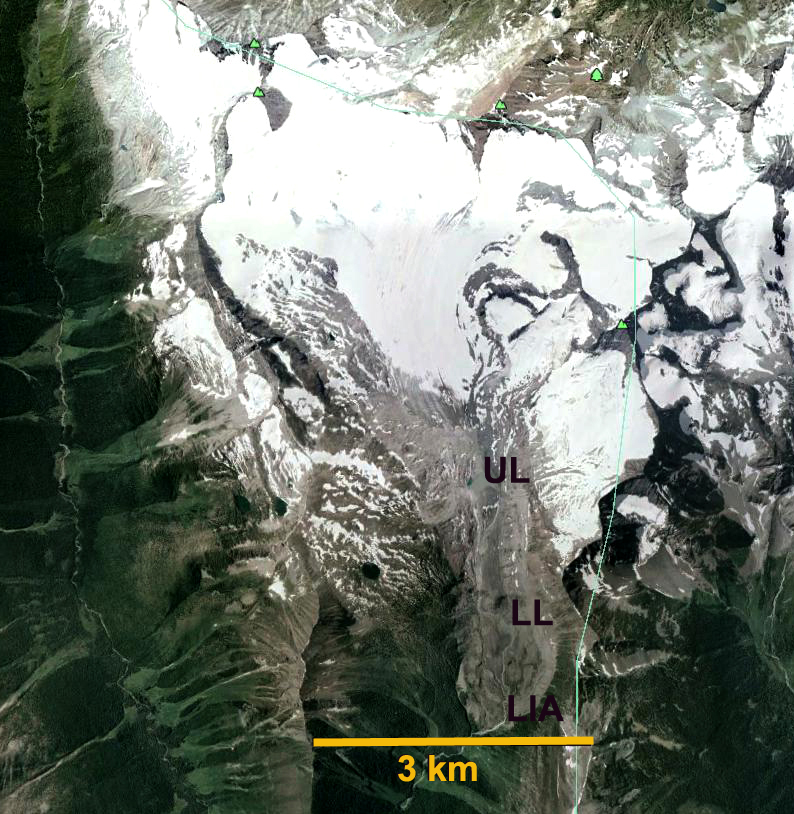
2013 Landsat image
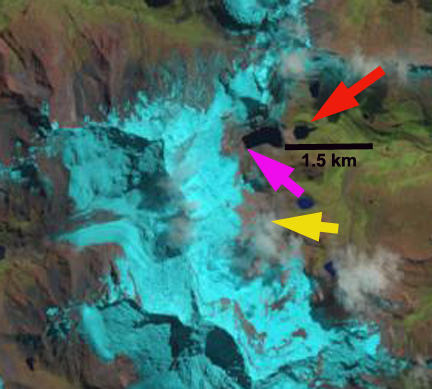
2013 Landsat image
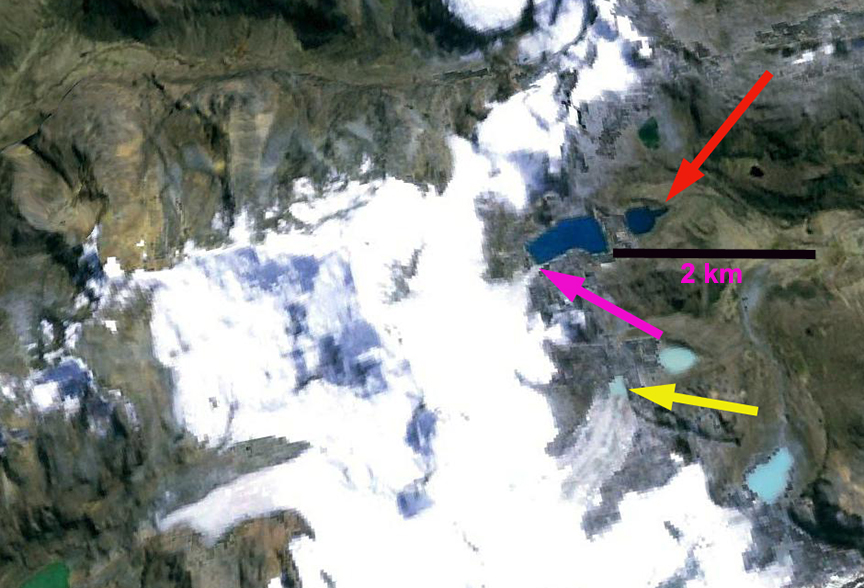
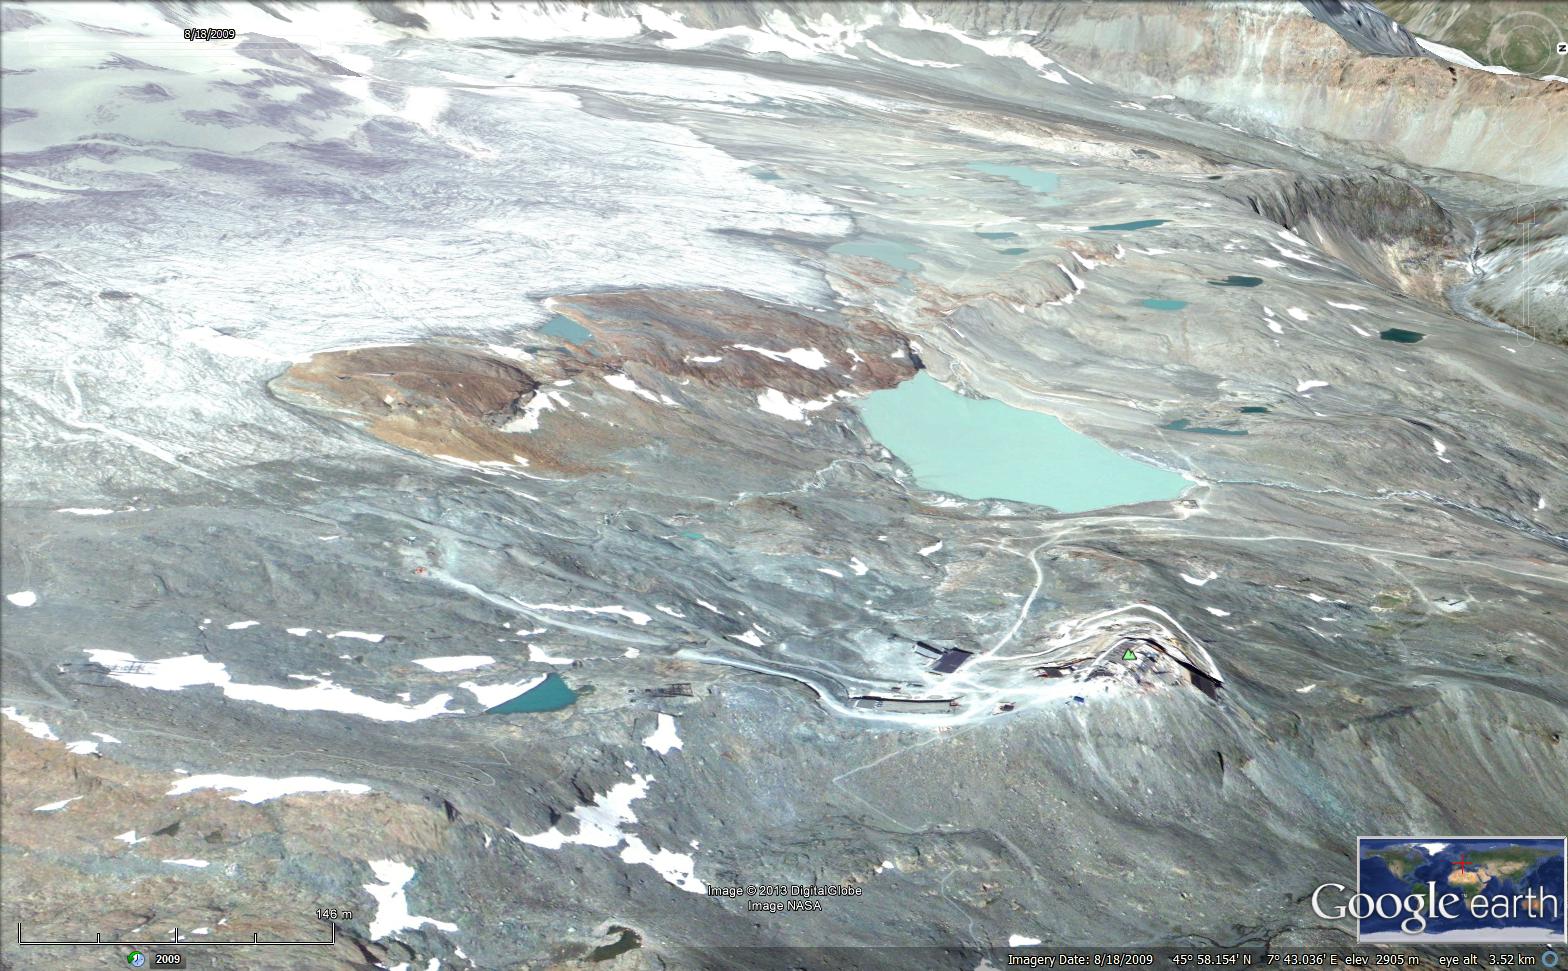
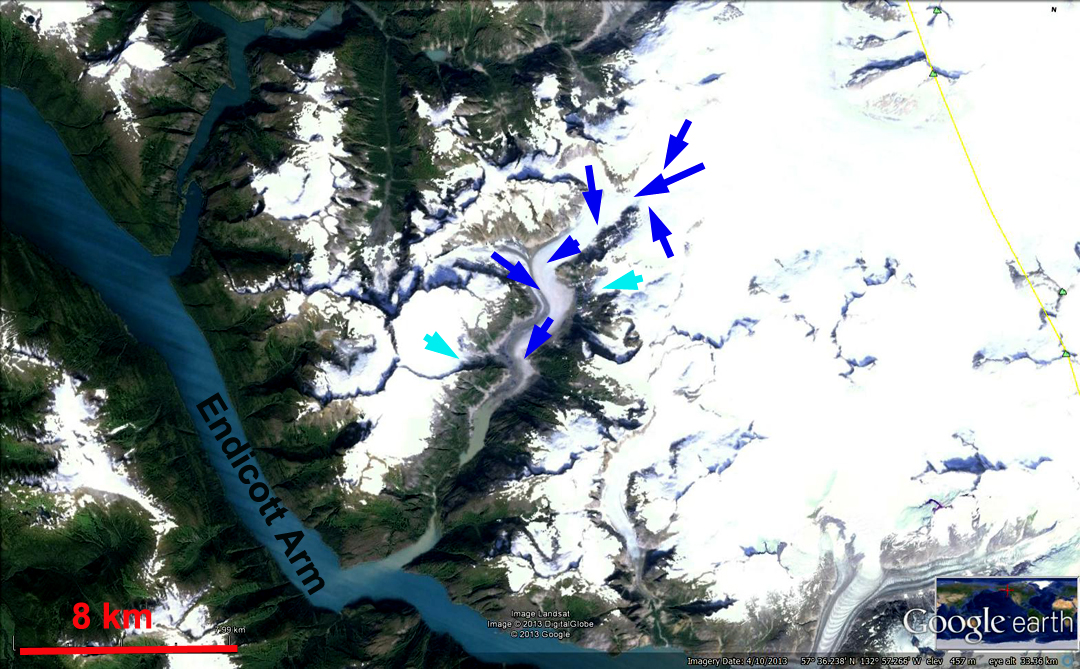
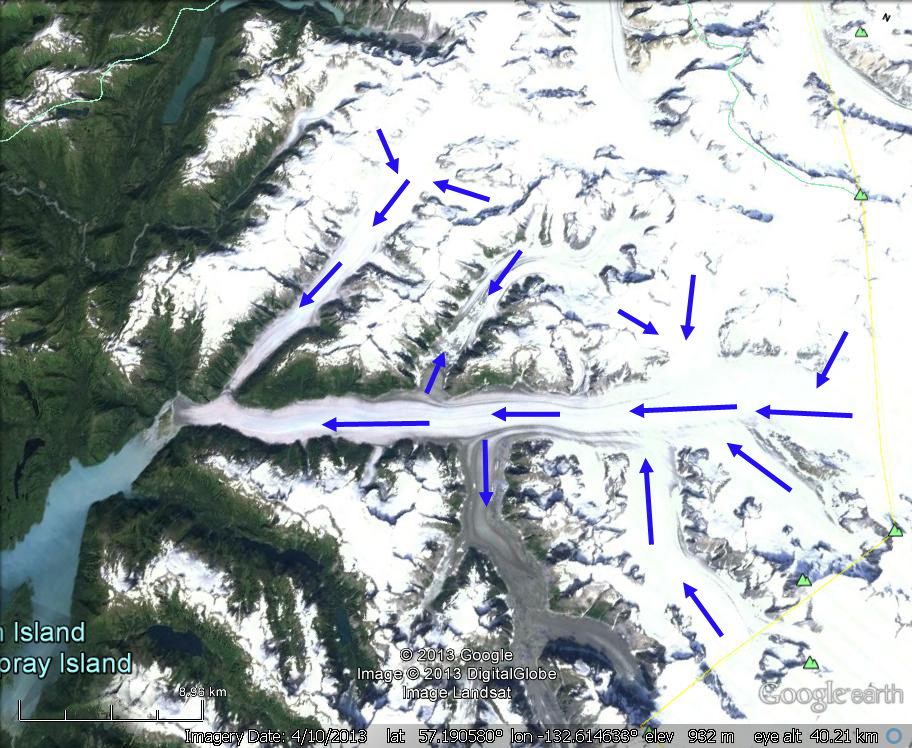
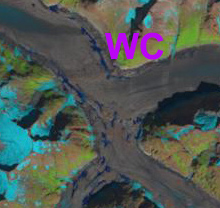
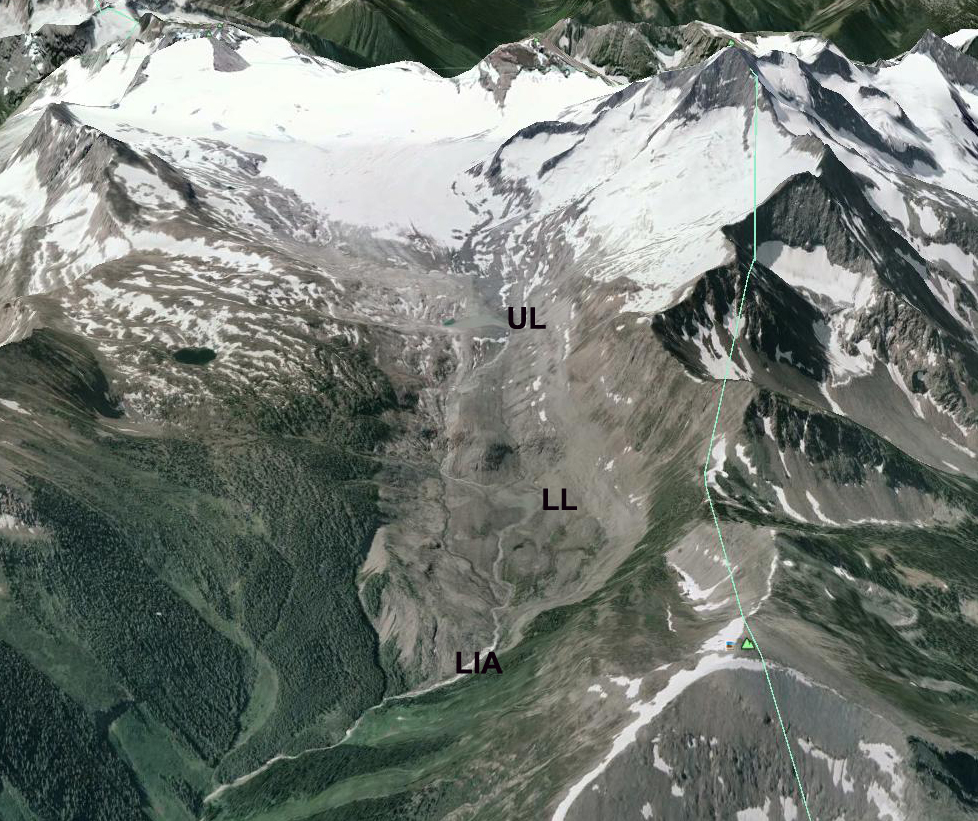
Google Earth image


