
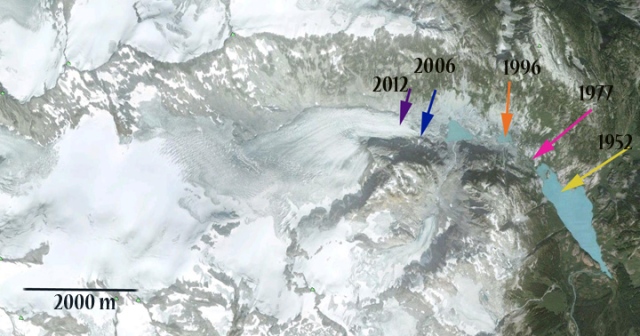
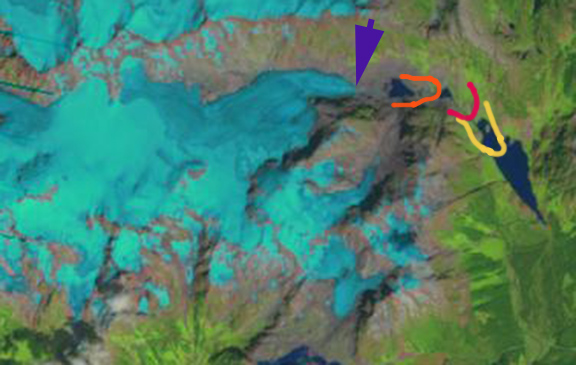
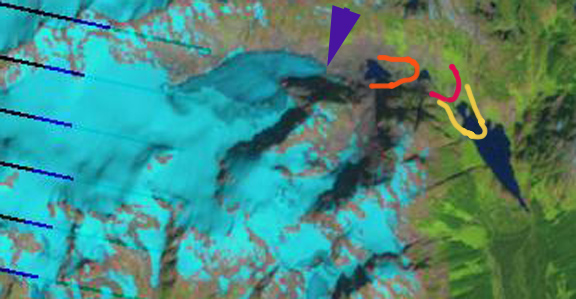
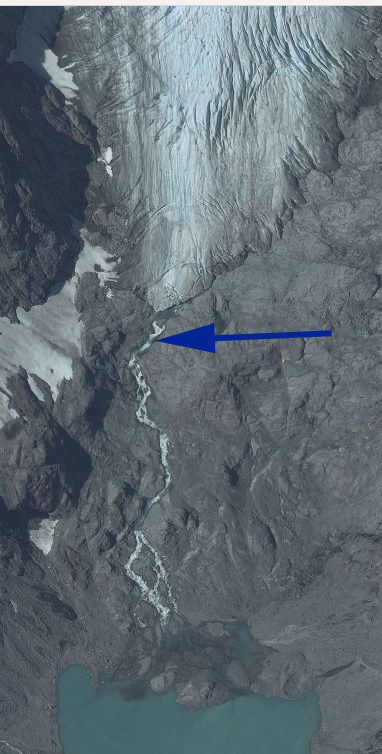
Stave Glacier is a six kilometer long valley glacier in Garibaldi Provinical Park, British Columbia. Koch et al (2009) in their detailed survey of glaciers in the park chronicled the glacier’s retreat from 1952 to 1996. Here we update the changes in Stave Glacier to 2012. Koch et al (2009) completed a map, first image that indicates the retreat rate of the glacier as 26 meters/year from 1900-1952, 33 meters/year 1952-1977 and 53 meters/year from 1977 to 1996. Examined below is Google Earth imagery from 2006, aerial photography from 2009 and Landsat imagery from 2009 and 2012. The Google Earth image indicates the terminus position using arrows in 1952 (yellow arrow), 1977 (pink arrow), 1996 (orange arrow), 2006 (blue arrow) and 2012 (purple arrow). In the Landsat images the same color scheme is used, for terminus front lines also. The retreat from 1996-2012 is 1600 meters, 100 meters/year. This glacier is still not approaching equilibrium as the accelerating retreat indicates. 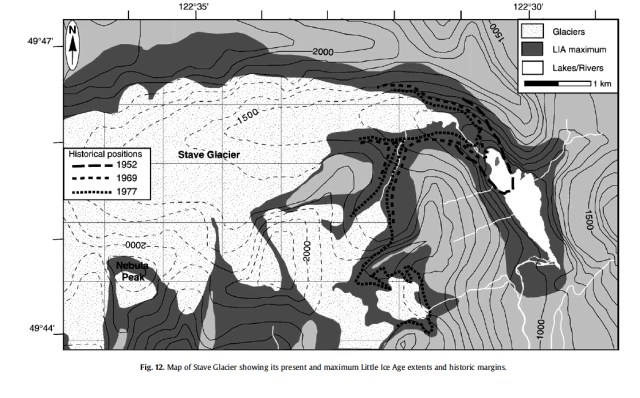
 A close up of the terminus in 2006 (top) and 2009 (bottom) indicates the lowest couple hundred meters is thin and uncrevassed indicating retreat will continue. The glacier terminus is at 1275 meters today. There is an active icefall above the terminus at 1500 meters, the snowline has been at 1900 meters. Unlike the nearby Helm Glacier, Stave Glacier has a persistent accumulation zone and can survive current climate. Its behavior is similar to that of Warren Glacier.
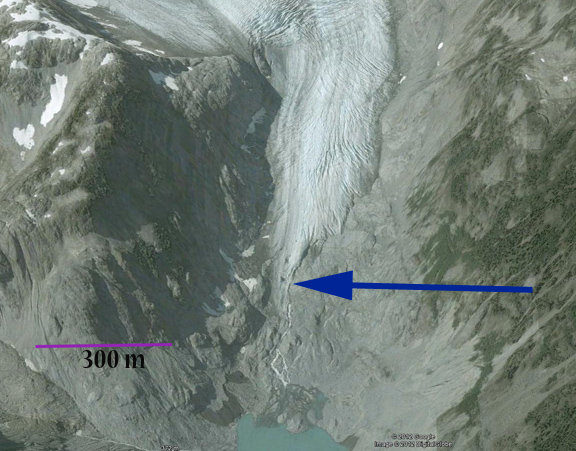
Qaleraliq Glacier Retreat, Southern Greenland
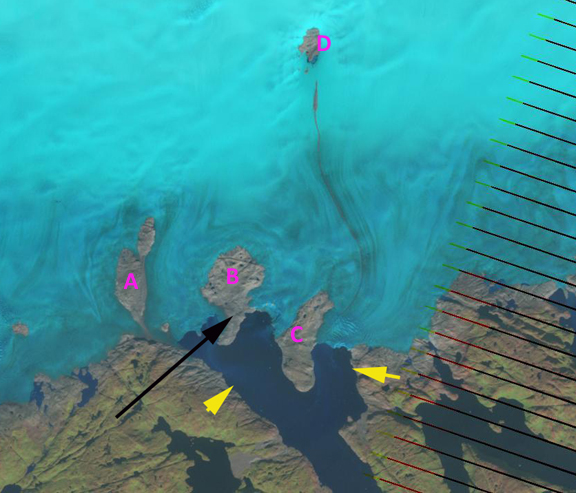
Qaleraliq Glacier is in southern Greenland and flows into the Tasermiut Fjord. Glaciers in this region have experienced substantial retreat since 1990 Weidick et al (2012) and Howat and Eddy (2011). Howat and Eddy (2011) state that, “We find that 90% of the observed glaciers retreated between 2000 and 2010, with rapid retreat observed in all sectors of the ice sheet. The current retreat is accelerating and likely began between 1992 and 2000, coincident with the onset of warming, following glacier stability and minor advance during a mid-century cooling period.” In this case we are examining a tidewater glacier in Southern Greenland using satellite imagery from 1992, 2004, 2010 and 2012. In each image locations A-D are in the same locations marking specific bedrock islands (nunataks) within the ice sheet. The yellows arrows indicate the 1992 terminus position in each image, the black arrow denotes the terrain south of bedrock nunatak B. Retreat of the west arm of the glacier has been 3.2 km from 1992 to 2012. The east arm retreat in the last twenty years has been 1.2 km. In 1992 Nunatak A is 1.5 km from the ice edge and is composed of two separate nunataks. By 2010 the two nunataks have merged and by 2012 Nunatak A is 1 kilometer from the ice edge. In 1992 Nunatak B is 3 km from the icefront surrounded by the ice sheet and in 2012 the nunatak has increased in size and extends 1 km beyond the terminus. Nunatak C has largely emerged from the ice sheet, the nunatak has also expanded in length by 500 meters as ice has thinned during the retreat. The Nunatak at D did not exist in 1992, but by 2012 it is over 1 km long.
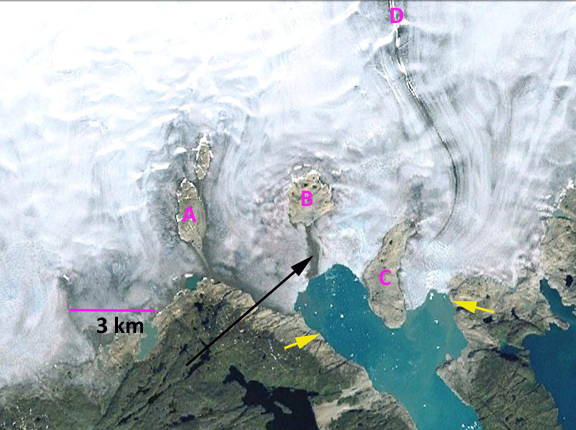

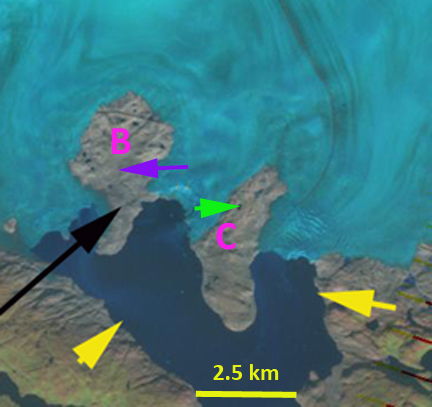
A close up view of the terminus and Nunatak B and C from 1992 and 2012 illustrates the expansion of the nunataks as ice has thinned. The locations at the green and purple arrows are the same in both images. In 1992 these locations are near the nunatak margin and by 2012 the locations are in the midst of the Nunatak. Qaleraliq Glacier behavior is similar to that of almost all southern Greenland glaciers, most of which like Qaleraliq have not been the focus of detailed study, such as Kuussuup Sermia, Narssap Sermia or Kangiata Sermia. In the Tasermiut Fjord Biggs (2011) noted the retreat of two glaciers Sermitsiaq and Itillersuaq that have each retreated 600 and 300 m respectively from 1987 to 2009. The unusual nature of the 2012 melt season can be seen in this animated graph of ice sheet melt extent with data from Marco Tedesco, Figure 2a in the recent paper submitted (Tedesco et al, 2012).
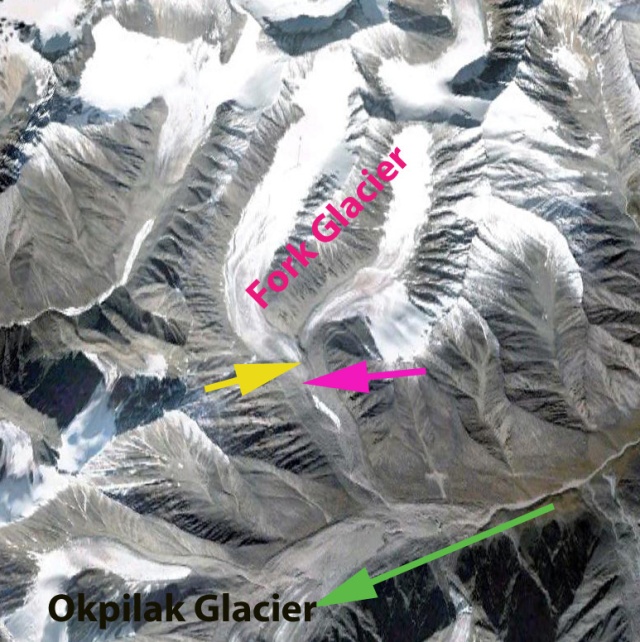
Fork Glacier Retreat and Separation, Brooks Range, Alaska
The Romanzof Mountains in the Brooks Range of Alaska has numerous small alpine glaciers. This is an area that has seen some of the greatest warming of anywhere over the last 30 years. In this post we focus on Fork Glacier which is just northwest of Okpilak Glacier. The glaciers in this region have been undergoing significant thinning and mass loss (Delcourt et al, 2008) including on McCall Glacier, Okpilak Glacier and Romanzof Glacier. Here we examine the changes in Fork Glacier, that has an 2.5 km long east and 3.5 km long west arm that joined at 1800 meters. The glacier than descends 600 meters to a terminus at 1700 m in 1982, the western arm is longer, wider and begins higher at 2300 meters. The first image is a 1982 aerial photograph from the USGS, followed by a 2000 Landsat image, 2009 Google Earth and 2012 Landsat image. The Pink A indicates where the two arms of the glacier joined, the pink arrows indicate the 1982 terminus and the yellow arrow the 2009 terminus. The glacier remained joined in 2000, but for a shorter distance than in 1982. By 2009 the glacier had retreated 400 meters from 1982 and has separated at the terminus. By 2012 the eastern terminus has separated by 200 m from the west branch, green arrow. The other problem evident in the 2012 satellite imagery is the limited extent of snowpack on the glacier at the purple arrows. This level of snowpack even with a month left in the accumulation season indicates a glacier without a consistent accumulation zone that cannot survive (Pelto, 2010) 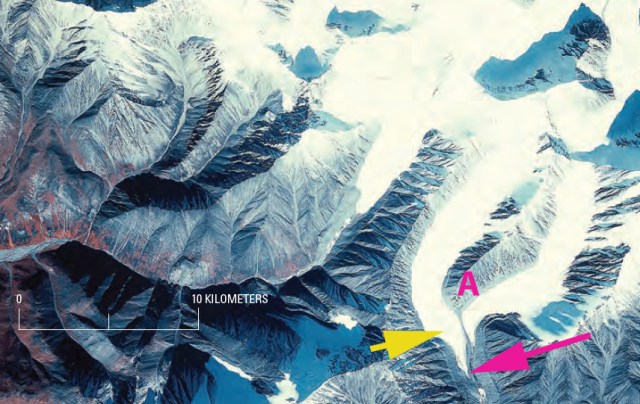
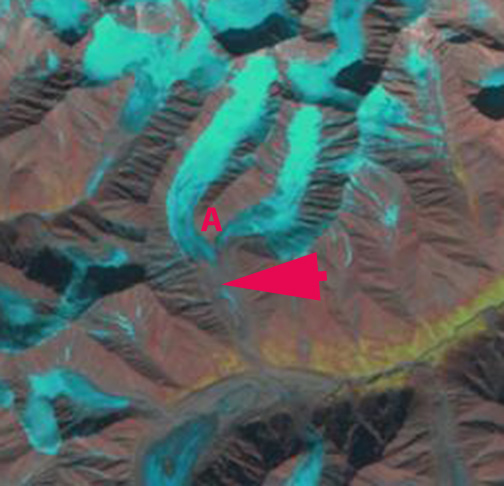
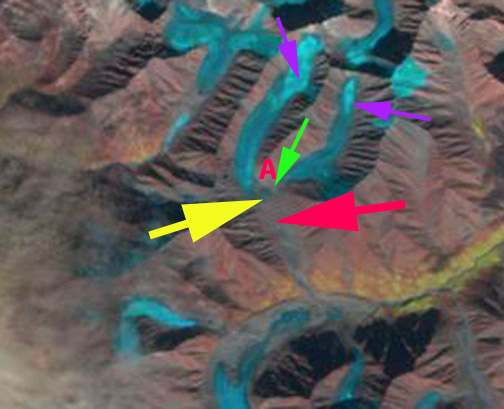 A close up view of the terminus from the 2009 Google Earth imagery indicates the retreat but also the green arrow highlights a supraglacial stream that indicates stagnant ice on the eastern arm of the glacier.
Jones Ice Shelf Loss, Antarctica
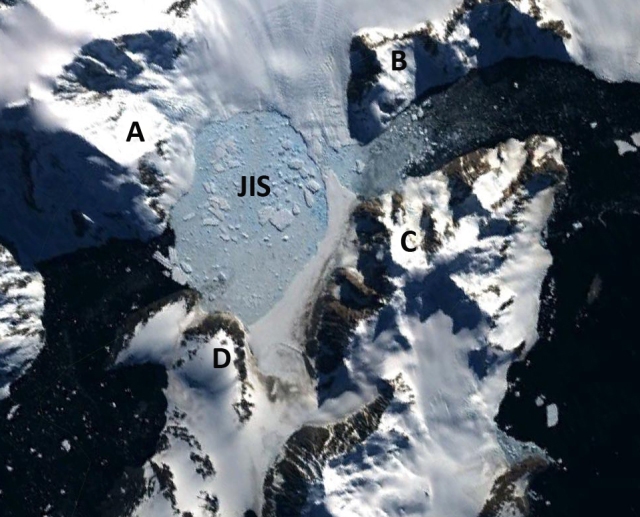
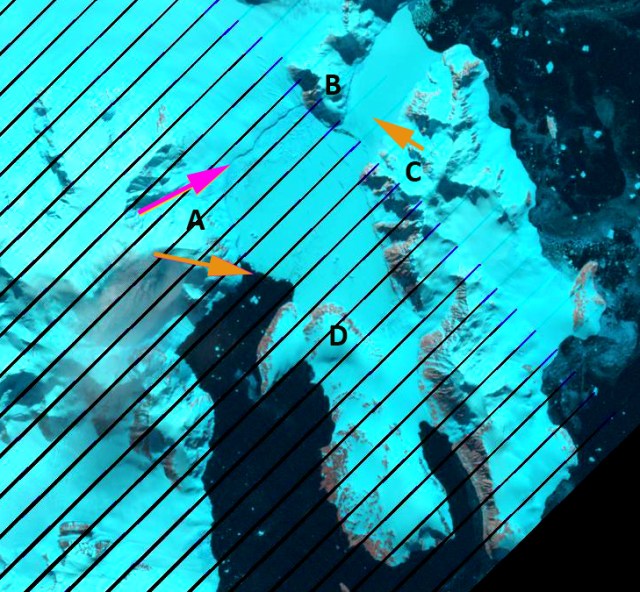
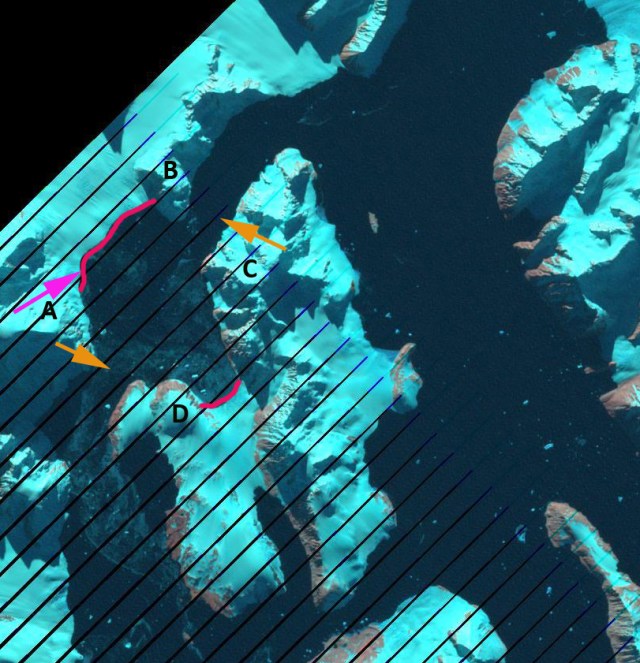
The Jones Ice Shelf was midway up the west coast of the Antarctic Peninsula. The ice shelf (red arrow) was smaller than other ice shelves that have mostly or substantially disintegrated Wordie Ice Shelf (orange arrow), Larsen B Ice Shelf (pink arrow) or Wilkins Ice Shelf (green arrow). 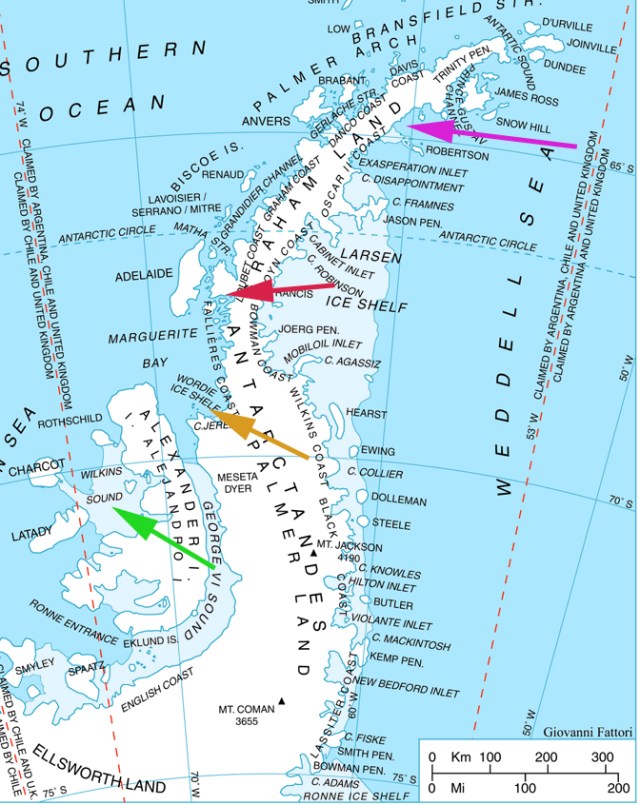 The British Antarctic Survey (BAS), has been observing the changes in ice shelves around the Peninsula Cook and Vaughan, (2010) and Fox and Vaughan (2005). The BAS noted that the ice shelf had an area of 29 square kilometers in 1980, by 1990 21 square kilometers and 10 square kilometers in 2000 and 2003, gone. Blaicklock Island (C and D) and the Arrowsmith Peninsula (A and B) are now separated by open water in Jones Channel. Cook and Vaughan (2010) also note that this was not the result of a long ongoing retreat, the Jones Ice Shelf expanded 20 % between 1947 and 1978. In the post below there is a sequence of images from Landsat and Google Earth imagery in a sequence as follows, 1989, 1991, 1999, 2009 and 2011. The Ice shelf exists in 1989 and 1991, ending at the orange arrows, which are included in the 2009 and 2011 images as well for comparison. Points A-D are in the same location in each image. The 1999 image indicates a disintegrating Jones Ice Shelf (JIS), with a small ice tongue protruding part way across Jones Sound, the new waterway that has opened. By 2009 the glacier has retreated out of the Jones Channel to the pink arrow and red line in 2011. The eastern terminus retreated 4 km and the western terminus 7 km. The ice shelf loss here is similar in magnitude to Rohss Bay on James Ross Island.
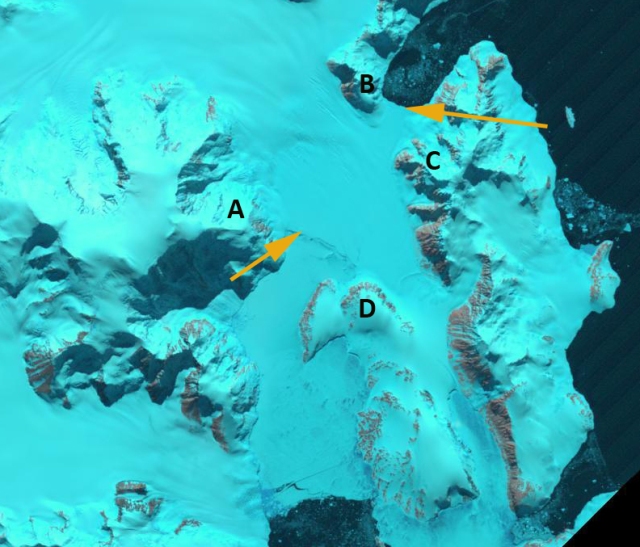

Dusty Glacier, Glacier Peak, WA
In the 1990’s the North Cascade Glacier Climate Project undertook a study of all the glaciers around Glacier Peak, one century after they had been first observed by C.E. Rusk. This post focuses on one of those glaciers, Dusty Glacier on the Northeast side of the peak.
In 1940 J.B. Richardson of the Forest Service photographed many North Cascade glaciers surrounding Glacier Peak. From 1946-1958 William Long, of the Forest Service surveyed many glaciers throughout the North Cascades (Long, 1955). From 1950-1955 Richard Hubley, University of Washington, completed the first aerial glacier surveys of North Cascade termini, noting the beginning of an advance on many (Hubley, 1956). The USGS in 1960 began an annual aerial photographic survey of North Cascade glaciers that continued up through 1979. In 1984 the North Cascade Glacier Climate Project began annual terminus observations on 47 glaciers and mass balance measurements on ten of these (Pelto, 1996). The average retreat of Glacier Peak glaciers from the LIA to the 1958 positions was 1640 m. Richard Hubley noted that on Glacier Peak glaciers began to advance in the early 1950s, after 30 years of rapid retreat. The advance was in response to a sharp rise in winter precipitation and a decline in summer temperature beginning in 1944 (Hubley, 1956; Long, 1955 and 1956). Ten of the fifteen glaciers around Glacier Peak advanced, including all of the glaciers directly on the mountains slopes. Advances of Glacier Peak glaciers ranged from 15 to 480 m and culminated in 1978. All 11 Glacier Peak glaciers that advanced during the 1950-1979 period emplaced identifiable maximum advance terminal moraines. By 1984, all the Glacier Peak glaciers were again retreating. This retreat has been monitored by NCGCP. Two of the glaciers including Milk Lake Glacier and North Branch Whitechuck Glacier have disappeared.
The depth of snowpack even in Mid-August near the top of the Dusty Glacier is what drives the rapid movement and crevassing of the glacier. In the first image below the red arrow indicates the annual layer, which was 5.7 m thick in 1997. Thew second image has me standing at the terminus in 1994, which was still active even though it was retreating. 

Dusty Glacier has the widest most fearsome crevasses of any glacier in the North Cascades. The glacier descends from 2750 m to 2560 m before plunging over an icefall. The glacier levels out in a basin at 2325 m, before descending a second icefall to its current terminus at 1960 m. Dusty Glacier joined with the North Guardian Glacier during the LIA, separating during the 1930’s. During the LIA the glacier advanced to 1465 m. The retreat of this glacier by 1906 when Rusk observed it had been only 400 m. The glacier ended in a basin that was filled with ice, though much of the ice was stagnant. This basin became known as Recession Basin, for the ensuing rapid retreat up until 1946 when the glacier had retreated out of the basin and ended just north of Recession Rock (R) at 2020 m. By 1955 advance was underway, an advance of 130 m had already occurred (Hubley, 1956). The advance ceased until 1967 when it began again, the glacier reaching another 150 m down into the upper part of Recession Basin at 1865 m. The terminus today is very active with extensive crevassing. In fact it is a true icefall. The glacier retreated 220 meters from its 1970’s advance moraine by 1994 during our first visit, 260 m by 1997-1998 at the time of our second visit and 400 meters by 2006 in the Google Earth imagery. The glacier remains quite crevassed though not nearly as much as in 1955. Below the first image is from 1955 taken by Richard Hubley, the second is in 2004, third in 2006 and last in 2008. In each image Recession Rock is labelled with a purple R, the maximum advance of the 1955-1970’s indicated by a orange arrow and the crevassed top of the lower icefall by a green arrow.


Google Earth images from 1998 and 2006 illustrate the retreat over the last 35 years. This glacier has not lost as much area as others around Glacier Peak, such as Milk Lake Glacier which disappeared, Honeycomb Glacier or Vista Glacier. The area loss has been more modest like on Suiattle and Kennedy Glacier.

Lodalsbreen Retreat, Norway
Lodalsbreen is an outlet glacier from the northeast region of the Jostedalsbreen Icecap of Norway. This particular outlet is difficult to reach and not often investigated, for this icecap in general all 10 glaciers observed from 2000-2010 have retreated (Norwegian Water Resources, 2010). Recent work by Nussbaumer et al (2011) and Imhof et al (2011) have focussed on the changes in terminus postion of Jostedalsbreen glaciers since the Little Ice Age including Lodalsbreen. The glacier reached a maximum around 1750 and has retreated 4.5 km up to 2006 as noted in the second image below modified only slightly from Nussbaumer et al (2011). The third image indicates Lodalsbreen and the western tributary and the large accumulation zone of Jostedsalsbreen that feeds the many outlet glaciers, image source is the WGMS-UN publication Global Glacier Change:s Facts and Figures. 

 The glacier was 6 km long in 2005. A comparison of 1989, 2000, 2002, 2010 and 2012 Landsat imagery indicates the retreat of the main tongue, purple arrow for 1989 and yellow arrow 2010 and western tributary that was previously joined to the glacier, red arrow at 1989 terminus. From 1989 to 2010 Lodalsbreen has retreated 240 meters. The western tributary terminated in the valley bottom at 750 meters above sea level in 1989, and by 2010 has retreated 500 meters up the valley wall to 1000 meters above sea level. Most of the retreat of the tributary has been since 2000. The retreat of this glacier is similar to that of other Norwegian glaciers in the area, Tunsbergdalsbreen and Midtdalsbreen . The Jostedalsbreen has a large accumulation area above 1500 meters that feeds the many outlet glaciers, which are no in danger of disappearing with current climate.


Douglas Neve Glacier Retreat, New Zealand
The primary portion of the Douglas Glacier was a debris covered valley tongue that is separated from the slopes feeding the terminus reach. The feeder glacier tongues, pink arrows, end on the bedrock slopes above a steep cliff and do not reach the valley glacier below, blue arrows.
 One section of the glacier, the furthest west portion noted by a pink arrow, the Douglas Neve flows down a steep mountains side. The bedrock slope at the base of the glacier is particularly smooth, which combined with the steep slope,, 40% grade or 22 degree slope, enhances basal sliding. On small alpine glacier the resulting high velocity leads to extensive crevassing. This crevassing can literally penetrate to the base of the glacier near the thin terminus. This leads to portions of the glacier simply separating from the rest of the glacier and avalanching down the slope or melting in place. Here we utilize Landsat images from 2000 and 2012 and Google Earth imagery from 2004 and 2009 to examine the retreat of this glacier. The sequence of images below are in order 2000, 2004, 2009 and 2012. In 2000 the terminus of the glacier terminates at a prominent bedrock fracture at 1640 meters above sea level. In 2004 the terminus still reaches this fracture. The green line in the Google Earth imagery is the 2004 terminus and the burgundy line the 2009 terminus. By 2009 the terminus has retreated 400 meters, and consists of two unsustainable narrow tongues, both less than 100 meterw side. By 2012 the two narrow tongues have been lost, resulting in a 700 m retreat from 2000 to 2012 with the terminus now at 1800 meters.


 As the retreat of an alpine glacier progresses crevassing typically is reduced as glacier speed declines. Here we see an increase in crevassing from 2004 above to 2009 below in the terminus area, suggesting that the retreat will continue via pieces of the glacier separating from the glacier and avalanching. This process is a much different setting, but similar in practice to ice shelf loss through rifting that reaches the critical point where the rifts lead to icebergs breaking off. At this point the terminus remains unsustainable. This retreat is similar to that of New Zealand glaciers in general as noted by the NIWA and Trevor Chinn, and examined in detail on Murchison Glacier, Mueller Glacier and Gunn Glacier

Matsang Tsanpo Glacier Retreat, Tibet
The glacier retreat of the entire region of southwest China has been rapid and extensive(Li et al, 2011). This post focuses on an unnamed glacier, in the Matsang Tsanpo basin, Sun Khosi River in Nepal, at 28 18 N and 86 10 E. The glacier is located just 10 km east of the Friendship Highway which extends from Kathmandu, Nepal to Lhasa, Tibet. This glacier is north of Nyalam, which translates to Gates of Hell. Analysis is of Landsat imagery from 2000, 2009 and 2011 and Google Earth Imagery from 2011. The Sun Khosi has one major 10.5 MW hydropower station. The second image is the Google Earth image, the green arrow is the current terminus, the orange arrow the 2000 terminus at the edge of the lake, the purple arrows the lateral moraines from the Little Ice Age and the red arrow the Little Ice Age end moraine. 
 . The glacier retreat from 2000 to 2011 is 240 meters. In the Landsat images the orange arrow indicates the 2000 terminus and the green arrows the 2009 and 2011 terminus in their respective images. The last image illustrates fluted moraine to the right of glacier terminus at the red arrow and the purple arrows indicate deep river channels in the glacier surface. The river channels would not be that deep if the glacier was not stagnant near its terminus.


 The retreat of this glacier is similar to that of other glaciers in the area such as Reqiang Glacier and Menlung Galcier. Jin et al (2005) noted that glaciers in the adjacent Pumqu River Basin of southern Tibet were in rapid retreat. This is the dominant response of the high mountain glaciers of central Asia.
Yajun Peak Glacier Retreat, Afghanistan
Glaciers of Afghanistan have received little detailed attention for obvious reasons, only satellite image analysis of selected areas has been completed Haritashiya et al (2009) and Shroder and Bishop (2010), both studies noting a significant retreat and downwasting. In this post glaciers in the remote area around Yajun Peak in the Hindu Kush 150 km northeast of Bagram Airbase and 75 km west of the Pakistan Border are examined.  Landsat imagery from 1998 (1st image below), 2010 (2nd image below) and 2012 (3rd image below) are used in combination with 2008 Google Earth imager (Last image below). Changes in three glaciers on Yajun Peak (6024 m) are highlighted. The yellow arrows indicate the expansion of bare rock amid a glacier draining south from Yajun Peak. The expansion of the bare rock area from the terminus area in 1998 to 2012 is evident as is the expanded area of the ridge in the upper glacier noted by the yellow arrow in each image. The magenta arrows indicate the terminus of a glacier draining west from Yajun Peak that in 1998 did not have a lake at the terminus. In the 2008, 2010 and 2012 imagery a small lake has developed as the glacier has thinned and retreated. The third glacier flows northwest and terminates in 1998 at a green line that is a one kilometer long line between two specific topographic points in each image. The glacier has retreated from the green line by 2008 and the retreat is 125 meters by 2012. In the 2008 Google Earth image a purple arrow points out the upper basin of a fourth glacier that is no longer ice or even snow filled. This along with the expansion of the bedrock ridge near the top of the glacier with yellow arrows indicates that even the accumulation zone of these glaciers are not persistently snow covered. Glaciers that lack a persistent snowcover cannot survive (Pelto, 2010). To see the details just click on each image and an expanded version will appear.


In previous posts on glaciers in the region the Emend Watershed and Zemestan Glacier the retreat is similar.
Porisjokull Retreat, Iceland
Porisjokull (Thorisjokull) is a small 25 square kilometer ice cap southwest of Langjokull. The top elevation of the icecap is just 1350 m. This ice caps outlet glaciers have been in retreat as have almost all Iceland glaciers in the last decade (Helgi Björnsson and Finnur Pálsson, 2008). Examination of Landsat images from 2000, 2002, 2011 and 2012, shown in that order below, are used to identify changes in Porisjokull. The primary changes in the periphery are retreat of two lobes on the east side of the icecap at the yellow and red arrow and loss of ice at glacier connections green arrow and purple arrow. The comparison of the 2000 and 2011 images in particular illustrate the complete loss of the lobes at the yellow and red arrow. Between outlets of the icecap areas of glacier area have diminished significantly at the green and purple arrow.


 The lobe at the yellow arrow has been lost, this represents a retreat of 500 m. At the red arrow the lobe has also been lost, a retreat of 400 m. In the Google Earth images below the lobes still exist.
 At the green arrow the glaciated area declined from 1.2 square kilometers to 0.5 square kilometers. At the Purple arrow the margin of this intermediate lob has retreated 300 m.
 The icecap changes has mirrored that of nearby Langjokull, Gudmundsson et al (2008) identified thinning across the accumulation zone of Langjokull from 2000-2007. This led to retreat of the largest outlets of Langjokull.
Bjornsson and Gislason (2010) have examined the climate change that is driving the response of the glaciers.
Lapperent Outlet Thinning and Retreat, Kerguelen Island
Kerguelen Island sits alone at the edge of the furious fifties in the southern Indian Ocean. The island features numerous glaciers, the largest being the Cook Ice Cap at 400 square kilometers. A comparison of aerial images from 1963 and 2001 by Berthier et al (2009) indicated the ice cap had lost 21 % of its area in the 38 year period. In this paper they focused particular attention on the Ampere Glacier, pink arrow in first image, draining the southeast side of the ice cap, that had retreated 2800 meters from 1963 to 2006. Berthier et al (2009) had a second focus on the Lapparent Nunatak due north of the main terminus and close to the east terminus, referred to hear as the Lapparent Outlet. A nunatak is a ridge or mountain surrounded by a glacier, really an island in a sea of ice. The nunatak expanded from 1963-2001, in the second image below from Berthier et al (2009), but it was still surrounded by ice. 
 . In this post we examine changes at the terminus and at several points upglacier in 2001 and 2011 Landsat imagery that indicate widespread thinning and deglaciation. In each image the letters are in the same location as are the colored arrows. The green arrow indicates the 2001 terminus of the outlet and the burgundy arrow the 2011 terminus, indicating a 2 km retreat in a single decade for the southern calving terminus and for the northern terminus above point D 2200 meters of retreat. In 2001 the region around letter D is a filled by the northern arm encircling the Lapparent Nunatak, by 2011 D is in a deglaciated valley. B marks the southern end of the 2011 terminus. F in 2011 marks a location where the Lapparent Outlet spills over a ridge into another valley, by 2011 the overflow has narrowed from 1100 meters to just 500 meters in ten years. The result is less ice flow into the secondary basin, including down a bedrock step to point E. Point E in 2001 is in the midst of the lower reach of the glacier. By 2011 there is no ice near point E as the glacier no longer descends to this lower step. Point A in a nunatak 4 km inland from the Ampere and Lapperent Outlet terminus, this nuntak has expanded from a long axis of 1100 meters to 1500 meters. Berthier et al (2009) had noted thinning around the Lapprent Nunatak of 150 to 250 m. This continued thinning since 2001 is leading to further expansion of the nunatak at A and to reduced ice spillover at point F.
 This island and glacier is experiencing the same climatic warming that is causing retreat of other glaciers in this circum-Antarctic latitude belt, Stephenson Glacier on Heard Island, Neumayer Glacieror Ross Hindle Glacier on South Georgia and on the north side of Cook Ice Cap, Kerguelen Ice Cap.
Chuecon Glacier Retreat, Peru
In the Cordillera Centrale of Peru a series of glaciers extends north from Pariacaca. Pariacaca is the pre-Incan god of water, appropriate name in this dry region, that is draped with glaciers and has numerous alpine lakes. In fact with glacier retreat the number of lakes is increasing. Here we examine the Chuecon Glacier which descends from Nevado Suerococha, and ends in a new lake before draining into the Rio Carhuapampa.  This area has has escaped attention on its recent retreat. The retreat of the Chuecon Glacier over the last decade is documented with a comparison of Landsat and Google Earth imagery from 1997, 1998, 2005,2010 and 2012. The Chuecon Glacier terminus is indicated with a pink arrow in the Landsat images. The green arrow is the Manon Glacier. In 1997 and 1998 the lake at the terminus has not yet begun to form, by 2005 a small lake has developed at the north corner of the terminus. By 2010 the lake is 450 meters from north to south and 150 to 200 m east to west. The retreat from 1997 to 2010 is 200 meters.


 A closeup view of the glacier indicates that even in the accumulation zone bedrock is being exposed amidst the icefall and the accumulation zone margin in retreating, pink arrows in both images.
 The terminus currently is calving into the lake some, an upwelling area where the subglacial glacier runoff stream enters the lake is evident, yellow arrow. The terminus area also has ablation depressions forming an indication of stagnation, principally on the southern arm of the glacier, pink arrows. The purple arrow on the bottom image indicates the terminus in 1997. The combination of limited accumulation area and ablation depressions indicative of stagnation indicate a glacier that is not only retreating, but will not survive (Pelto, 2010). The ongoing field work at Quelcaya Ice Cap, led by Doug Hardy at UMASS, provides a detailed view of what is happening to glaciers in the region. Bryan Mark at Ohio State University has also been observing detailed changes around Mount Pucaranra, Peru.

