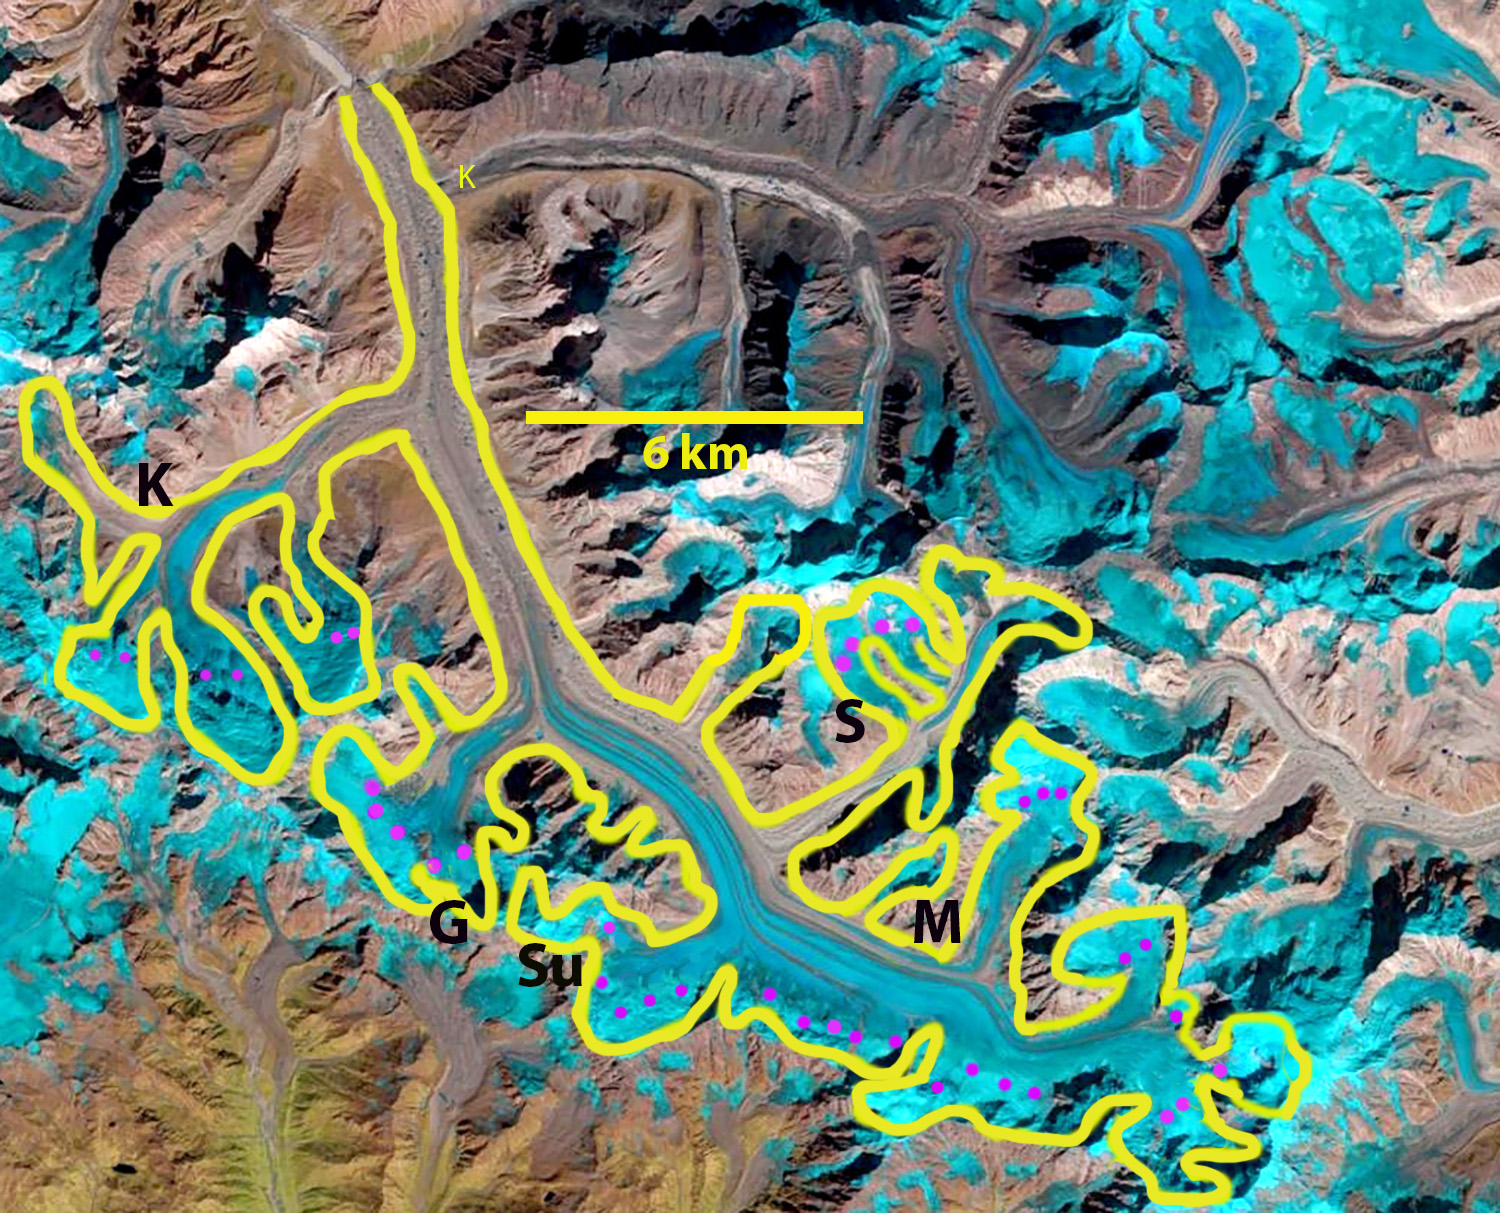
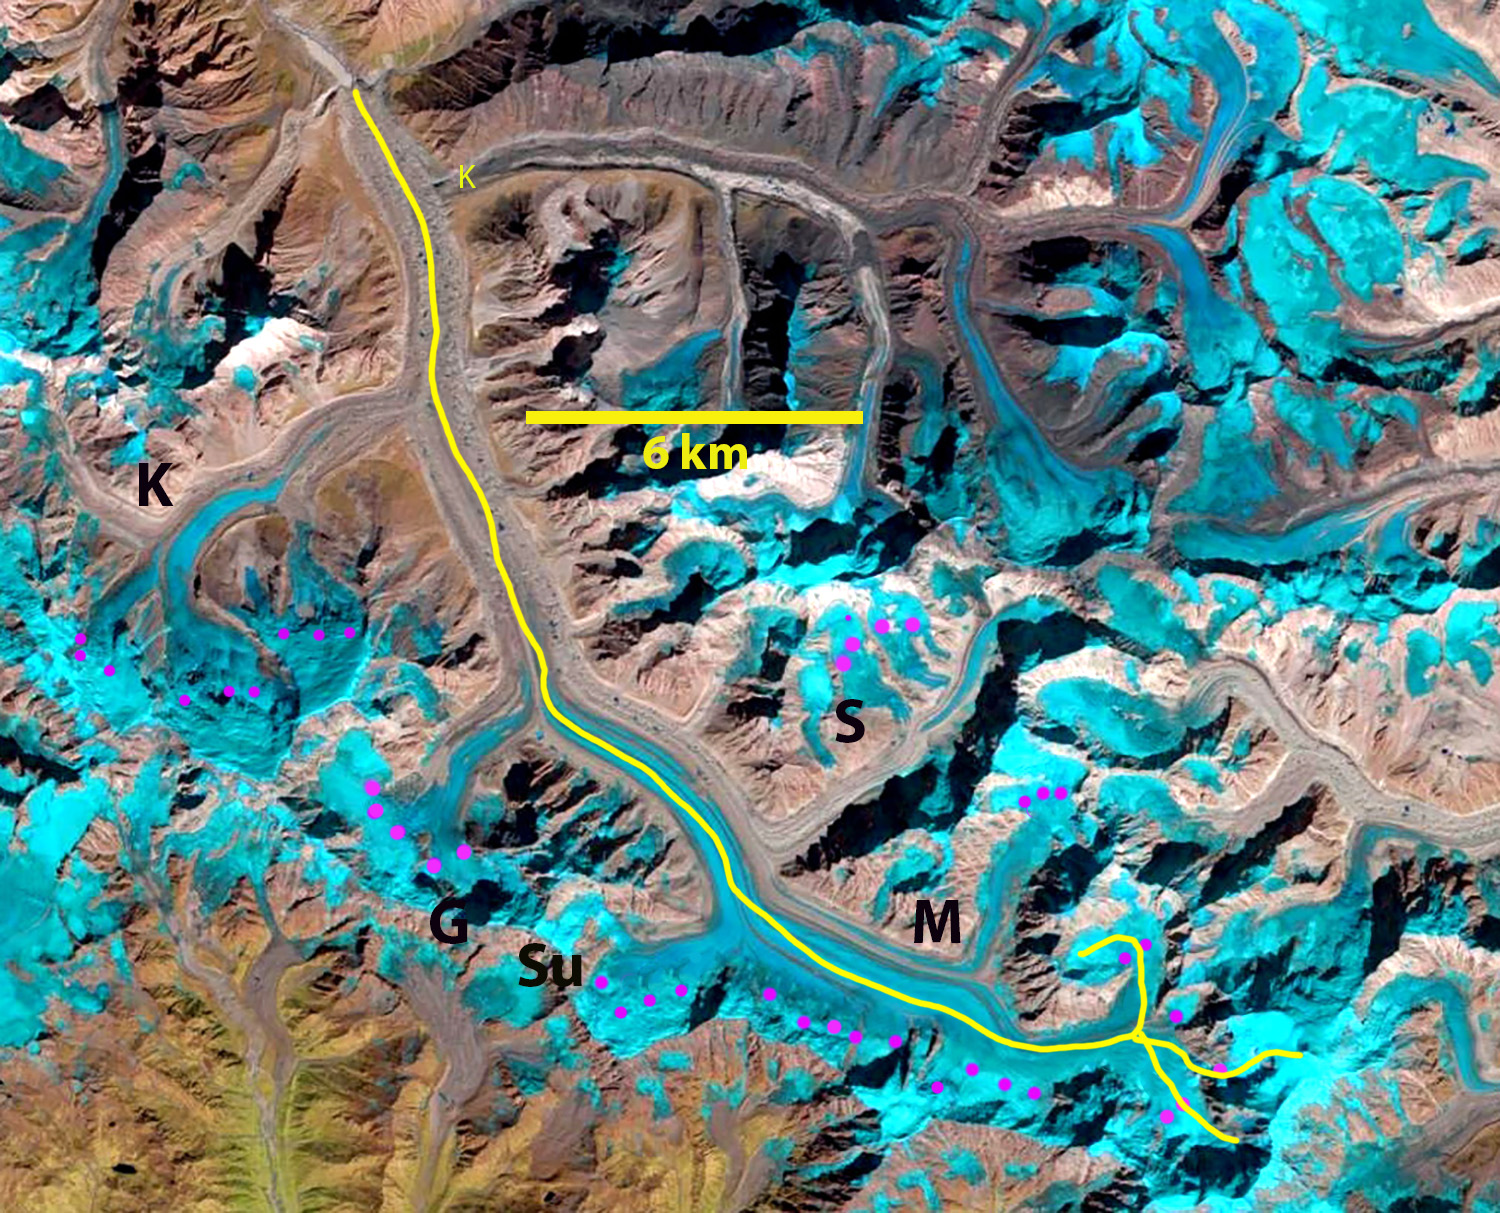
Gangotri Glacier snowline averaging 5600 m on Oct. 16, 2020 in Landsat image, magenta dots indicate the snowline. Yellow line is the Randolph Glacier Inventory margin. Tributaries: K=Kirti; G=Ghanohim, Su=Sumeru, M=Maiandi, S=Swachhand.
Gangotri Glacier, India is in the Bhagirathi River watershed and is the largest glacier in the Garhwal Range of the Himalaya. Gangotri Glacier supports hydropower as its meltwater runoff passes through three hydropower plants generating 1430 Megawatts including the Tehri Dam, Maneri Bhali I and II. From 1968-2006 the glacier retreated 800 meters, ~20 meters/year (Bhambri et al 2011). The glacier has continued to thin and tributary inflow has declined with a tributary (Chaturangi) separating during this period . Bhambri et al (2011) noted that recession rates have in the region have increased since 1990. Bhattachaya et al (2016) expanded on this work noting that the velocity of Gangotri Glacier declined during 2006-2014 by 6.7% from 1993-2006, indicating a reduced volume of accumulation flowing downglacier. They also noted an increase in the rate of debris-covered area expansion on the main trunk of Gangotri Glacier from 2006-2015, indicative of an expanding ablation zone. Bhattachaya et al (2016) report a retreat rate of 9 m/year 2006-2015, which is less than before, but the down-wasting in the same period 2006-2015 was higher than during 1968-2006.
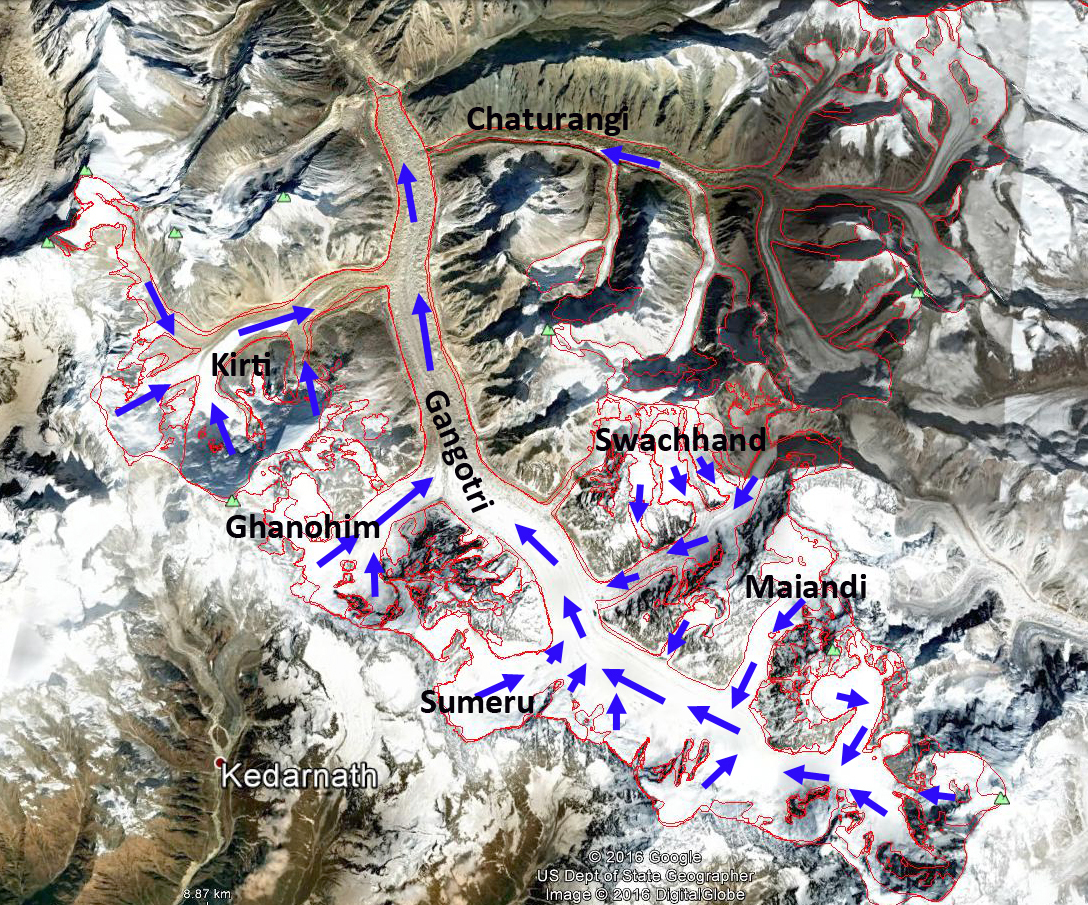
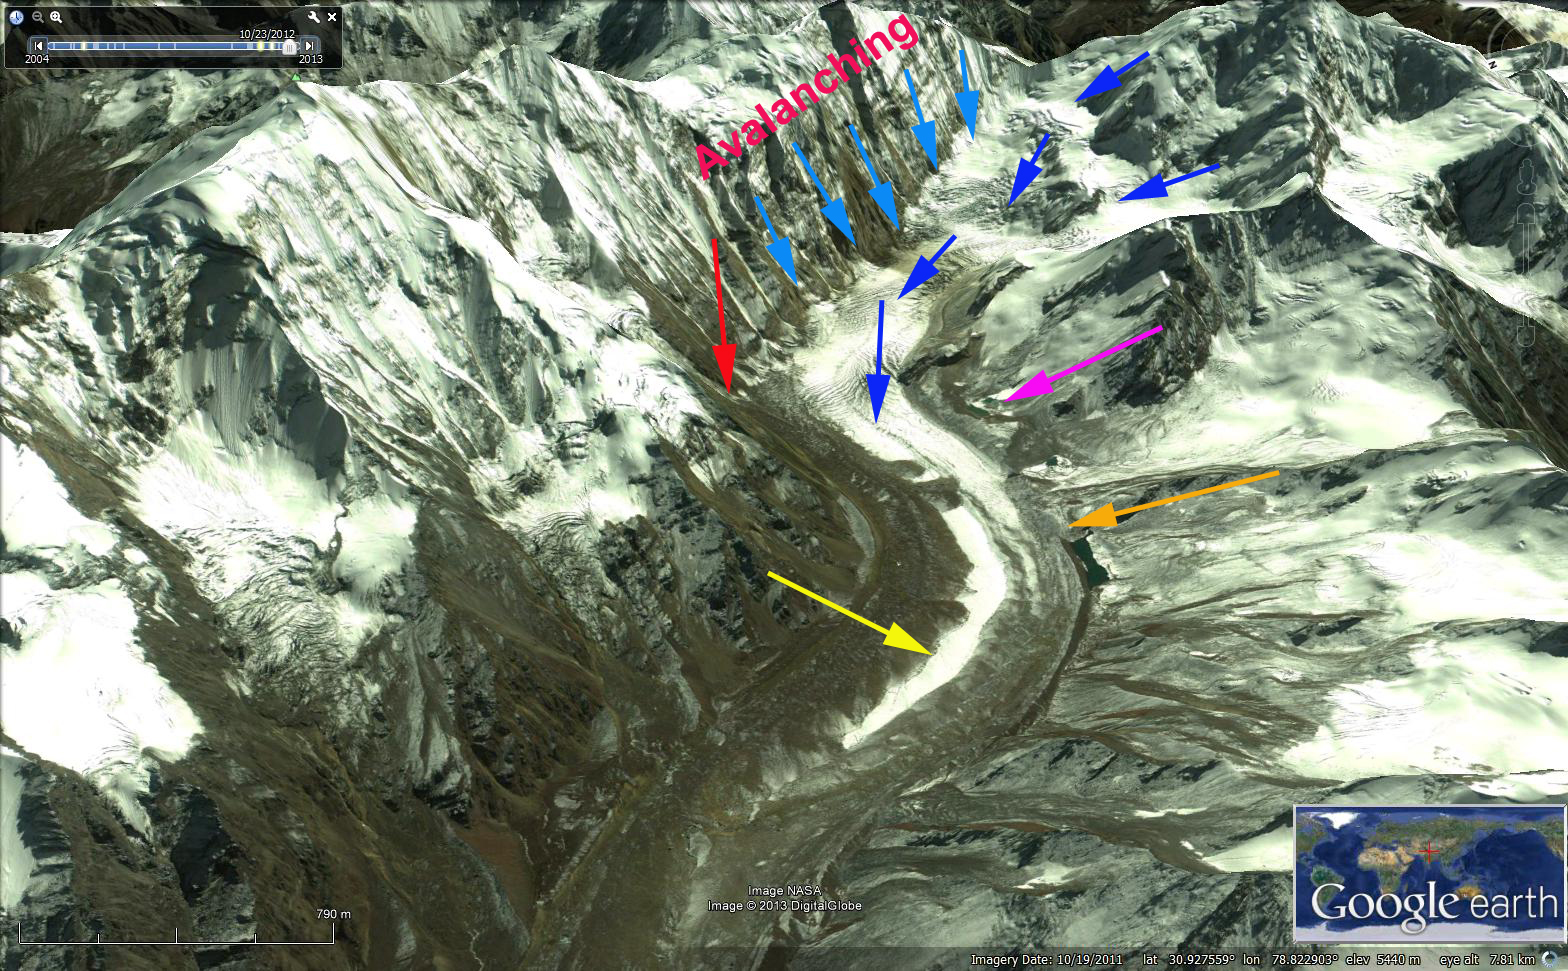
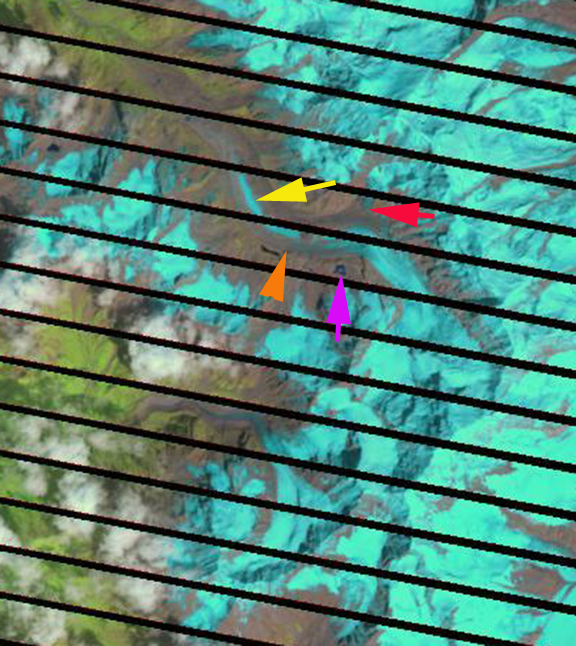
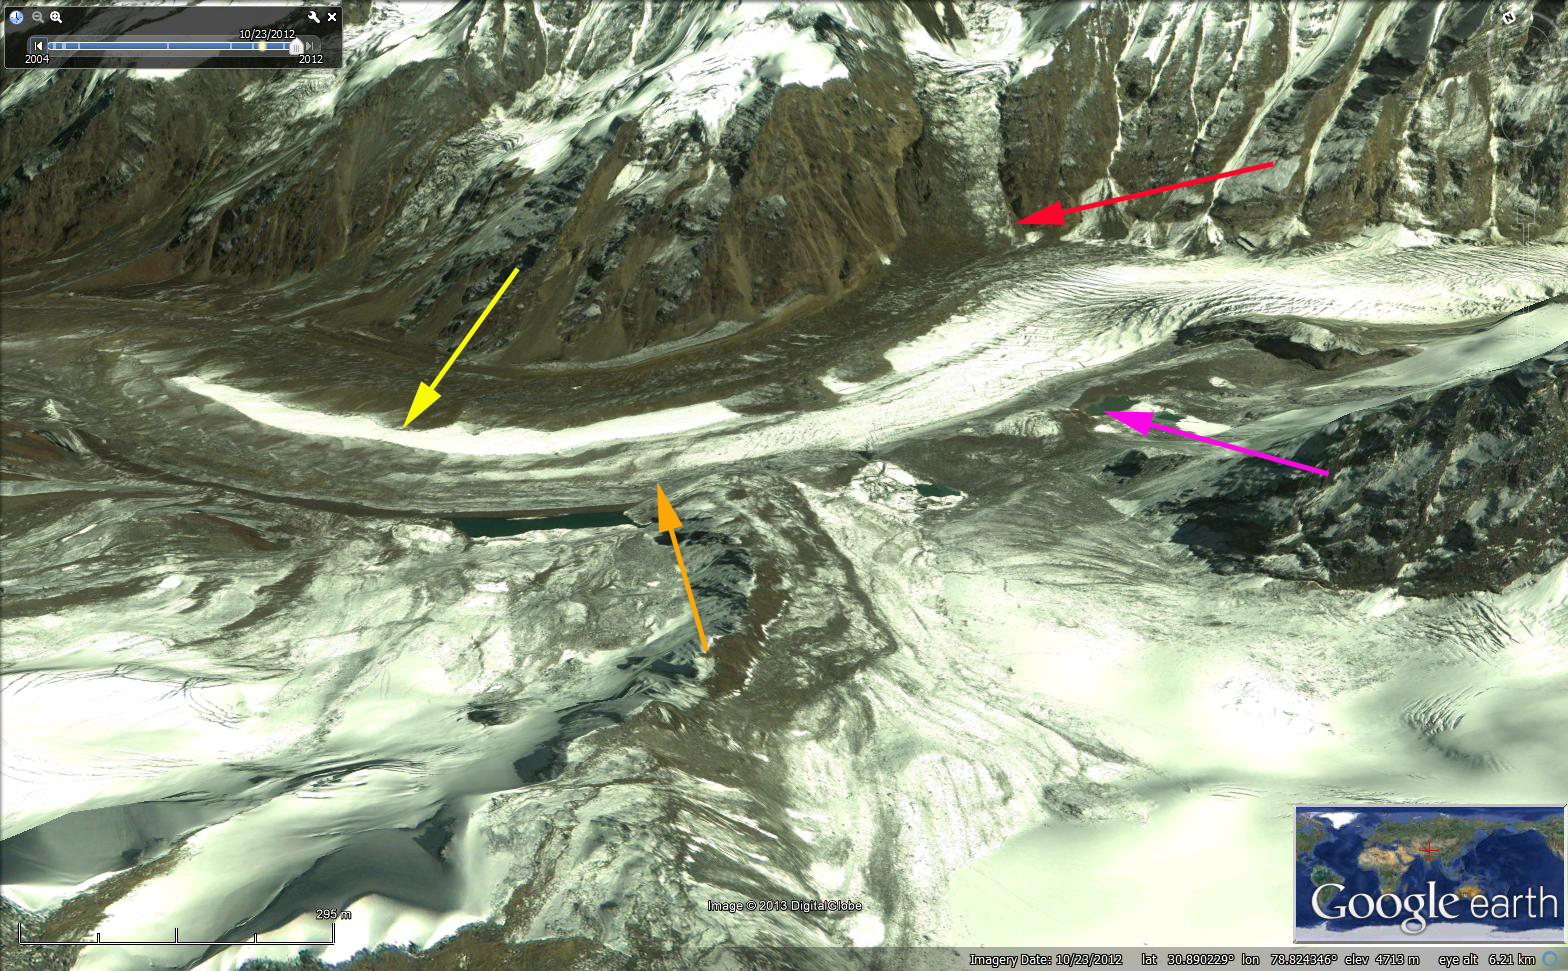
Gangotri Glacier boundary and flow directions on Digital Globe image with GLIMS glacier outline indicated.
Gangotri Glacier is a summer accumulation glacier with the peak ablation period low on the glacier coinciding with peak snowfall high on the glacier during the summer monsoon. In the post monsoon period of October and November precipitation is low and melt rates decline. Kundu et al (2015) noted that from Sept. 2012 to January 2013 the snowline elevation varied from 5080 m to 5174 m . This contrasts to an ELA of 4875 m reported by (Bhattachaya et al 2016) and 5100 m (Bhushan et al 2017).
On October 9, 2016 the snowline was at 4850 m on the main trunk and on the tributary Ghanohim Glacier, and 4750 m on the tributary Kirti Glacier. By November 30th a Landsat image indicates the snowline has risen to 5400 m on the main trunk and Ghanohim, the snowline is at 5800-5900 m on the glaciers in the Swachhand tributary valley, at 5600 m on Maiandi Glacier and 5700 m on the last tributary entering from the north. A Landsat image from Dec. 9th indicate that the snowline remains approximately the same as on Nov. 30th. The substantial post monsoon snowline rise in 2016 is illustrated in this article on Gangotri Glacier.
On October 16, 2020 a warm/dry post monsoon season has led to the snowline rising rapidly on Gangorti Glacier. On Kirti the snowline is at 5500 m, on Ghanohim at 5400 m, on Sumeru at 5500 m, on the main stem 5600-5700 m, on Maiandi at 5700 m and on Swachhand at 5800 m. The snowline is averages 5600 m the same as in 2016. Below the snowline there is limited older firn exposed, indicating that limited snow is retained below 5400 m on Gangotri Glacier from year to year. The bare glacier ice has a lower albedo then snow increasing melt and further reducing glacier mass balance.
The accumulation area ratio is the percentage of a glacier in the accumulation zone and is typically above 50% for a glacier in equilibrium. On Gangotri Glacier in November 30, 2016 the accumulation area ratio was 20-24%, indicating a large mass balance deficit. On October 16, 2020 the AAR of Gangotri Glacier was 23%. More important the firn line indicates that the AAR is now consistently at ~25%. This will drive continued retreat and will accelerate the retreat. How far upglacier on Gangotri Glacier do you have to travel to reach the snowline? On the central flow line 29-30 km along the 31-33 km length. The increase in temperature has led to a tendency for snowlines to rise in the post monsoon period and remain high into the winter season on other Himalayan glaciers such as West Rongbuk Glacier and around Mount Everest in 2019.
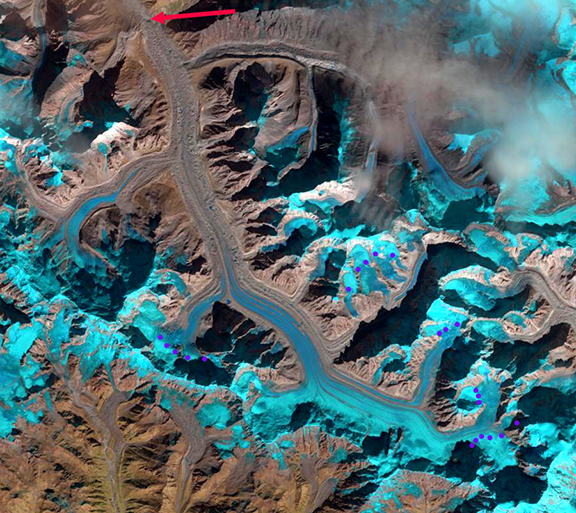
Central flowline for Gangotri Glacier, 32 km long, with 29.5 km in the ablation zone. Landsat image from 10-26-2020.