Beautiful British Columbia Land of Many Mountains & Dwindling Glaciers

[ngg_images source=”galleries” container_ids=”4″ display_type=”photocrati-nextgen_basic_imagebrowser” ajax_pagination=”1″ template=”/nas/wp/www/sites/blogsorg/wp-content/plugins/nextgen-gallery/products/photocrati_nextgen/modules/ngglegacy/view/imagebrowser-caption.php” order_by=”sortorder” order_direction=”ASC” returns=”included” maximum_entity_count=”500″]

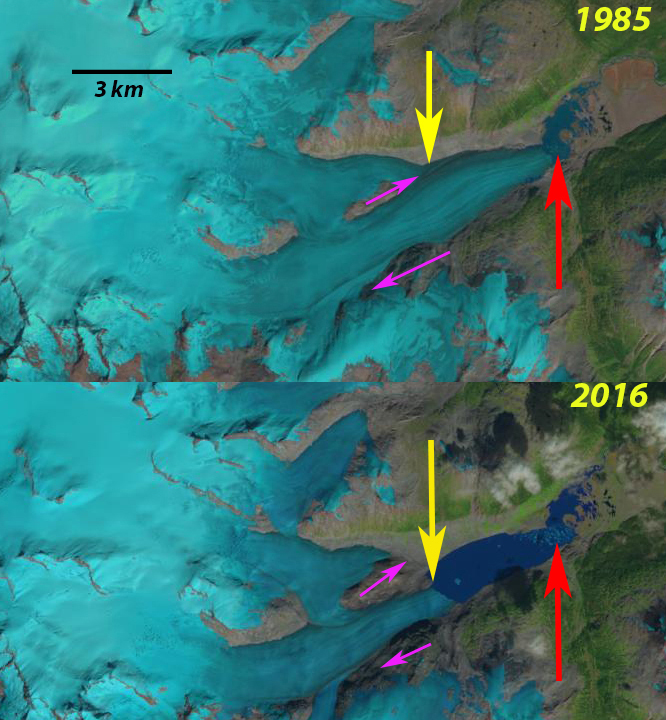
British Columbia is host to many mountain ranges; Purcell, Monashee, Bugaboo, Selkirk, Cariboo, Coat Range, Kootenay, Kwadacha are just some of the diverse mountain ranges  that host glaciers and span climate zone. A shared characteristic today regardless of climate zone or mountain range is dwindling glacier size and volume.  Bolch et al (2010) found that from 1985-2005 Alberta glaciers lost 25% of their area and BC glaciers 11% of their area.  Tennant and Menounos (2012) examined changes of the Rocky Mountain glaciers including Alberta finding that between 1919 and 2006 glacier cover decreased by 590 square kilometers, 17 of 523 glaciers disappeared and 124 glaciers fragmented into multiple ice masses.  Jiskoot et al (2009) examined the behavior of glaciers of the Clemenceau and Chaba Icefield and found that from the mid 1980’s to 2001 the Clemenceau Icefield glaciers had lost 42 square kilometers, or 14% of their area. Pelto (2016) reported on specific retreat of many of these BC glaciers. Below are links to 31 detailed post examining the changes in recent decades of British Columbia glaciers in response to climate change.

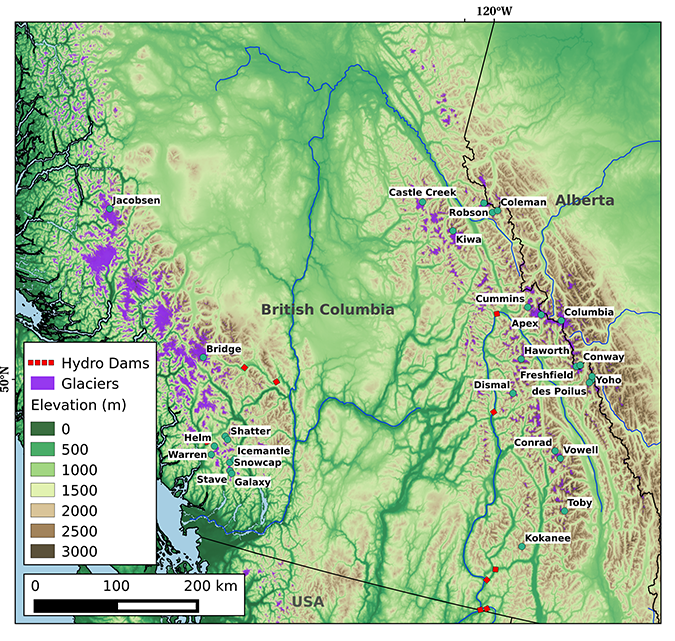
In the summer glaciers in many ranges are crucial water resources for aquatic life and hydropower.   In BC 92% of electricity is generated by hydropower mainly from large projects.  BC Hydro has 31 such large projects, including several heavily fed by glaciers: Bridge River, Mica, Cheakamus, Ruskin and Stave Falls. There are also run of river hydroprojects with a new one constructed by AltaGas, the 195 MW Forrest Kerr Project on Tahltan First Nation land on the Iskut River. The Iskut River like the Stikine River is heavily glacier fed. As spring begins glaciologists will be heading out to measure glacier mass balance a critical input to understanding current and future glacier runoff, such as the Columbia Basin Trust sponsored project overseen by Brian Menounos at UNBC, and field operation direct by Ben Pelto at UNBC.


Forrest Kerr Hydro is a run of river project relying on a weir instead of a dam to divert water into the intake.
There are also numerous salmon fed streams with critical glacier input, such as the Skeena River and Rivers Inlet. Stahl and Moore (2006) identified that discharge from glacierized and nonglacierized basins in British Columbia indicates the negative August streamflow trends illustrate that the initial phase of increase runoff causing by climate warming has passed and runoff is now declining. This is similar to further south in the North Cascades of Washington (Pelto, 2015).

Shatter and Shudder Glacier
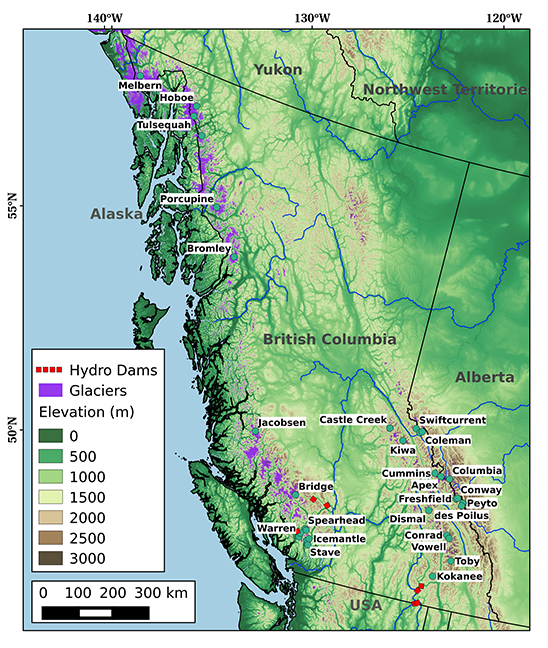
Snowcap Creek Glacier
Stave Glacier
Helm Glacier
Warren Glacier
Galaxy Glacier
Icemantle Glacier
Big Bend Glacier
Kokanee Glacier
Toby Glacier
Conrad Glacier
Vowell Glacier
Bridge Glacier
Klippi Glacier
Yoho Glacier
Des Poilus Galcier
Haworth Glaciers

Apex Glacier
Kiwa Glacier
Dismal Glacier
Cummins Glacier
Coleman Glacier
Swiftcurrent Glacier
Bromley Glacier
Sittakanay Glacier
Nass Peak Glacier
Porcupine Glacier
Great Glacier
Hoboe Glacie
Tulsequah Glacier
Melbern Glacier

Bridge Glacier Terminus Collapse, BC, 4 km retreat 1985-2016

Bridge Glacier comparison in 1985 and 2016 Landsat Images.  Red arrow is the 1985 terminus, yellow arrow the 2016 terminus and purple arrows indicate locations where tributaries have separated between the two dates. 

Bridge Glacier is an 17 km long outlet glacier of the Lillooet Icefield in British Columbia. The glacier ends in a rapidly expanding glacial lake and had an observed retreat rate of 30 m per year from 1981-2005 by Allen and Smith (2007). They examined the dendrolchronology of Holocene advances of the glacier and found up to 2005 a 3.3 kilometer advance from the primary terminal moraine band, with the most extensive advances being early in the Little Ice Age.  Chernos (2016)  indicates that the glacier in 2013 is approaching the upglacier end of the lake, which will lead to reduced retreat rates.  Here we compare Landsat imagery from 1985 to 2016 to determine response.

In 1985 the proglacial lake was 2.5 km long and 3.5 km upglacier of the terminus a major tributary joins.  The transient snow line is 2100 m. By 1993 the glacier has retreated 200-300 m and the snowline was at 2150 m.  By 2004 the terminus in a Google Earth image the terminus had retreated 1100 m since 1985.  By 2004 the tributary from the north has separated from the north side of the glacier.There are also some evident areas where the proglacial lake is visible up to 800 m upglacier of the terminus.  This suggests imminent collapse of this section of the terminus, which is afloat.  Matt Chernos researching this glacier documents this well with images.  Chernos (2016) observed that calving due to greater water depth and terminus buoyancy was key to retreat, but that most volume loss stemmed from melting.   In 2016 the terminus has retreated beyond the former junction of the Bridge Glacier and the northern tributary.  The glacier terminus is now within 500 m of a slope increase, likely marking the end of the developing lake basin. The total retreat in 31 years has been 4.1 km, this is a rate of 130 m/year, much faster than before. The 3 km retreat from 2004 to 2016 indicates a retreat of 250 m/year.  The separation of the three tributaries, purple arrows are not impacted by calving and indicate melting alone is sufficient to drive significant retreat.  The enhanced melt is also the cause of the high snowlines,, in 2016 the snowline is at 2150 m. The retreat is faster than nearby Klippi and Jacobsen Glacier, but both of those are also retreating fast.

This continued retreat and area loss will lead to glacier runoff decline in summer. This is crucial to the large Bridge River Hydro complex. This complex managed by BC Hydro can produce 490 MW of power, which is 6-8% of Province demand. Stahl et al (2008) note in their modeling study of the glacier that ,”The model results revealed that Bridge Glacier is significantly out of equilibrium with the current climate, and even when a continuation of current climate is assumed, the glacier decreases in area by 20% over the next 50 to100 years. This retreat is accompanied by a similar decreasein summer streamflow.”   Lillooet News (2016) notes that BC Hydro has commissioned research on the glacier to investigate impact on runoff tiiming. This parallels our findings on the Skykomish River in the North Cascades, Washington Pelto (2011).  The change in timing and the hydropower also impact salmon with late summer runs of chinook and fall coho runs.

Bridge Glacier comparison in 1993 Landsat Image.  Red arrow is the 1985 terminus, yellow arrow the 2016 terminus.

2005 Google Earth image of Bridge Glacier, note tributary separation from the north.

Closeup of terminus indicating exposures of proglacial lake upglacier of the terminus.Bridge Glacier Retreat Acceleration, BC, Canada