Sater Glacier, Alaska Not Retaining Snowcover

sater glacier ge
2012 Google Earth Image. Purple arrows indicate areas where the margin is receding well above the lowest terminus.

Sater Glacier is in the Okpilak River watershed of the Brooks Range, Alaska. It is named for John Sater an early geologist working in the Brooks Range and on the nearby McCall Glacier. Here we examine Landsat imagery from 1987-2016 to identify changes in the glacier. Matt Nolan, U. Alaska-Fairbanks,  has provided links to the recent research and publications at McCall Glacier. These glacier have suffered increased mass loss since 1990 as a result of an increase in the equilibrium line altitude that has reduced accumulation area and is indicative of increased ablation (Delcourt al , 2008) as noted at Slender Glacier.

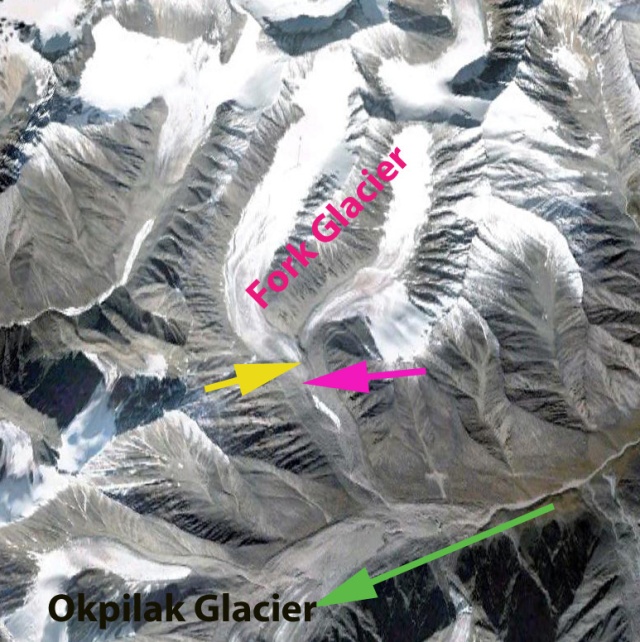
In 1987 Sater Glacier extended from 2300 m to 1600 m with two main tributaries joining 1 km above the terminus. Retained snowcover blankets most of the glacier in this early August image.  In 1995 the main change is the lack of retained snowcover on the glacier, with a month left in the melt season.  The retained snowcover is the accumulation area ratio (AAR), which needs to be above 50% for a glacier to be in equilibrium, but is less than 10% in 1995. The 2012 Google Earth image above indicates very little retained snowcover on the glacier in mid-July, AAR of 15%. Likely no retained snowcover by summer’s end. In 2015 a late July image again indicates limited retained snowcover, the AAR less than 10%.  In 2016 the late July image again indicates limited snowcover though slightly better than in 2015 with an AAR of 25%. This persistent failure to retain snowcover indicates a glacier than cannot survive (Pelto, 2010).  This has also led to the near separation of the tributaries, retreat of the upper margins of the glacier and terminus retreat of 250 m. The retreat of the terminus has been much less than Okpilak Glacier, but the prognosis due to the lack of retained snowcover is much worse, it cannot survive current climate.

sater glacier 1987
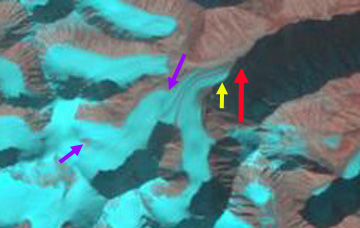
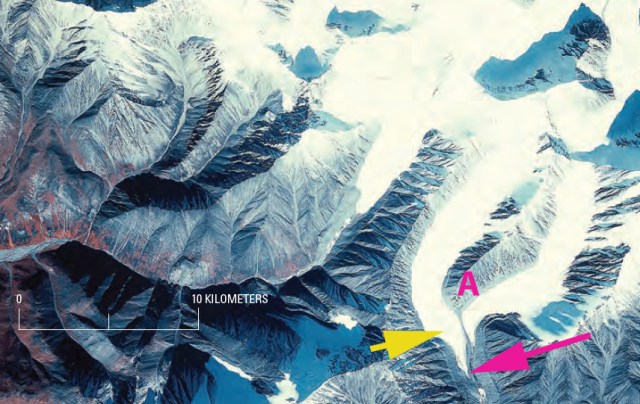
1987 Landsat image red arrow indicates 1987 terminus, yellow arrow 2015 terminus and purple arrows upglacier thinning.

sater glacier 1995
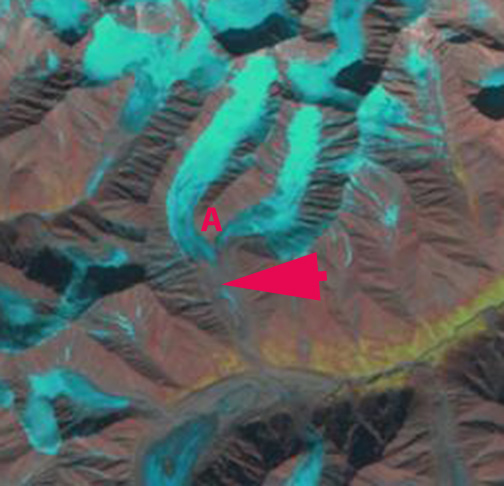
1995 Landsat image red arrow indicates 1987 terminus, yellow arrow 2015 terminus and purple arrows upglacier thinning.

sater glacier 2015
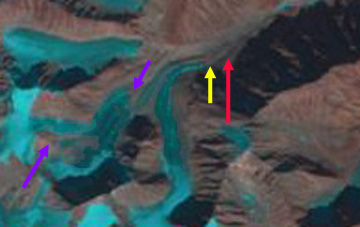
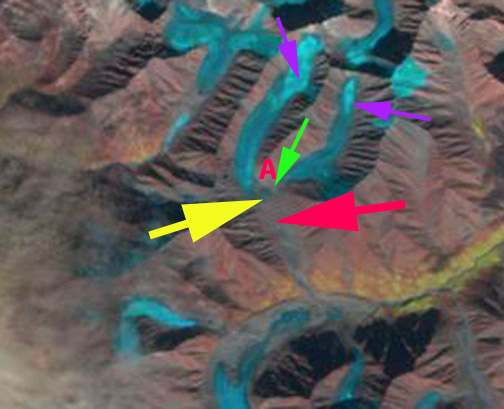
2015 Landsat image red arrow indicates 1987 terminus, yellow arrow 2015 terminus and purple arrows upglacier thinning.
sater 2016

2016 Landsat image red arrow indicates 1987 terminus, yellow arrow 2015 terminus and purple arrows upglacier thinning.

Fork Glacier Retreat and Separation, Brooks Range, Alaska

The Romanzof Mountains in the Brooks Range of Alaska has numerous small alpine glaciers. This is an area that has seen some of the greatest warming of anywhere over the last 30 years. In this post we focus on Fork Glacier which is just northwest of Okpilak Glacier. The glaciers in this region have been undergoing significant thinning and mass loss (Delcourt et al, 2008) including on McCall Glacier, Okpilak Glacier and Romanzof Glacier. Here we examine the changes in Fork Glacier, that has an 2.5 km long east and 3.5 km long west arm that joined at 1800 meters. The glacier than descends 600 meters to a terminus at 1700 m in 1982, the western arm is longer, wider and begins higher at 2300 meters. The first image is a 1982 aerial photograph from the USGS, followed by a 2000 Landsat image, 2009 Google Earth and 2012 Landsat image. The Pink A indicates where the two arms of the glacier joined, the pink arrows indicate the 1982 terminus and the yellow arrow the 2009 terminus. The glacier remained joined in 2000, but for a shorter distance than in 1982. By 2009 the glacier had retreated 400 meters from 1982 and has separated at the terminus. By 2012 the eastern terminus has separated by 200 m from the west branch, green arrow. The other problem evident in the 2012 satellite imagery is the limited extent of snowpack on the glacier at the purple arrows. This level of snowpack even with a month left in the accumulation season indicates a glacier without a consistent accumulation zone that cannot survive (Pelto, 2010) fork 1982fork2000fork gefork2012214 A close up view of the terminus from the 2009 Google Earth imagery indicates the retreat but also the green arrow highlights a supraglacial stream that indicates stagnant ice on the eastern arm of the glacier. fork2012214

Romanzof Glacier Retreat. Brooks Range, Alaska

In the Romanzof Mts. Brooks Range, Alaska McCall Glacier and Okpilak Glacier have been the main focus of research. These glaciers are much smaller than glaciers in southern Alaska, as the region has much more limited amounts of snowfall. The University of Alaska-Fairbanks have focused on McCall Glacier average rate of thinning increased between 1956–93 and 1993–2002, averaging 0.4 m/year for the entire period. The primary region of thinning was the lower third of the glacier below 1700 meters (Nolan et al, 2005). The glacier had retreated 800 meters from the Little Ice Age moraine by 2000 (Nolan et al, 2005). The Equilibrium Line Altitude has risen from 2050 in the 1970’s to 2250 m recently, leading to continued and more rapid losses in ice volume (Delcourt et al, 2009). Okpilak Glacier had retreated 2 km from its Little Ice Age moraine by 2006.

In this post we examine the Romanzof Glacier. The first image indicates the various tributaries feeding into the main valley glacier, burgundy arrows, the reach of well developed stream channels, green arrows. The red line is the map terminus and the yellow line the 2009 terminus. The map is the USGS topographic map from 1956 aerial photographs This glacier has retreated 1300 meters from its 1956 mapped position and 1900 meters from its Little Ice Age moraine, blue line in first image below. The glacier remains 5 km long, having lost 25% of its length in the last 50 years. The rate of ice loss like on McCall Glacier has accelerated. A view of the middle of the ablation zone indicates some well developed stream channels, green arrows. Channels like this take multiple years to form and indicate limited glacier velocity. Closer to the terminus the stream channels are even larger, green arrows. The streams have matured developing meanders, this tends to occur only where the surface is stagnant. This indicates the lower 1200-1500 meters of the glacier is stagnant and melting away quickly. In addition there are some ridges of ice cored moraine indicating that the bare ice is melting faster than the ice under the moraine debris, violet arrows. The bluish arrows indicate where the subglacial streams have emerged from beneath the ice indicating the terminus.

Okpilak Glacier Retreat, Brooks Range, Alaska

The Brooks Range of Alaska contains many alpine glaciers. You hear little about them as there are no large ones and none that can be seen from a cruise ship as in southern Alaska. Though I have worked on many Alaskan glaciers for extended periods, it has always been in southeast Alaska on the larger Juneau Icefield. Hey one month until my 30th field season. The climate is much different as well, with the Arctic Ocean instead of the Pacific Ocean having a more dominant role. The Beaufort Sea Gyre is the nearest major ocean current feature. The Okpilak Glacier drains into the Arctic Ocean and is a large glacier by Brooks Range standards. Matt Nolan at the University of Alaska-Fairbanks has done a beautiful of duplicating a picture taken by Ernest Leffingwell in 1906 with pictures he has taken in 1994, 2004 and 2007. Below is the 1906 picture and the 1994 image, and the 2006 Google Earth view of the glacier. The large retreat is evident, the lateral moraine from the Little Ice Age today stands high above the glacier on the mountain side. The glacier was still near its Little Ice Age maximum when Leffingwell took his picture. By 2006 the glacier had retreated just over 2 kilometers, note the Little Ice age moraine in the Okpilak Glacier image from Google Earth. There is a bedrock knob apparent in both the 1994 and 2006 image, though the ice thickness around the knob is much reduced by 2006. Also the lake at the end of the glacier in 1994 is quickly filling in with glacier sediment and by 2006 is not as prominent. Bernhard Rabus and Keith Echelmeyer-Univ. Alaska-Fairbanks had reported in 1998 that this glacier had retreated 420 meters between 1973 and 1993, 5% of its length and a rate of 20 meters per year. This is larger than the rate of 6-7 meters per year from 1907 and 1958 reported by Ed Sable, who photographed and surveyed the glacier in 1958. The rate of retreat has remained rapid. The 2006 image illustrates the problem, the ELA-snowline is too high and leaves only a small percentage of the glacier snowcovered at the end of the summer. This has been the pattern in recent decades and has led to a loss in average thickness of 30-40 cm per year. This loss though it is in a different climate region is remarkably similar to the losses observed on Lemon Creek Glacier. A view of the terminus of the glacier in 2006 from Google Earth indicates a bedrock knob that is 800 meters upglacier of the terminus. Below this knob there is little crevassing, the ice is thin, both suggesting stagnation and that this section of the glacier will soon be lost. As the sea ice to the north diminishes this area will be interesting to observe, as the potential is there for increased snowfall, while the open water will clearly lead to more warming as well.