Deming Glacier velocity from NASA MEaSUREs ITS_Live at four locations from below icefall at blue X to above icefall at red X. There is not a significant change in velocity above the icefall (red X), but significant deceleration in the icefall and below the icefall.
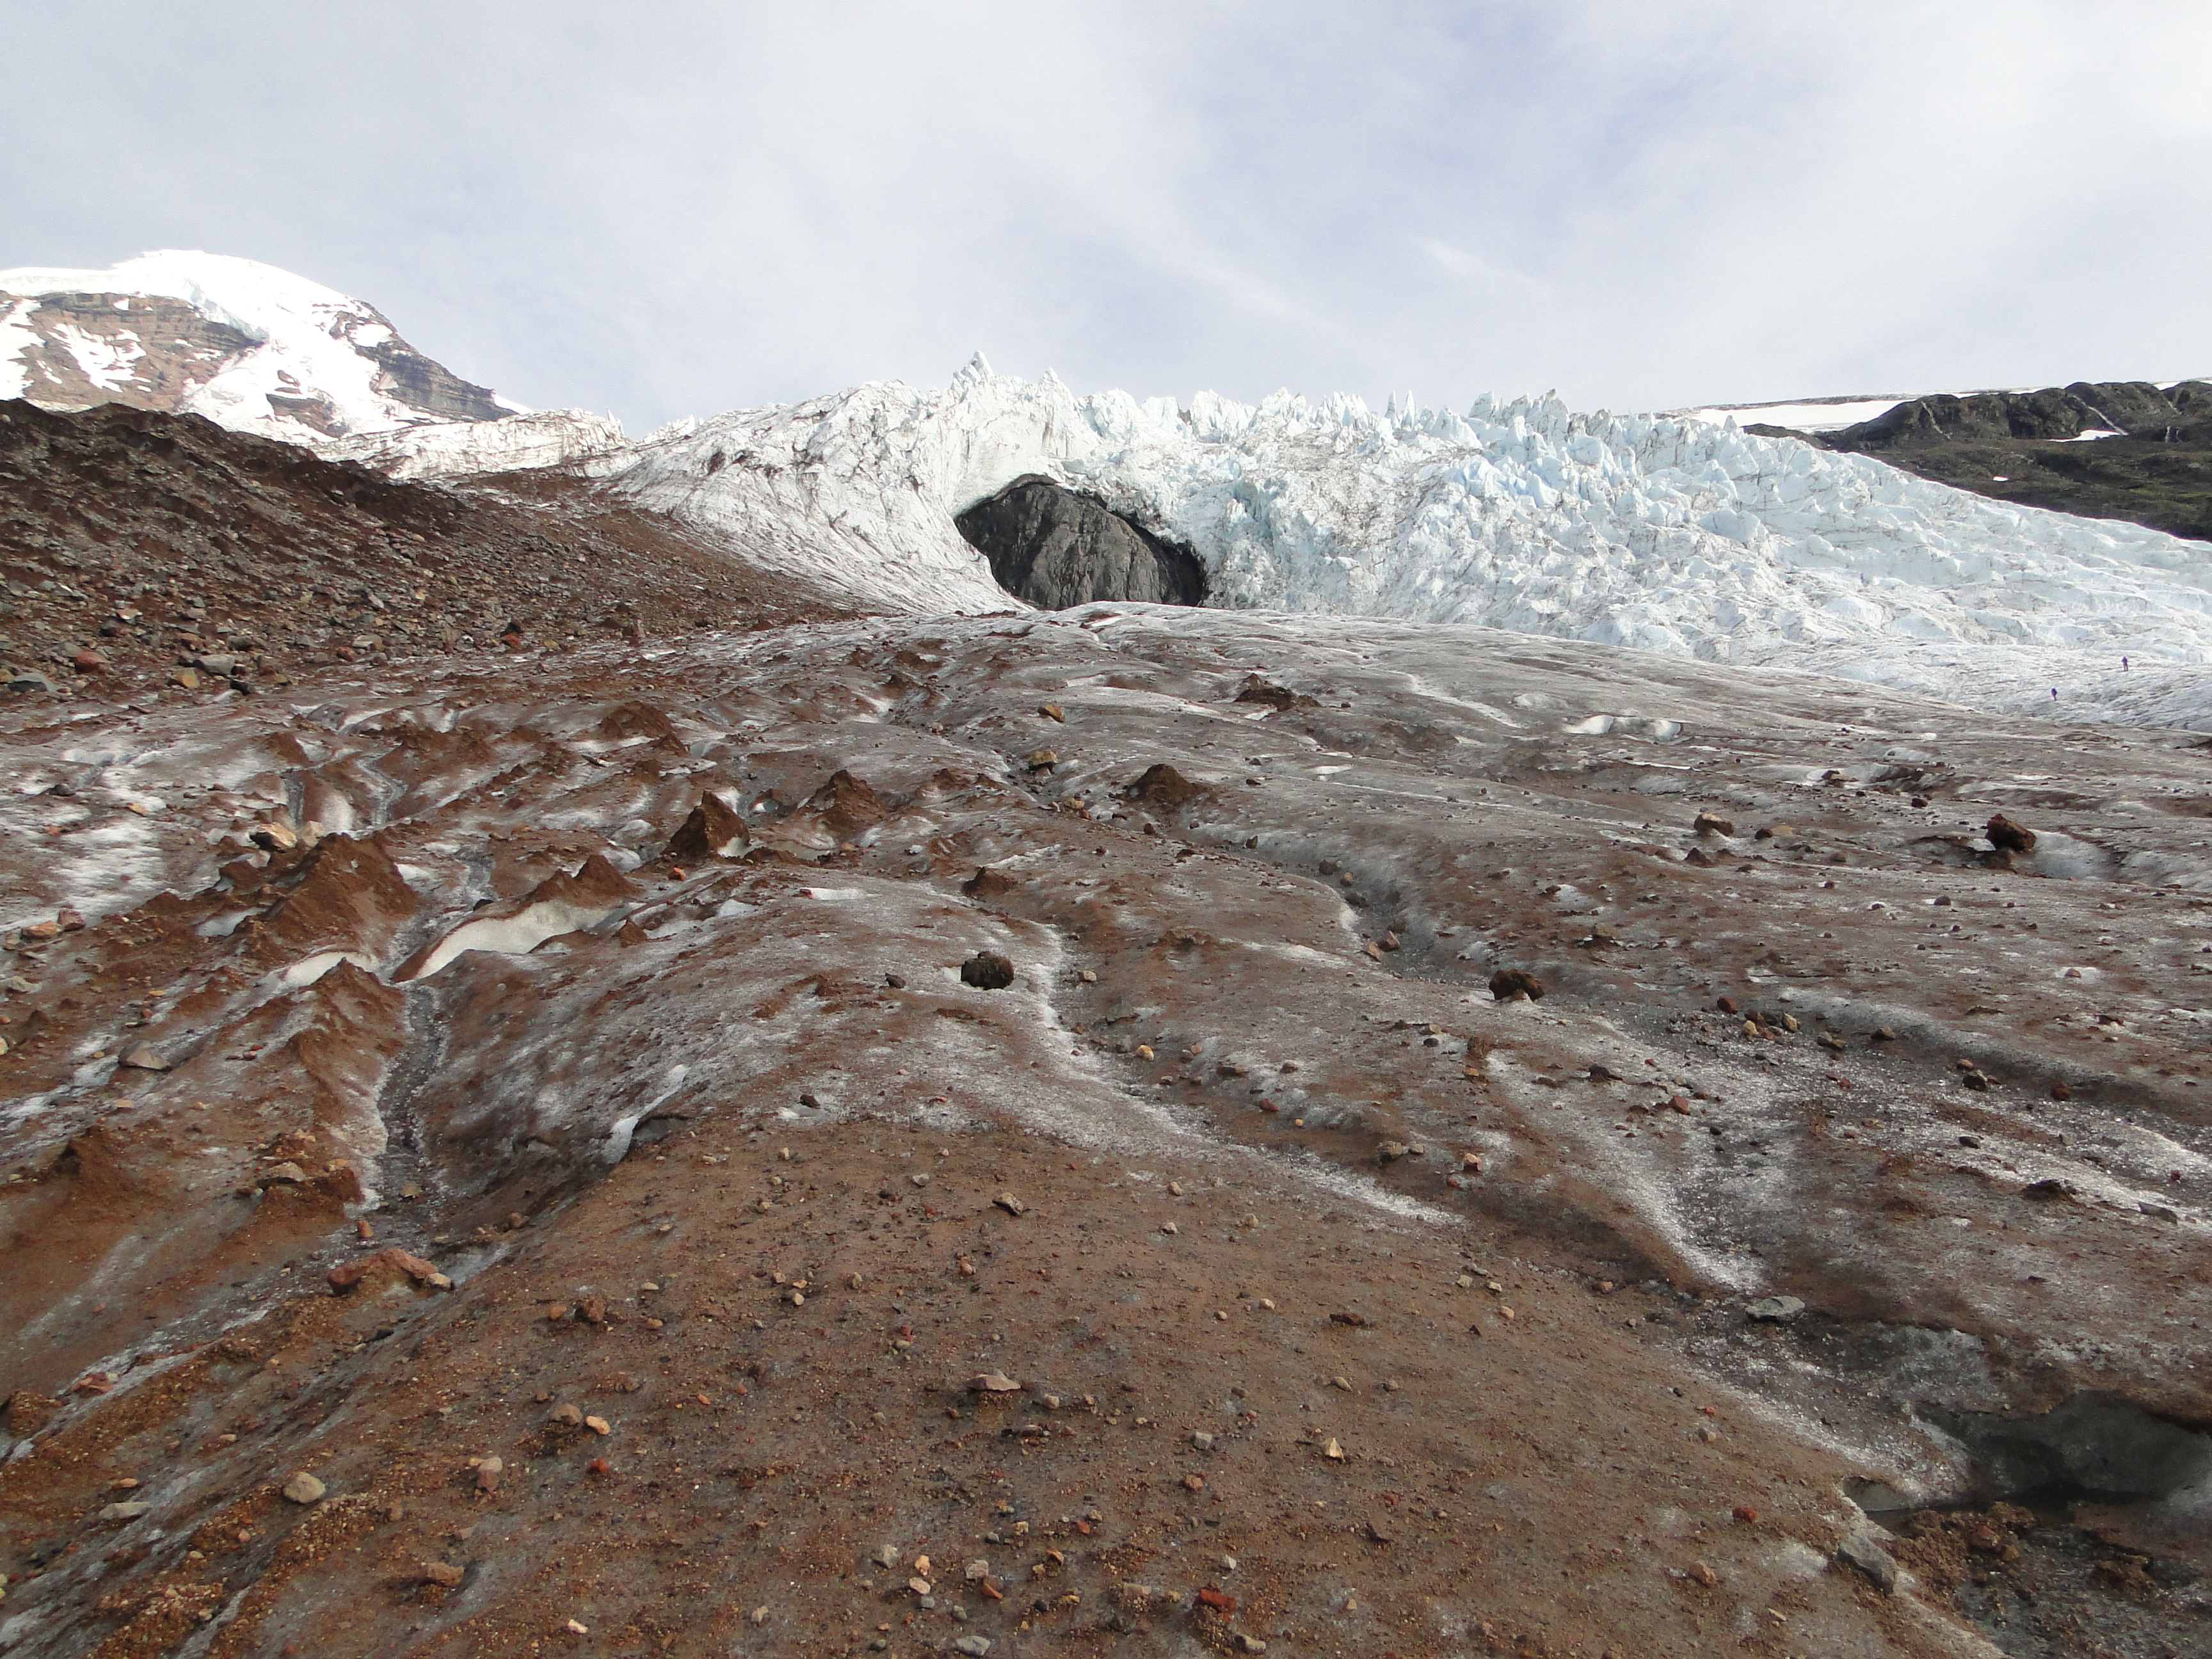
The Deming Glacier drains the southwest side of the summit of Mount Baker a stratovolcano in the North Cascades of Washington, with a massive icefall feeding the lower valley terminus reach of the glacier. The icefall begins at 2200 meters and descends to 1600 meters. The glacier feeds the Middle Fork Nooksack River which provides water supply to Bellingham, WA. I first observed the Deming Icefall from the terminus area of the glacier in 1987. This visit demonstrated that it is not safe to hike to the terminus of this glacier. In 1990 we began annual observation of Deming Glacier. Each summer we monitor the adjacent Easton Glacier in detail including mass balance, while also taking several specific observations of Deming Glacier including terminus position, and accumulation between 2400-2700 m. This combined with mass balance assessment on Easton Glacier provides an annual assessment of the meltwater provided by the glacier to the Nooksack River system. During heatwaves the tributaries of the Nooksack fed by glaciers have had the impacts mitigated, while those without glaciers have seen significant temperature increase and discharge decrease (Pelto et al 2022).
Pelto and Brown (2012) identified a mean annual mass balance loss of -0.52 m/year from 1990-2010 on Mount Baker glaciers. From 2013-2021 the mass loss had more than doubled to -1.30 m/year. The declining mass balance is less pronounced above the icefall. The icefall transitions the glacier from the accumulation zone to the ablation (melt) zone at the bottom of the icefall. Above the icefall at 2400-2700 meters the average snow depth left at the end of the summer based on several thousand crevasse stratigraphy measurements from 1990-2013 had been 2.75 meters, from 2014-2021 the average depth has been 2.4 m.
The result of the declining mass balance of the entire glacier and the upper glacier will be glacier deceleration. The NASA Measures ITS_LIVE application uses feature tracking to determine glacier velocity. An examination of velocity change from the top of the icefall to the bottom on Deming Glacier from 2015-2022 indicates deceleration at the three points within or below the icefall, but no change at the top of the icefall. At the top of the icefall red X velocity has declined ~20%. In the middle of the icefall, green X, velocity has also declined ~20% since 2017. Near the base of the icefall, orange X, velocity has a chaotic signal lacking a clear trend. Below the icefall at the blue X, velocity has declined by ~20-30%. The resulting reduction in flux to the terminus will continue the rapid retreat. Pelto and Brown (2012) measured a 360 m retreat of Deming Glacier from 1979-2009, ~20 m/year. From 1979-2021 the glacier has retreated 725 m, with the rate of retreat from 2009-2021 of ~30 m/year.

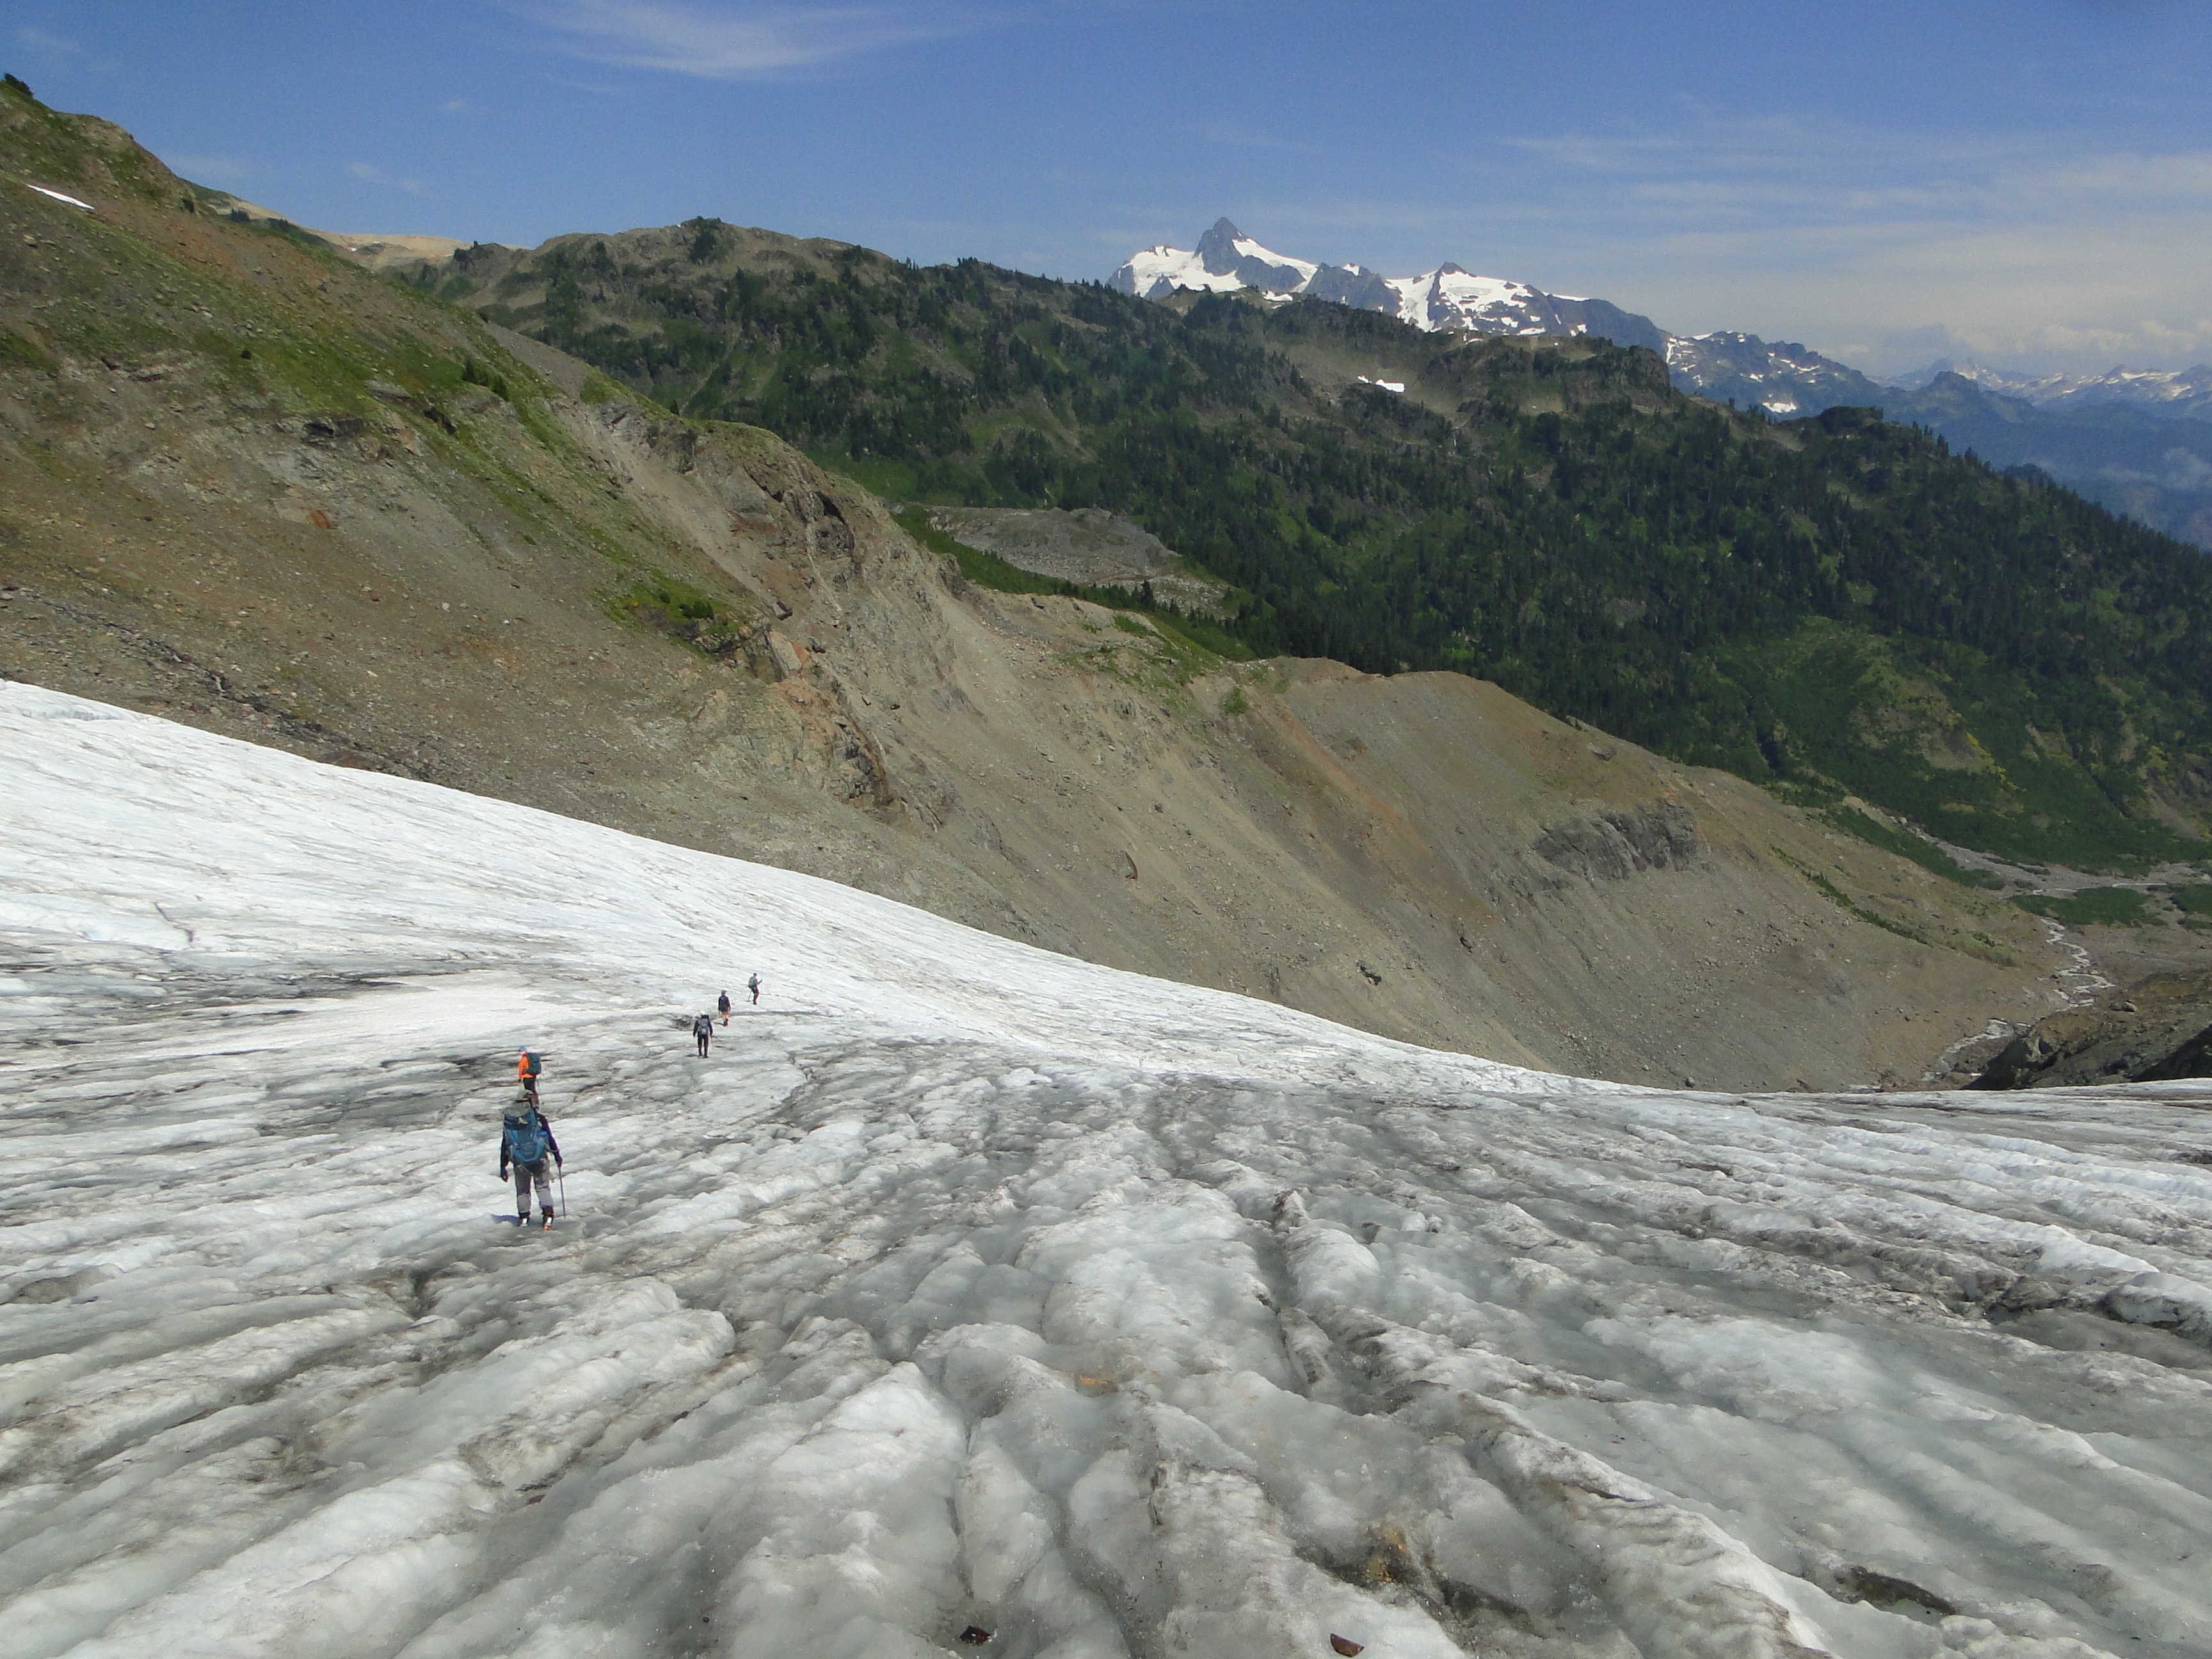
View of the Deming Glacier from terminus to top of icefall in 2019. Jill Pelto at left, Abby Hudak and Mauri Pelto at right. X’s mark the velocity locations, Point A ties this to the upper glacier view, red arrow is the 1987 terminus location.
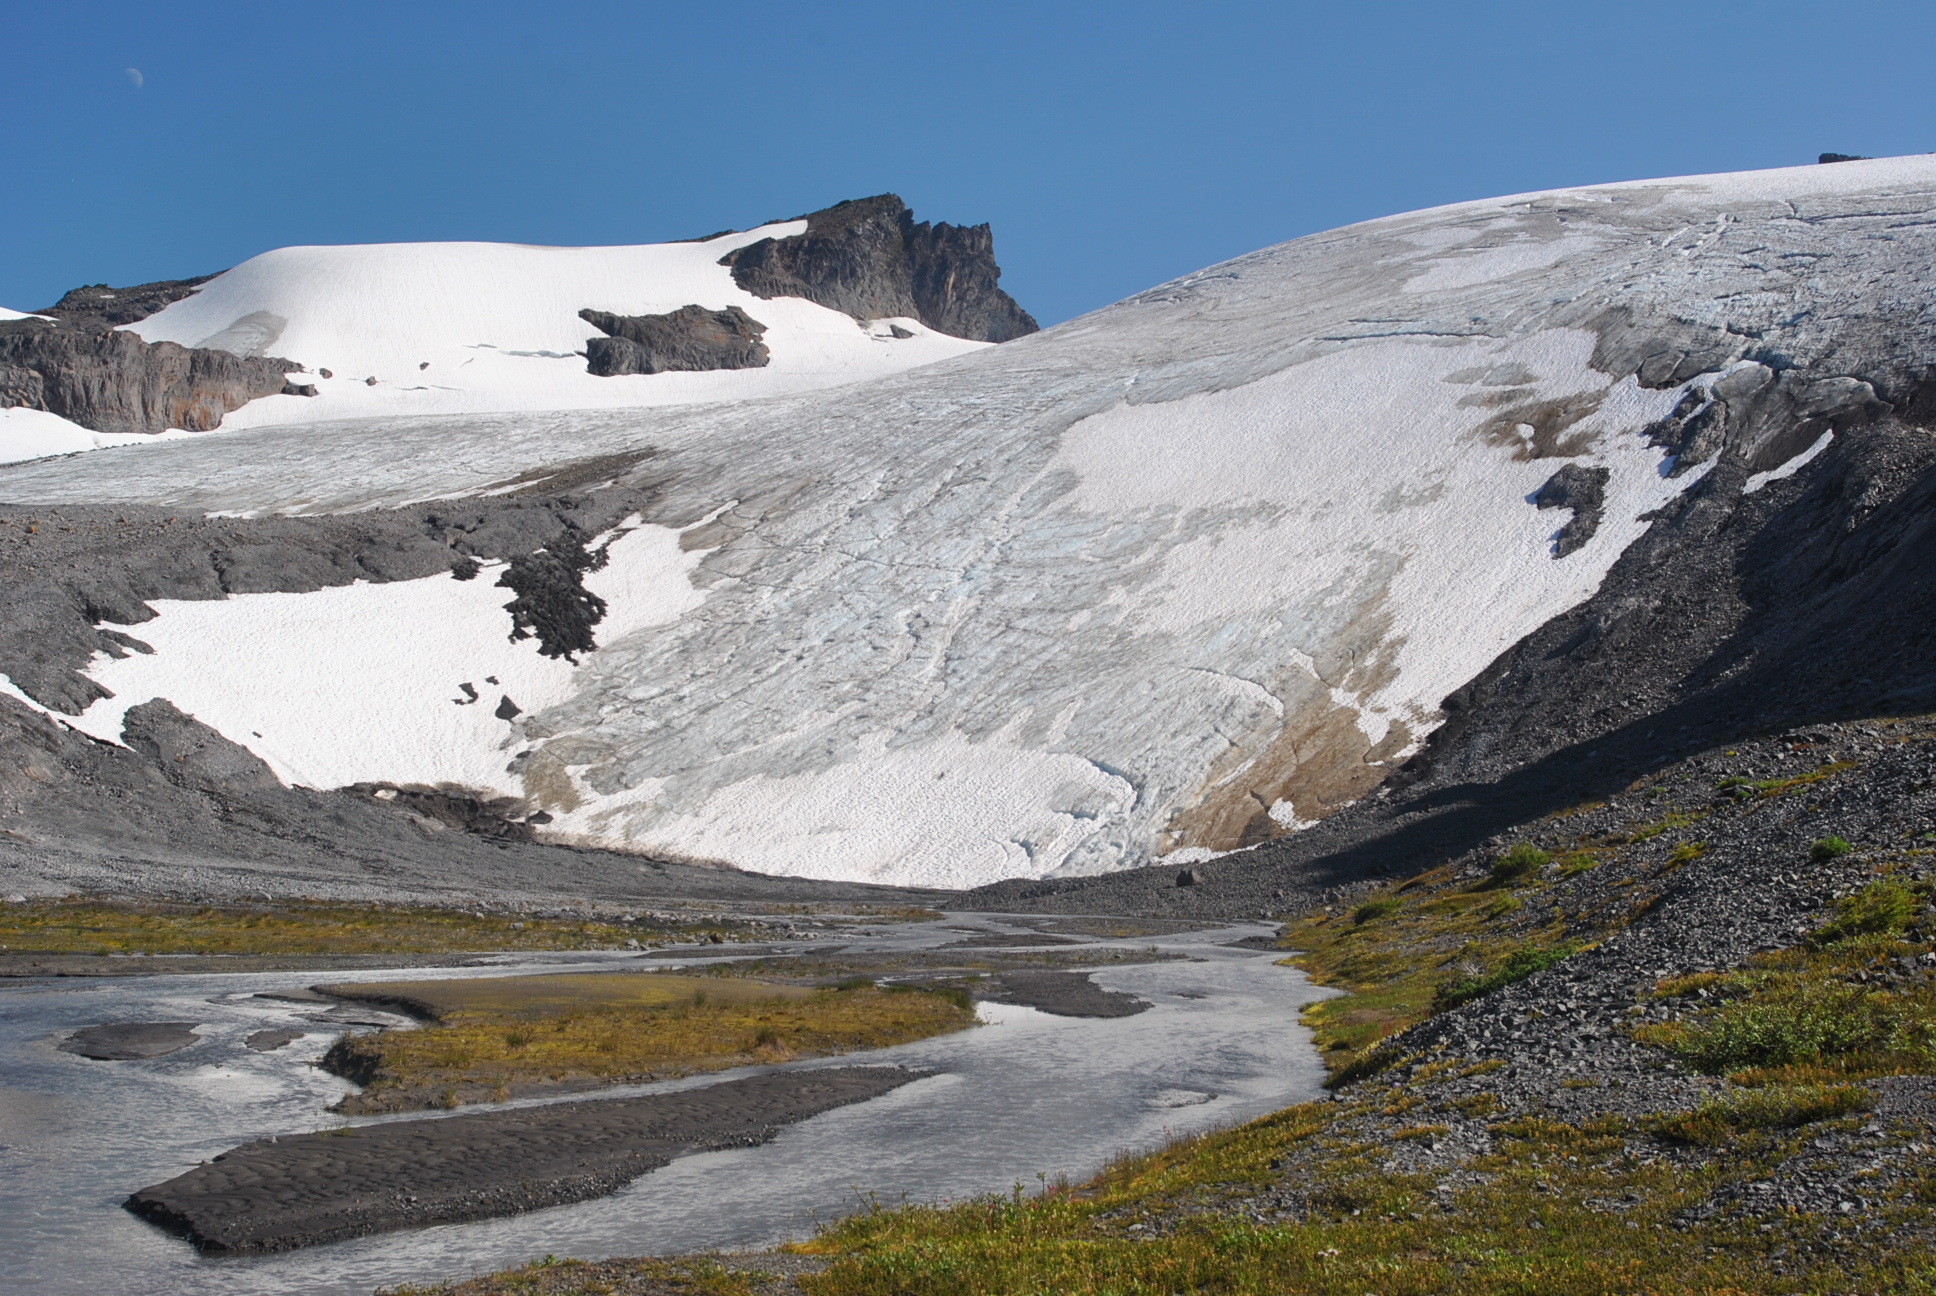
The icefall sweeps around a bedrock with an east and a west arm splitting above and rejoining below the knob.

The Deming Glacier from the top of the icefall to the summit of Mount Baker in 2020.

In mid-August 2022 snowpack was particularly low right to the top of Deming Glacier. Comparison with 2020 which was an average year for the last decade, but still a significant mass balance loss.
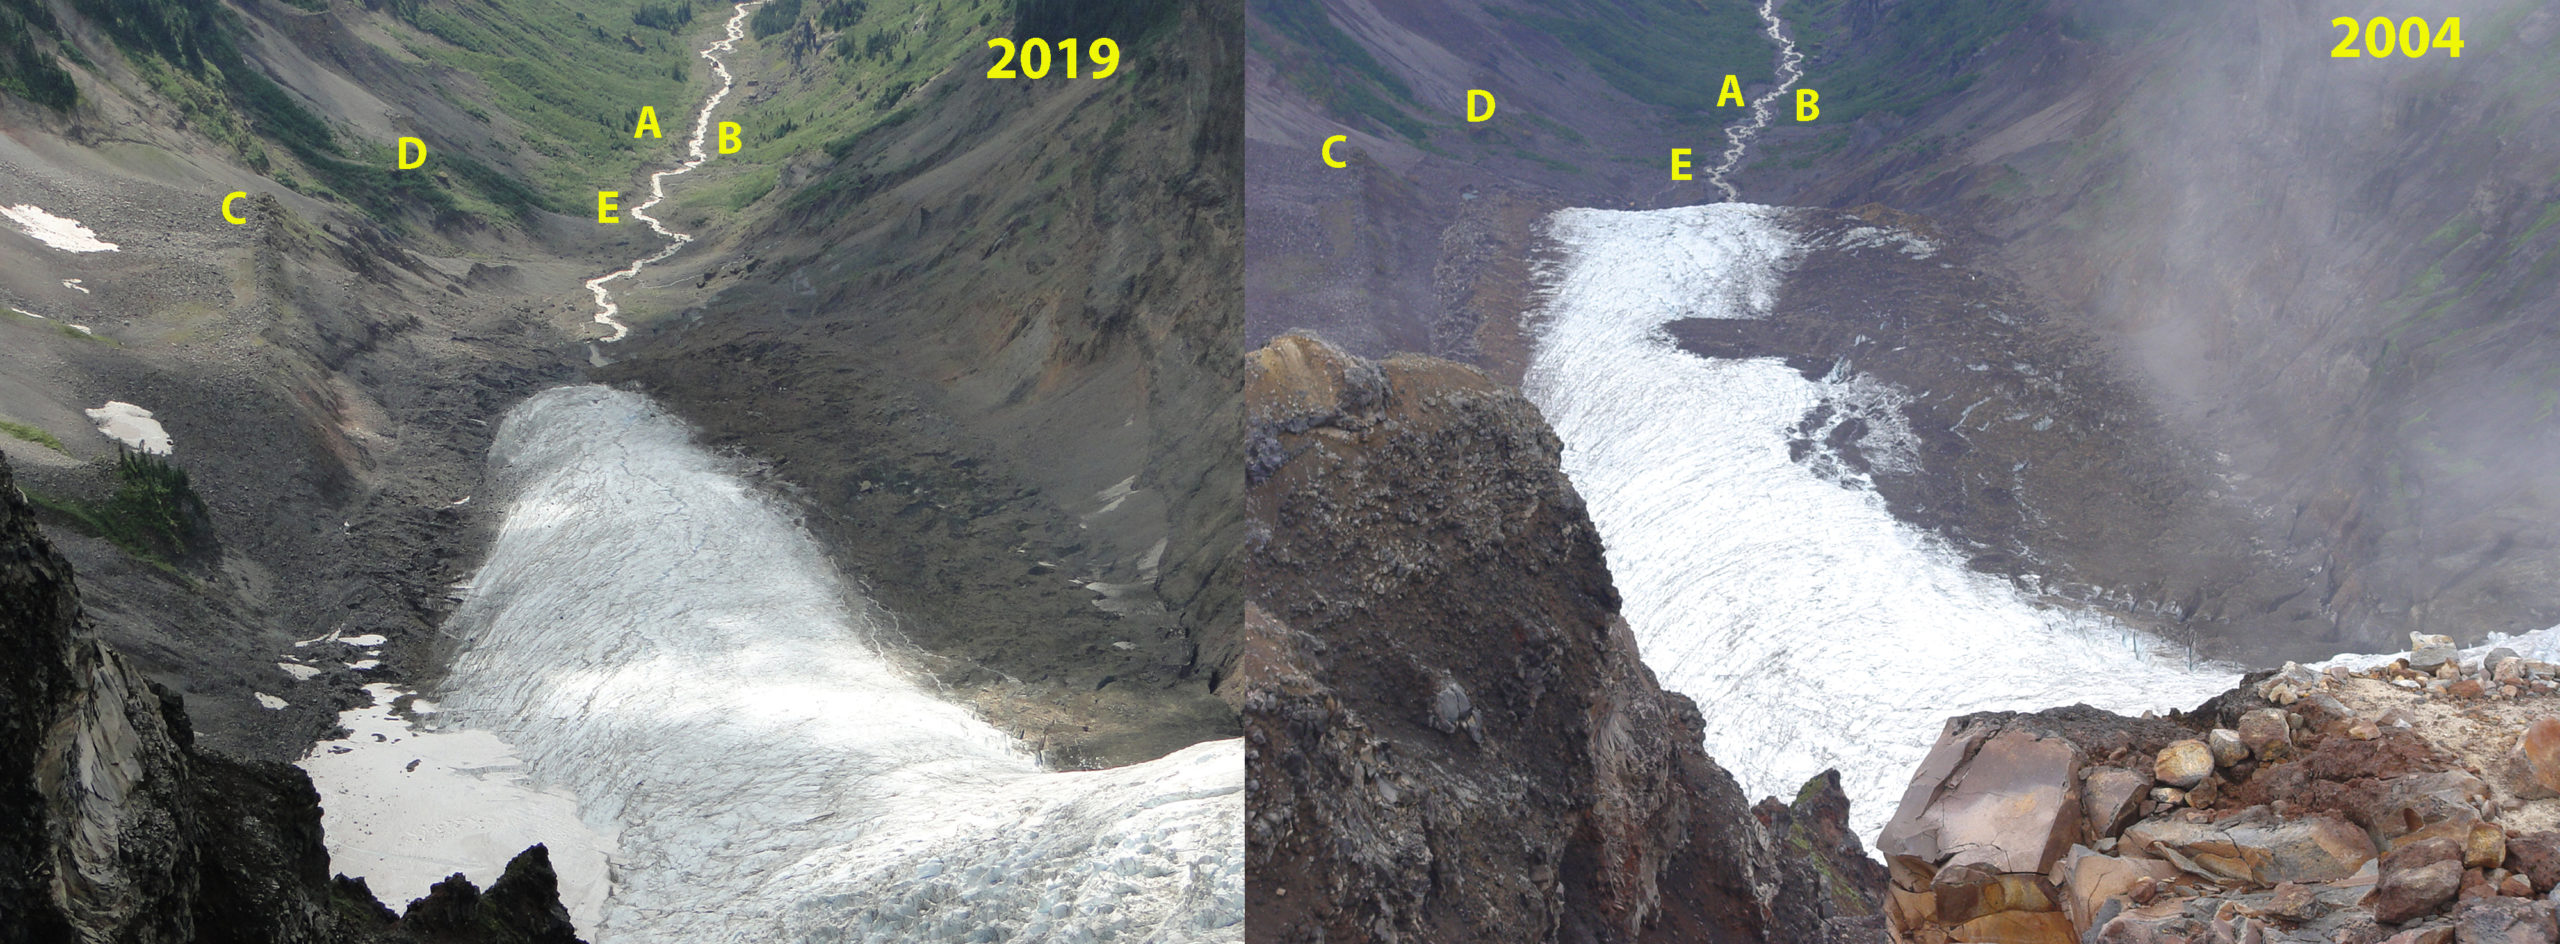
Terminus of Deming Glacier in 2004 and 2019 illustrating the ongoing retreat of the terminus, 725 m from 1979-2021.

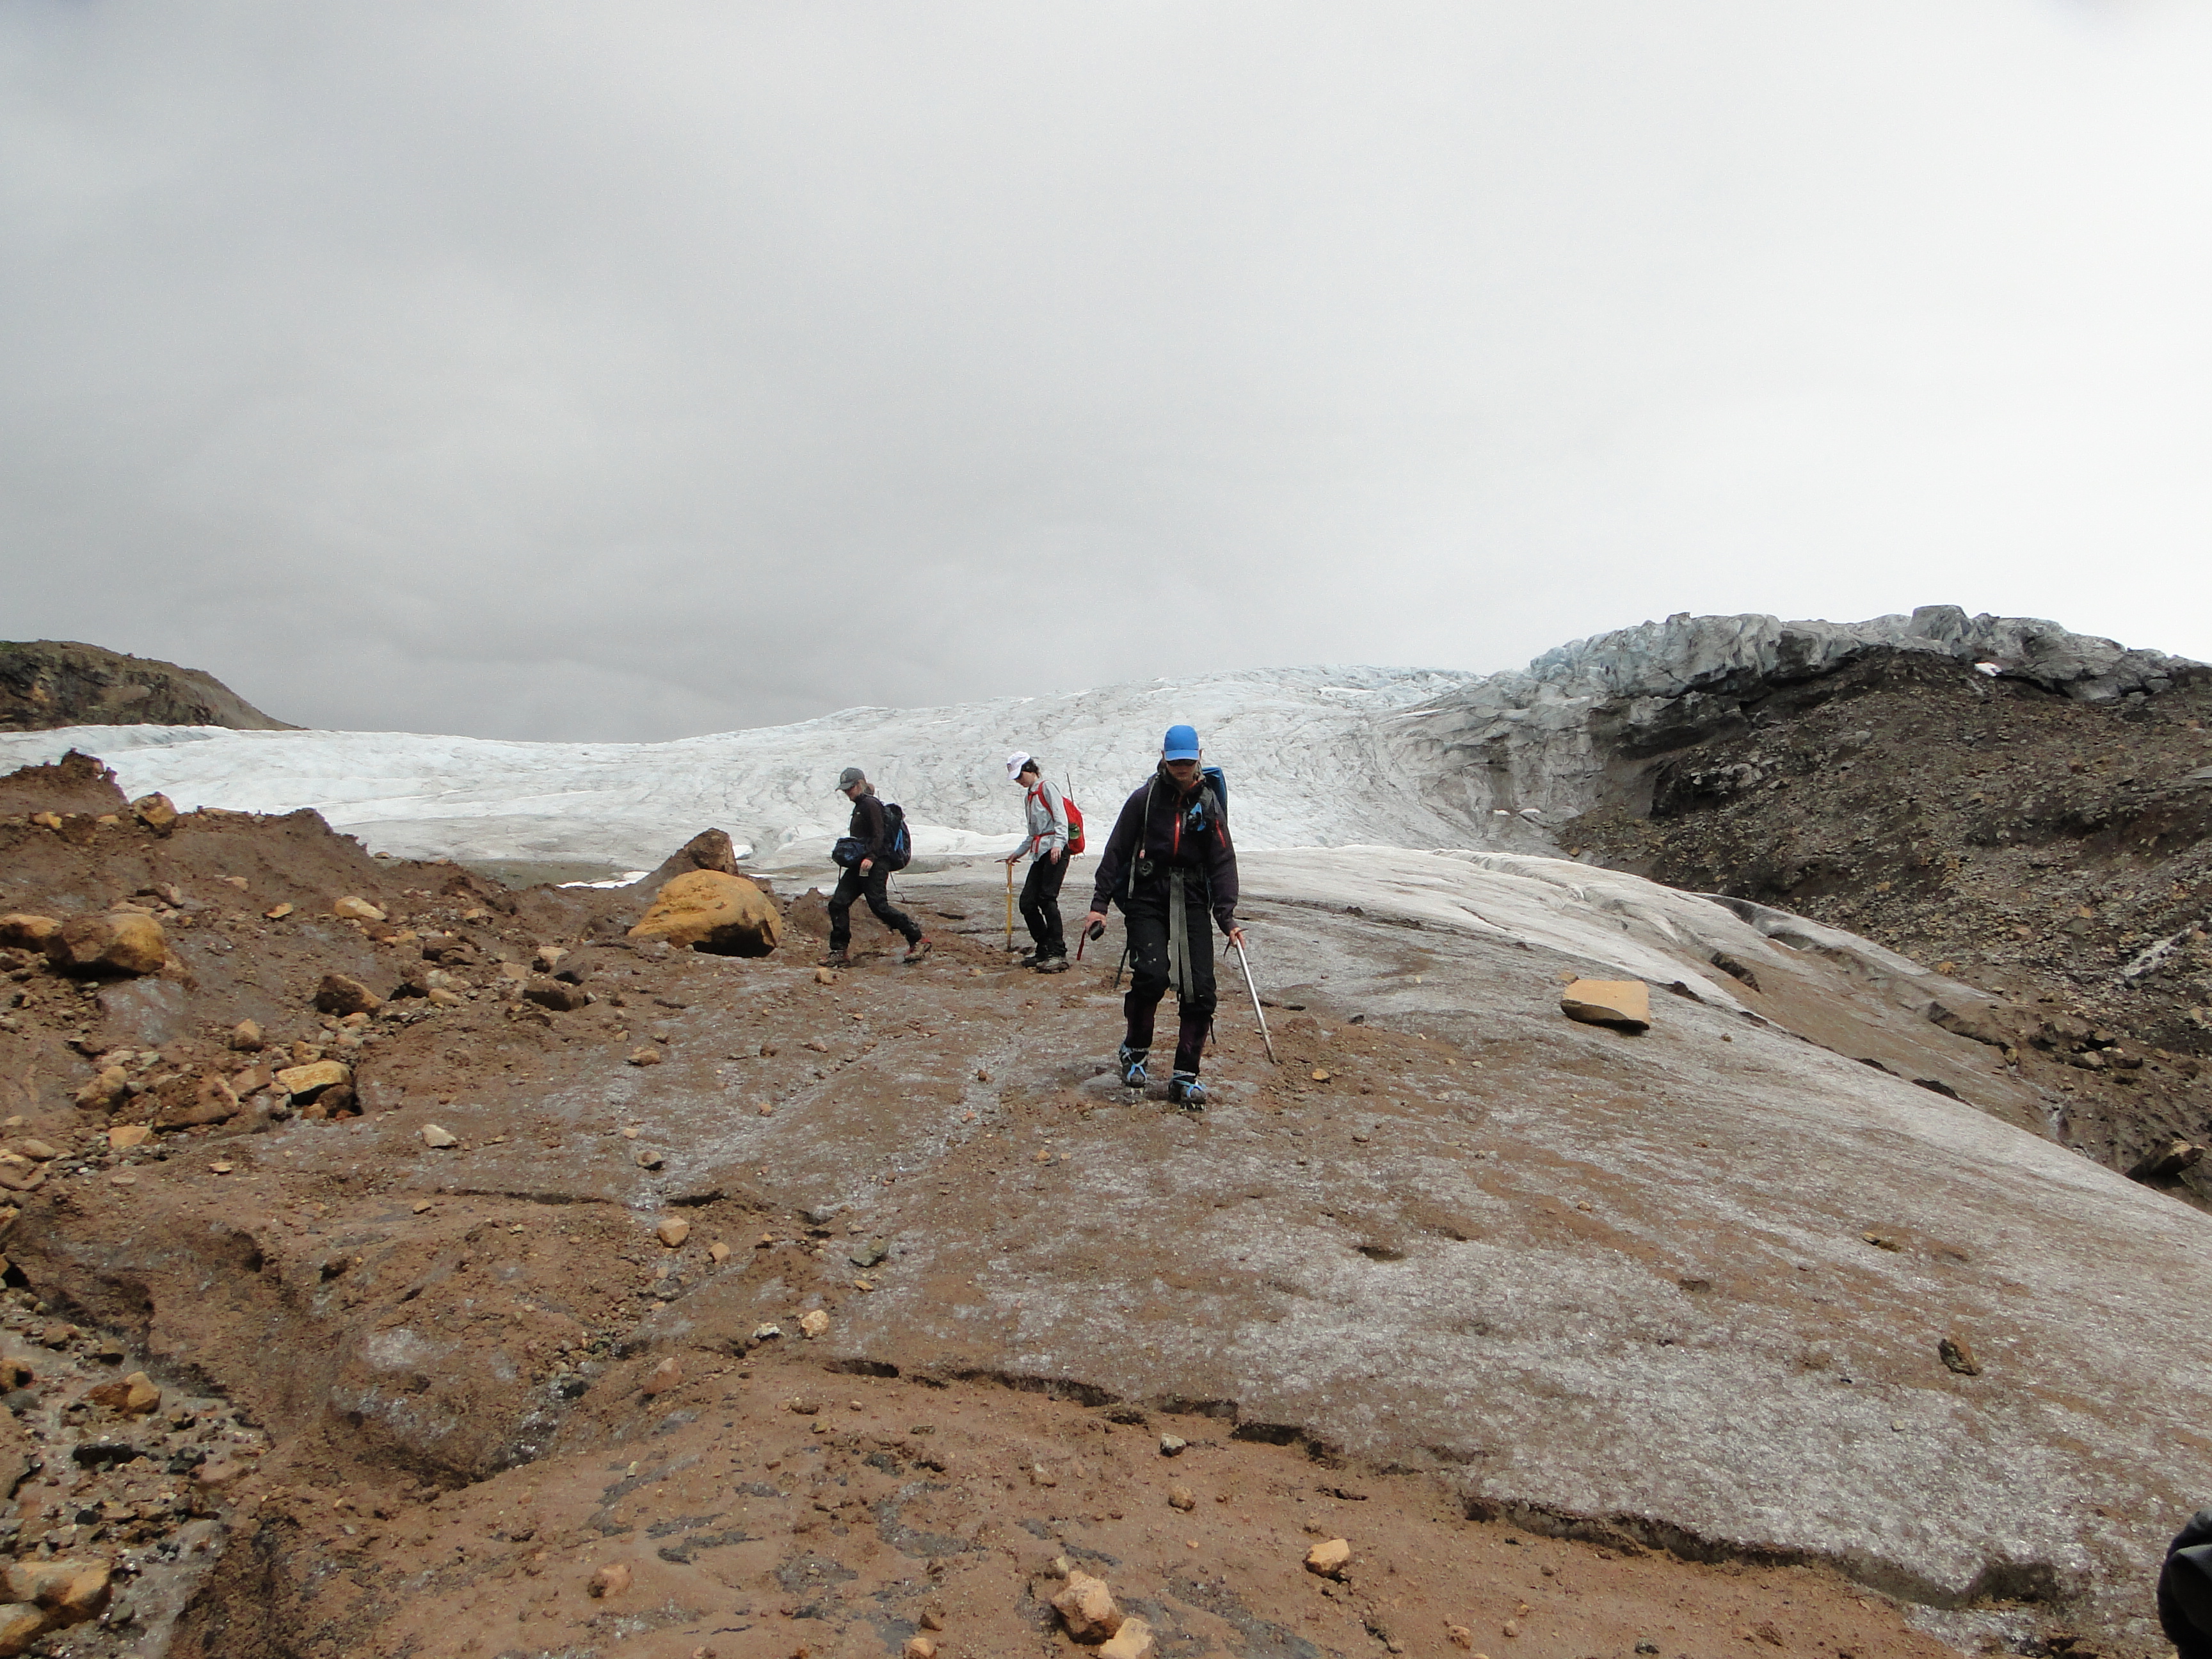
Jill Pelto measuring Crevasse depth and snowpack thickness in Crevasse at 2500 m on Deming Glacier.