Southeast Glacier #3, Devon Ice Cap, Canada Recent Retreat

Southeast #3 Glacier, Devon Ice Cap in July 9, 2016 and August 29, 2021 Sentinel 2 images of the lower 10 km  showing three supraglacial streams S1, S2 and S3 and the outlet plumes of each stream at Point 1-3. The yellow line is the 2016 margin.

The southeast sector of the Devon Ice Cap, Devon Island, Nunavut has three tidewater outlet glaciers Southeast Glacier #1, #2 and #3.  Van Wychen et al (2017) indicate the dynamic discharge of the three at .06-.07 Gt per year, all three glaciers have been retreating during this period.  Southeast #3 is between 0.01 and 0.02 Gt per year.  Sharp et al (2011) note that increasing summer temperatures has led to increased mass loss on Devon Ice Cap. Here we examine retreat and the supraglacial stream networks using Landsat and Sentinel 2 imagery.

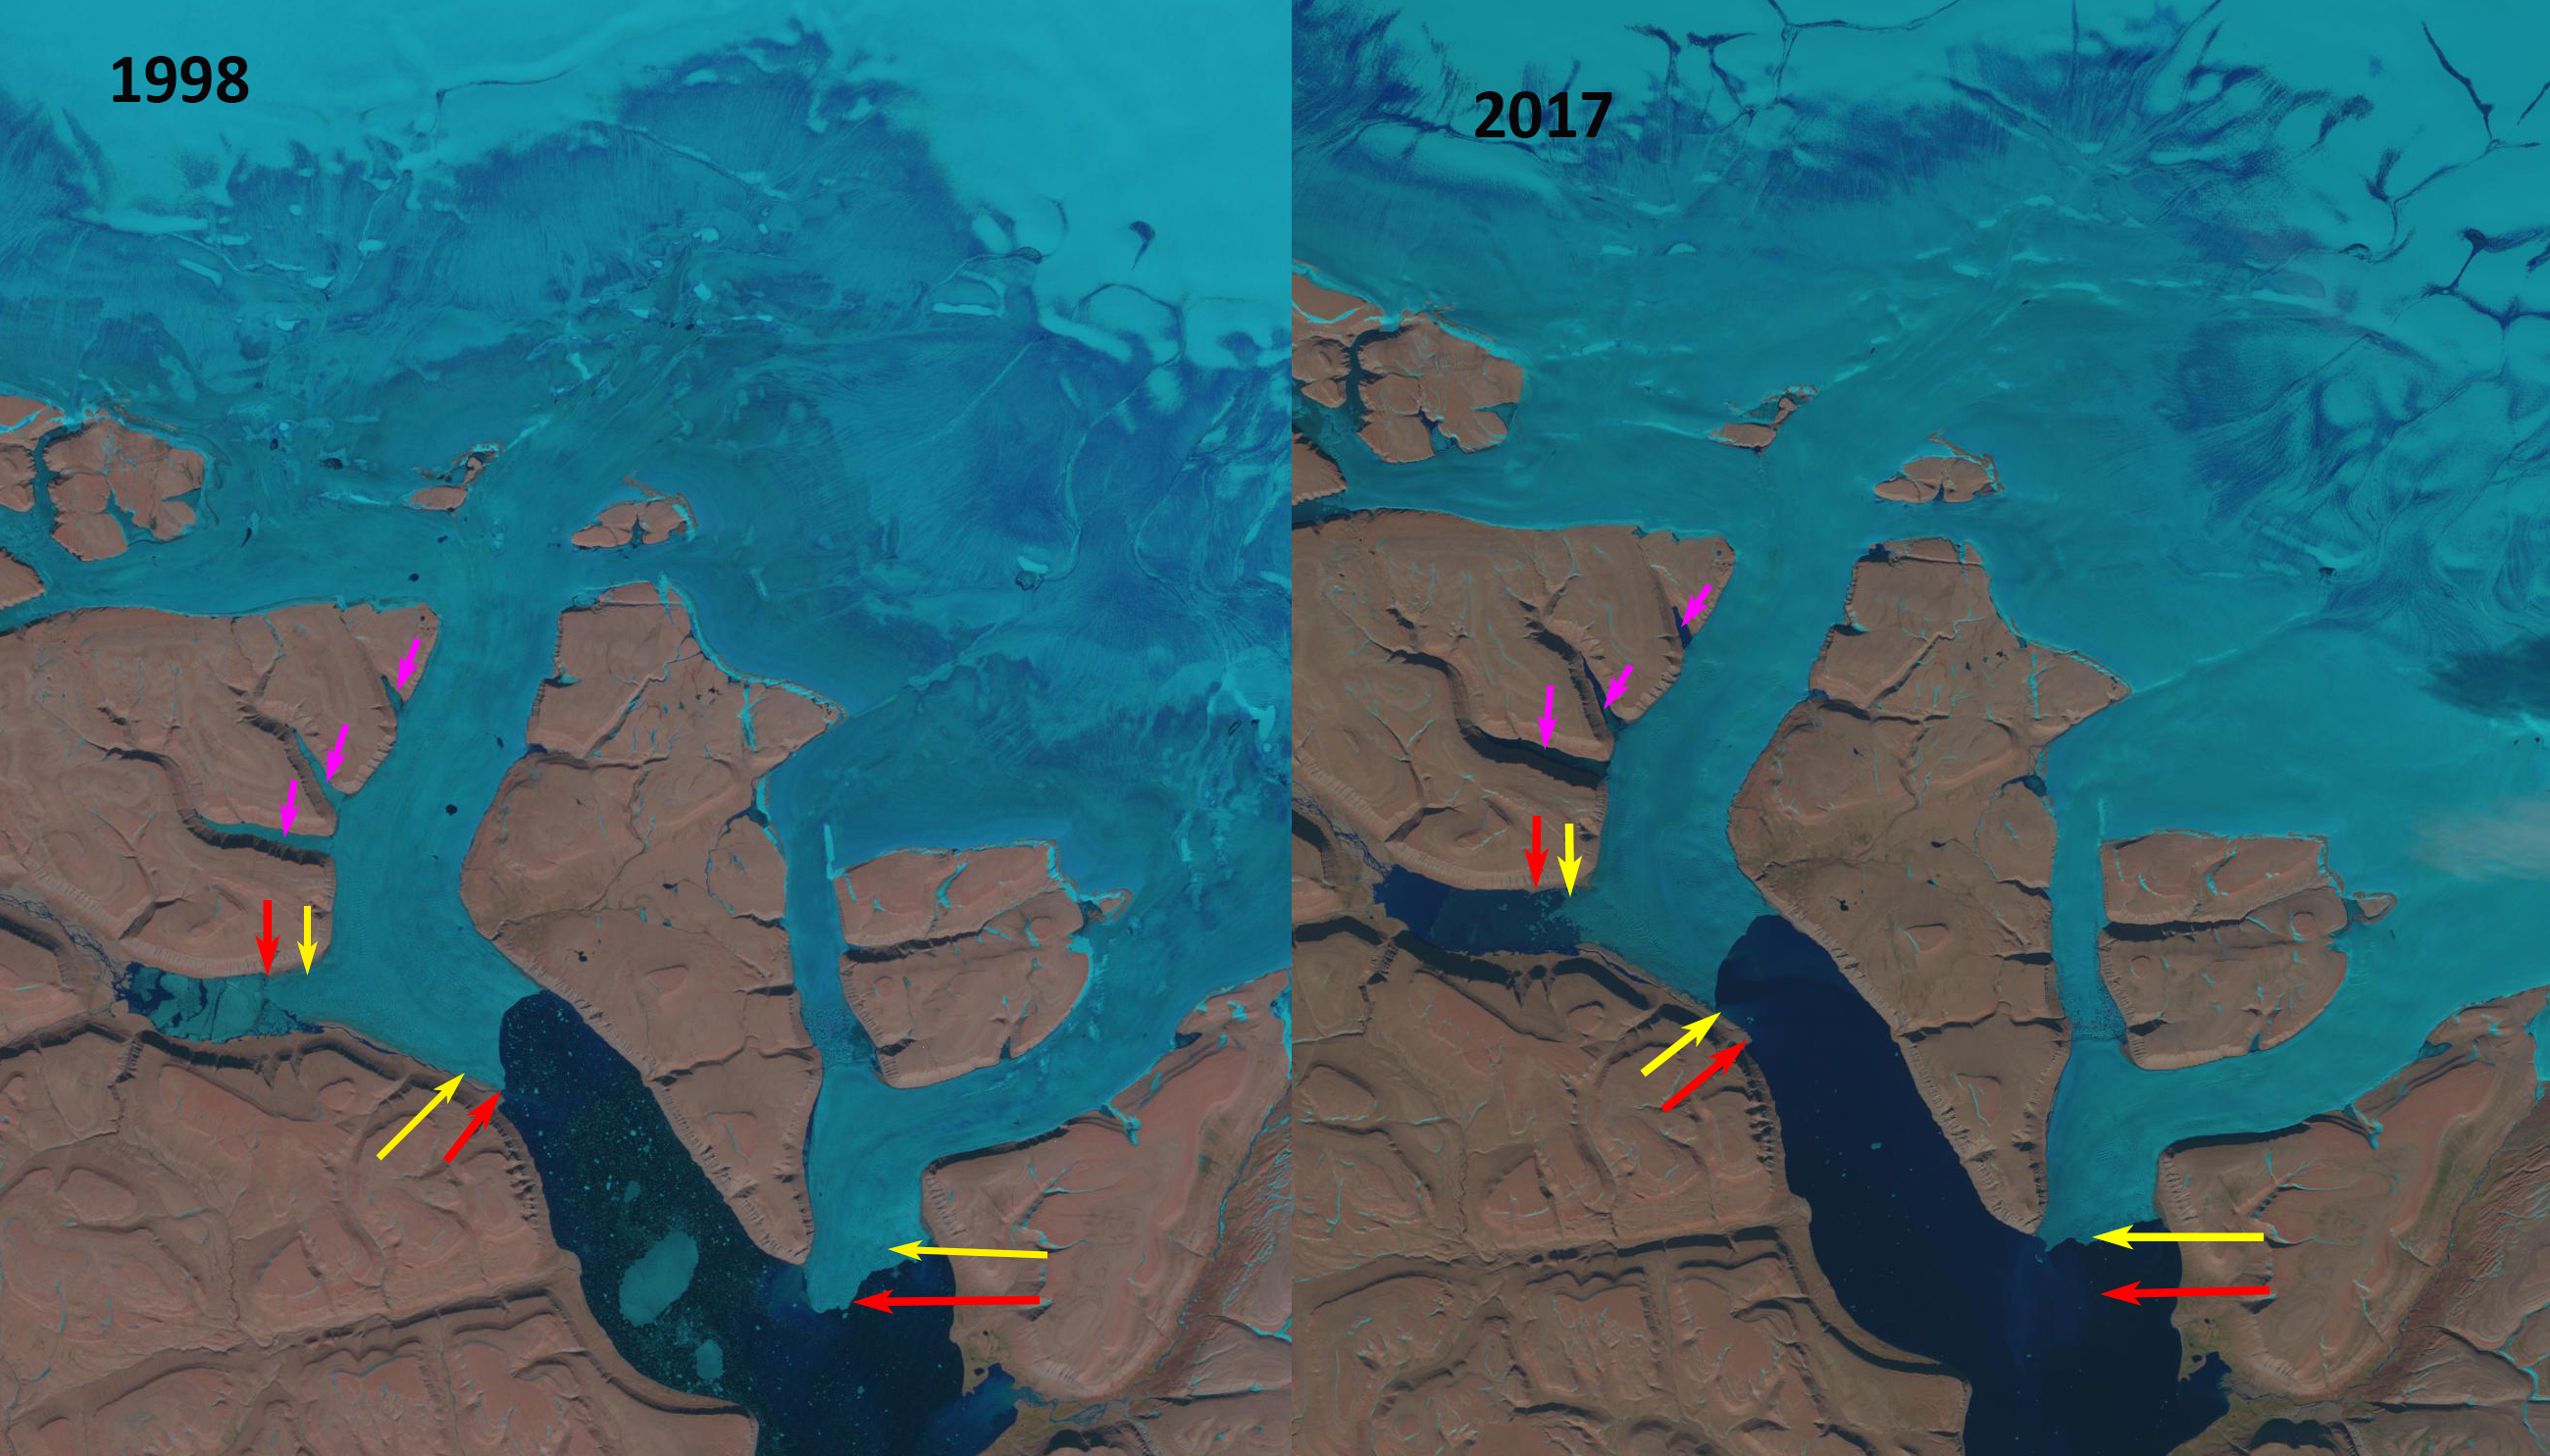
In 2002 the calving front of Southeast #3  Glacier extended north from with five distinct peninsulas of ice. The retreat by 2016 was more pronounced on the north south oriented southern portion of the front than the northwestern part.  From 2016 to 2021 it is evident that the glacier front has receded, particularly at the prominent ice peninsulas evident in 2016. The retreat averages 600 m across the 5 km wide tidewater front seen above from 2016-2021. This is an addition to the  1200 m retreat from 2002-2016, while the northwestern section retreated ~500 m during the 2002-2021 period. S1, S2 and S3 indicates supraglacial stream drainages that exit the glaciers at Point 1-3 respectively.  The plumes of sediment from these streams is evident in the July 24, 2020 image below from each of these surface outlet streams. The plumes are evident in the July 2016 image, but no the late August image of 2021.  The lack of plumes on 8-29-2021 indicate the lower melt rates that are typical of late August. The stream network has become more prominent as melt rates have led to greater flow and more incising into the ice.

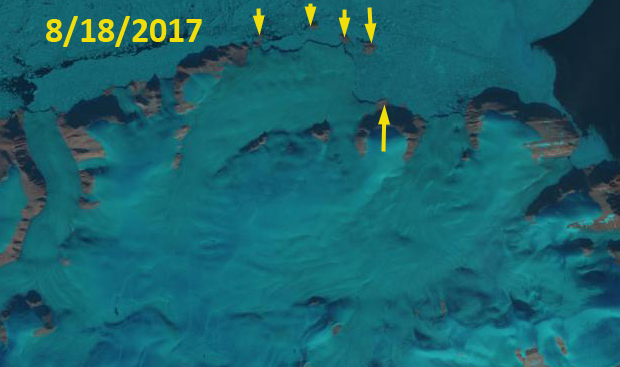
This retreat has occurred during the same period that was noted as generating three new islands in 2018 on the northeast margin of the Devon Ice Cap. Noel  et al (2018) observe that this is part of a trend seen across Canadian Arctic ice caps have been losing mass for decades and that mass loss accelerated in 1996.


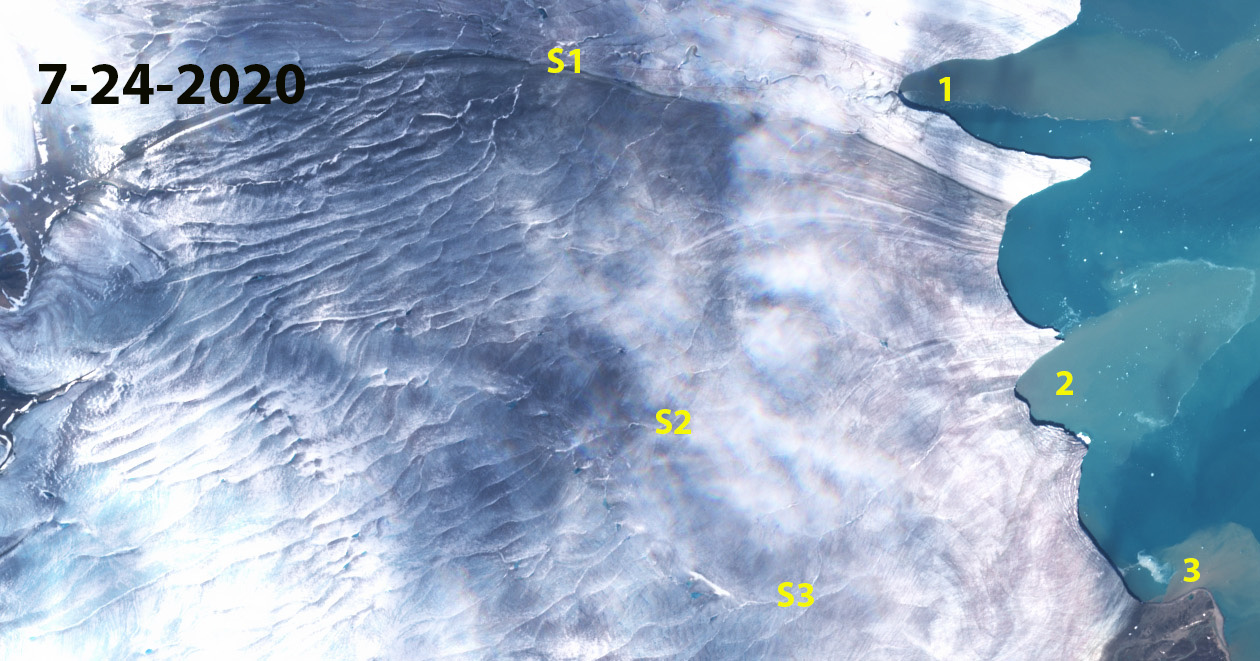
July 24, 2020 Sentinel 2 image of the lower 10 km of Southeast #3 Glacier showing three supraglacial streams S1,S2 and S3 and the outlet plumes of each at Point 1-3.

Southeast #3 Glacier in 2002 and 2021 Landsat images. Yellow dots indicate the 2002 margin of the glacier.


Croker Bay Glacier, Nunavut Canada Poised for Further Retreat

Croker Bay Glacier, Devon Ice Cap, Nunavut in Landsat images from 1998 and 2017.  The red arrows indicate the 1998 terminus location, yellow arrows the 2017 terminus location.  The pink arrows indicate three inlet on the north glacier. 

Croker Bay Glacier drains the southwest quadrant of the Devon Ice Cap, Nunavut.  A study by Van Wychen et al (2012) focused on velocity changes of the Devon ice Cap. They identify that Croker Bay Glacier has two main termini, the south and north terminus and that the region of higher velocity +100 m/year for these glaciers penetrates further into the ice cap than other outlets.  This is on the opposite side of the ice cap from where three new islands have emerged due to retreat.

In 1998 the south terminus of Croker Glacier extends 1.2 km beyond the tip of the peninsula on its west margin. In 1998 the northern terminus has both an east and a west terminus. The west terminus extends up a side valley.  The pink arrows indicate three side channels into which the glacier flows into the southern two.  The transient snowline in 1998 is ~1100 m, with the crest of the ice cap at 1800 m.  In 2001 there is limited change and a recent snowfall has covered most of the glacier. By 2017 the southern terminus has retreated to approximately parallel with the western margin peninsula, a distance of 1700 m.  The northern terminus has retreated 1400 m on the eastern side and 1100 m on the western side. The result is a much thinner ice connection reaching the southern side of the Croker Bay fjord. The transient snowline is high at ~1100 m again.  The 2018 image is from 2018. The snowline has already begun to decline due to a late summer snow event. There are a number of small icebergs in Croker Bay, particularly trapped in front of the western most terminus indicating continued calving retreat.  The observations here are a local example resulting from the ongoing mass losses  found on Canadian Arctic ice caps that have been losing mass for decades and that mass loss accelerated in 1996,  Noel  et al (2018).  This has led to widespread area losses.  White and Copland (2018) quantify the change in the areal extent of 1773 glaciers on Northern Ellesmere Island from 1999 to 2015. They found regional glacier area decreased by ∼6%, with not a single glacier increasing in areal extent.

Croker Bay Glacier, Devon Ice Cap, Nunavut in a Landsat image from 2001 and a Sentinel image from 2018.  The red arrows indicate the 1998 terminus location, yellow arrows the 2017 terminus location.  The pink arrows indicate three inlet on the north glacier. 

Velocity Map of Devon Ice Cap, which is Figure 1 from Van Wychen et al (2012)

Three New Islands Released from Devon Ice Cap, Canada

The northern coast of the Devon Ice Cap with Lady Ann Strait at the top in a 2000 and 2017 Landsat image indicating the development of islands at Cape Caledon, at yellow arrows. See map below. 

The Devon Ice Cap on Devon Island in the Canadian Arctic ice cap’s area has an area of 15,000 km², with a volume of 3980 km³. The ice cap has been the focus of an ongoing research program led by the University of Alberta Arctic and Alpine Research Group. The mass balance from 1960-2009 was cumulatively -5.6 m, with nine of the eleven most negative years occurring since 1998.  Noel  et al (2018) update this observation noting that Canadian Arctic ice caps have been losing mass for decades and that mass loss accelerated in 1996. This followed a significant warming (+1.1∘C), which increased the production of meltwater. This has led to widespread area losses.  White and Copland (2018) quantify the change in the areal extent of 1773 glaciers on Northern Ellesmere Island from 1999 to 2015. They found regional glacier area decreased by ∼6%, with not a single glacier increasing in areal extent.

East of Belcher Glacier, a large retreating tidewater outlet of the Devon Ice Cap, maps indicate a glacier terminating at Cape Caledon, a series of rocky Points on the southern side of the Lady Ann Strait.  Today the Cape Caledon Glacier no longer reaches these rocky Points that have now become islands.  Here we examine Landsat images from 2000 to 2018 to illustrate the changes.

In 2000 the Cape Caledon Glacier terminates along its north side on three rocky points, yellow arrows, while the eastern margin is pinned on the northeastern most of the Points and extends nearly due south to another rocky Point, yellow arrow.  In 2002 little has changed on the northern or eastern margin.  By 2017 the glacier has separated from the three rocky Points on the northern margin, each is now a new island.  The mid-August 2017 image indicates that the snowline is particularly high, with none of the Cape Caledon Glacier in the accumulation zone.  This supports what has been observed in terms of significant changes in the nature of the firn due to increased meltwater infiltration in the region (Gascoin et al 2013). The eastern margin has retreated along most of its length, but remains attached to the rocky Point on the southern margin. In 2018 the islands remain separated from the glacier, but have some sea ice still around them.  The eastern margin that had terminated at the northeast most rocky Point has retreated from 500-700 m along nearly the entire front, except for the very southern margin. The generation of new islands is a process occurring across the Arctic as glaciers recede (Ziaja and Ostafin, 2018).

The northern coast of the Devon Ice Cap with Lady Ann Strait at the top in a 2002 and 2018 Landsat image indicating the development of islands at Cape Caledon, at yellow arrows. 

Map of Cape Caledon on the north coast of the Devon Ice Cap

The northern coast of the Devon Ice Cap with Lady Ann Strait at the top in a 2017 Landsat image indicating the development of islands at Cape Caledon, at yellow arrows, surrounded by some sea ice. 


Devon Ice Cap Northern Outlet Glacier Retreat

The Devon Ice Cap on Devon Island in the Canadian Arctic ice cap’s area has an area of 15,000 km2, with a volume of 3980 km3. The ice cap area decreased by 600 km2 (4%) between 1960 and 2000 (Sharp et al, in press). The ice cap has been the focus of an ongoing research program led by the University of Alberta Arctic and Alpine Research Group and Natural Resources Canada in Ottawa. The mass balance from 1960-2009 has been cumulatively -5.6 m, with nine of the eleven most negative years occurring since 1998. The Devon Ice Cap’s negative balance has been due to warming and greater ablation, as the upper part of the glacier has seen some increase in accumulation, which has been more than offset by increased melting ( Sharp et al, 2011). Belcher Glacier is the the principal outlet glacier calving up to 40% of the total iceberg volume from the ice cap. Belcher Glacier and its neighbor Unnamed5 Glacier are the focus of this post. A recent study by Van Wychen et al (2012) focused on velocity changes of the Devon ice Cap. The fastest velocities of 200-250 meters/year are at the front of the Belcher Glacier. A comparison between Belcher Glacier’s velocity from the 1991-2000 period and 2009 indicate that Belcher Glacier velocity has declined at the glacier front recently, which has likely aided the glacier in slowing retreat, an excellent time lapse gives a sense of the dynamics. Here we used 1998 (top), 2008 (second image) and 2010 Landsat imagery(bottom image) combined with Geoeye imagery (third image)from 2010 to identify changes in glaciers adjacent to the Belcher Glacier. To the north of Belcher Glacier a small nunatak is evident at the red arrow. This nunatak is 500 meters inland from the terminus in 1998 and is at the terminus in 2010. The orange arrow indicates the terminus of a land terminating glacier which in 1998 reached a small inlet in the peninsula emerging from under the ice cap. By 2010 the glacier has pulled back 250 meters from this inlet. The yellow arrow indicates the terminus change of Unnamed5 Glacier. The glacier has pulled back to the base of a zone of intense crevassing between 1998 and 2010 a retreat of 500 m. The next glacier to the east in 1998 has a 600 meter wide margin in the ocean. By 2010 the glacier front is in contact with the ocean for less than half this length. . Further to the east from Belcher and Unnamed5 Glacier there is a set of three islands that are losing contact with the Devon Ice Cap between the 1998 Landsat and 2009 Geoeye imagery, violet arrows 2009. The losses paralell those from other Canadian Arctic glaciers, Penny Ice Cap.