Lumding Glacier Rapid Retreat, Nepal 1992-2016

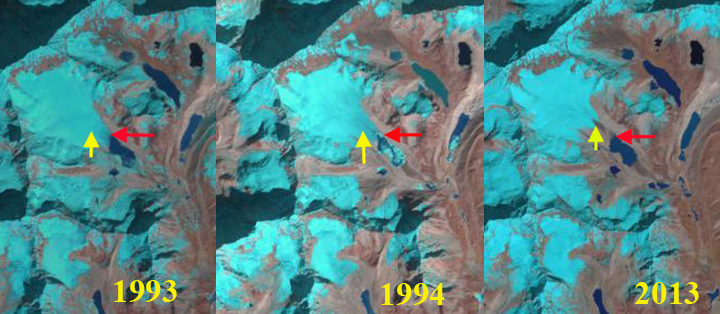
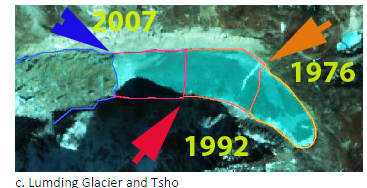
Landsat comparison of Lumding Glacier terminating in Lumding Tsho. Red arrow on each Landsat image indicates 1992 terminus and yellow arrow 2016 terminus location.

Lumding Glacier, Nepal terminates in Lumding Tsho, a proglacial lake, in Dudh Khosi Valley in the Mount Everest region of Nepal. This lake poses a hazard for a glacier lake outburst flood in the Dudh Khosi valley. The lake expansion results from retreat of the Lumding Glacier. International Centre for Integrated Mountain Development (ICIMOD) study examined the changes in Lumding Tsho from 1962-2000 and found the lake grew from 0.2 km2 in 1962 to 0.77 km2 in 2000. ICIMOD has an ongoing specific focus on assessing glacier lake outburst flood potential. The lake growth was the result of a retreat of 40 meters/year from 1976-2000 and 35 meters/year from 1962-2007, as noted in figure below from Bajracharya  & Mool (2009). Here we update the changes to 2016 using Landsat imagery.

The lake begins at the end of the heavily debris covered Lumding Glacier draining east from Numbur Himal . Red arrow on each Landsat image indicates 1992 terminus and yellow arrow 2016 terminus location. The lake was 1675 meters long in 1992, 1950  meters long in 2000, 2350 meters long in 2009 and 2800 meters in 2016. This 1100 m retreat in 25 years is a retreat rate of 45 meters/year. The lake at 2.8 km in length now has an area of over 1 square kilometer. The glacier is fed largely by avalanching off the flanks of Numbur, blue arrows. King et al (2017) noted a mean mass balance of all 32 glaciers examined in the Mt. Everest region from 2000-15 was  −0.52  water equivalent per year. The mean mass balance of nine lacustrine terminating glaciers, like Lumding Glacier, was 32 % more negative than land-terminating debris-covered glaciers.  An additional problem for the glacier in the future is the retreat of the terminus of the tributary glaciers that avalanche onto the lower Lumding Glacier. The yellow letter A in the 2016 Sentinel images indicates the retreat of a feeder glaciers, 300 m since 1992.  The lower section of the Lumding Glacier is heavily debris covered, noted best in Google Earth image, which insulates the underlying ice, reducing melting and retreat. This also indicates the avalanche source of much of the accumulating snow and ice. The increased distance to the feeding snow and ice slopes will reduce this input.  The two blue arrows indicate plumes of glacier runoff into the lake.  This glacier loss in mass driving the retreat is like that on Hinku Nup Glacier and Middle Lhonak Glacier

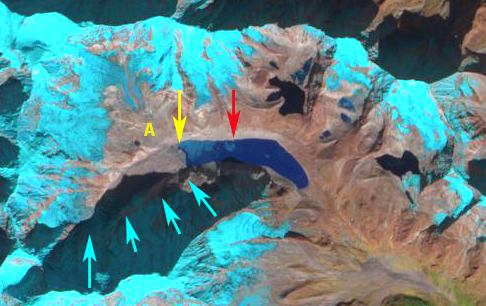
A 2016 Sentinel image of Lumding Glacier with avalanche paths shown by blue arrows, and retreating tributary above Point A.

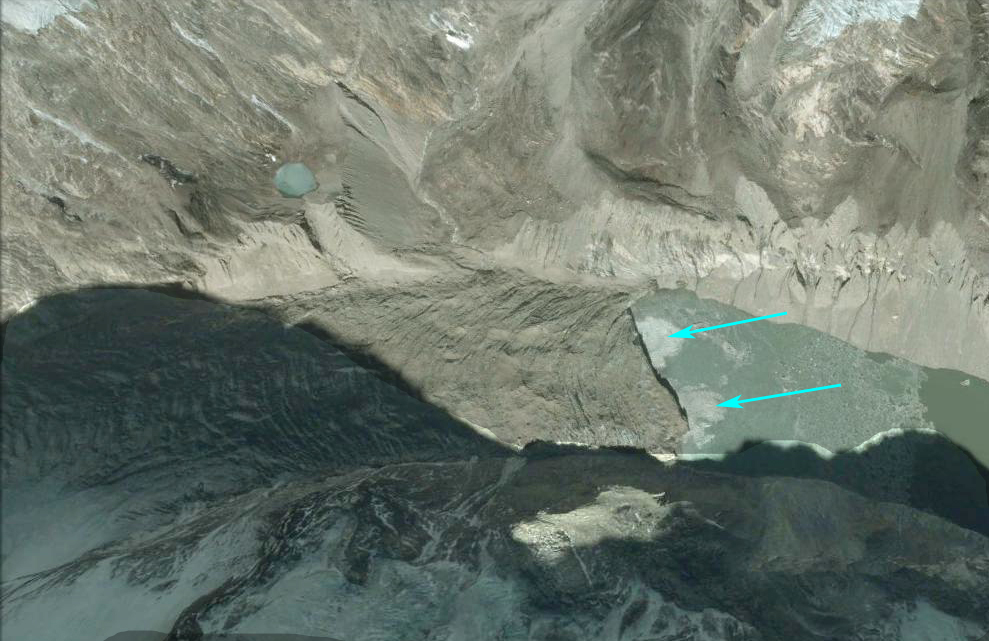
Google Earth image of Lumding Glacier front.  This illustrates the debris cover and also meltwater plumes entering lake. 

Hinku Nup, Nepal Downwasting Lake Development

Hinku Nup Glacier in November 2016 Sentinel 2 image.  Yellow arrows indicate three supraglacial lakes that have formed.  

Hinku Nup is a valley glacier in the Dudh Khosi basin in the Mount Everest region of Nepal.  The glacier is heavily debris covered in its lowest 4 km which is a low slope section extending from 5100-4900 m.  In 1992 Landsat images there are only small supraglacial lakes, less than 100 m across on the glacier surface.  In 2000 this remains the case on Hinku Nup proper, though a lake has formed at the terminus of a former tributary, northwest yellow arrow.  By 2013 a lake has formed at the junction of Hinku Nup and Hinku Shar Glacier and a lake near the terminus of the glacier.  By 2016 the terminus lake has expanded to a length of 600 m.  There are a series of lakes that appear ready to coalesce that will extend the lake to 800 m in length, smaller yellow arrow.  The lake at the junction of Hinku Nup and Hinku Shar is 200 m across in 2016.  The proglacial lake at the terminus of the former tributary to Hinku Nup is now 500 m wide and 400 m long.  The coalescing of the lakes near the terminus will lead to the formation of lake large enough to enhance melting and lead to calving.  This should lead soon to a rapid retreat of the terminus, such as occurred on nearby Lumding Glacier.  Glacier lakes have been inventories by ICIMOD, who found little change in glacier lake area from 2001 to 2009 but a sharp decrease in the number of lakes, primarily due to coalescing.  The lake here lacks the clearcut moraine dam that exists on Thulagi Glacier and typifies glaciers that pose a Glacier lake outburst flood hazard.

King et al (2017) noted a mean mass balance of all 32 glaciers examined in the Mt. Everest region from 2000-15 was  −0.52  water equivalent per year. The mean mass balance of nine lacustrine terminating glaciers was 32 % more negative than land-terminating, debris-covered glaciers.  This mass loss is what has been driving the widespread glacier retreat in the region.  Bajracharya and Mool (2009) noted the glaciers in the Mount Everest region retreated at a rate of 10–59 m/year from 1976-2009.

[ngg_images source=”galleries” container_ids=”9″ display_type=”photocrati-nextgen_basic_imagebrowser” ajax_pagination=”1″ template=”/nas/wp/www/sites/blogsorg/wp-content/plugins/nextgen-gallery/products/photocrati_nextgen/modules/ngglegacy/view/imagebrowser-caption.php” order_by=”sortorder” order_direction=”ASC” returns=”included” maximum_entity_count=”500″]

West Hongu Glacier Retreat-Ablation Extending into January, Nepal

hongo compare

Landsat comparison of West Hongu Glacier snowline, purple dots from October 2015 to January 2016. The red arrow indicates the 1993 active terminus location and the yellow arrow the 2015 active terminus location. 

West Hongu Glacier is a small glacier in the Dudh Khosi Basin of Nepal. The glacier drains the east side of Ama Dablam Peak. Shea et al (2015) noted that glaciers in the Dudh Khosi Basin of Nepal lost 16% of total volume and 20% of area from 1961-2007. Shea et al (2015), in an ICIMOD project, modeled future changes in glaciers with various climate scenarios, finding a minimum projected volume change by 2050 of −26 % and maximum of −70 %. This glacier is a short distance from Mera Glacier where mass balance is measured.  Both are summer accumulation type glaciers with 80% of annual precipitation occurring during the summer monsoon season. Salerno et al (2015)  found that the main and most significant increase in temperature is concentrated outside of the monsoon period, leading to more ablation favoured during winter and spring months, and year around close to the glacier terminus. The lake at the end of the glacier is unnamed and not listed as one of 20 lakes recorded as potentially unstable and warranting further investigation in Nepal (Ives et al., 2010). ICIMOD has continued to inventory and assess the hazards from glacier lakes and their capacity to induce outburst floods.  ICIMOD notes the area of the lake is 0.366 square kilometers.

Here we examine the snowline from fall into winter in 2015/16. Above is the comparison indicating the rise of the snowline from October into January. This has been a common occurrence in recent years, indicating that ablation though limited, continues in the post-monsoon into the mid-winter period. The snowline rises from 5550-5600 m in October to 5650-5700 m in January. Besides ongoing ablation into January, the high snowline illustrates the lack of significant accumulation at any elevation on the glacier in the post Monsoon period extending into January. The snowline remained high on Jan.20, 2016, but the image has considerable cloud cover. This tendency has been noted at Nup La-West Rongbuk Glacier, on the Nepal-China border, Chutanjima Glacier, China and Lhonak Glacier, Sikkim.

Below the active ice terminus change from 1993-2013 is noted.  The active ice ended on the shore of the lake in 1993, red arrow.  By 2013 the active ice has retreated 500 m from the lake, yellow arrow. There is still debris covered stagnant ice in this zone. The inactive ice is dissected by significant stream channels that cannot develop in an area of active ice. Some of the stream channels have cut to the base of the glacier.

hongu terminus

Comparison of active terminus location from 1993-2013 in Landsat images. The red arrow indicates the 1993 active terminus location and the yellow arrow the 2015 active terminus location.hongu glaceri terminus 2013

Terminus of West Hongu Glacier inn 2013. Yellow arrows indicate the stream channels cutting through the debris covered inactive ice.Map below indicates glacier ending in the lake.

west hongu map