Yelverton Glacier, Ellesmere Island Extensive Retreat and Sikussak loss 1999-2018

Yelverton Glacier (Y) and De Vries Glacier (D) in 1999 and 2018 Landsat images.  Red arrows and red dots indicate the 1999 terminus and yellow arrow the 2018 terminus.  Point M indicates the area of melange or sikussak, the boundary of this area is marked by orange dots. Purple dots mark the snowline.

Yelverton Glacier is an outlet glacier from an ice cap on Northern Ellesmere Island. White and Copland (2019) identified an 85% reduction in are of eight floating ice tongues in the Yelverton Bay area.  They further observed that many of the glacier including Yelverton lost a substantial area of melange that had protected the glacier fronts from contact with open water.  The melange is comprised of icebergs and mulit-year sea ice and is referred to as sikussak. Here we examine Landsat images from 1999-2018 to identify the retreat of Yelverton Glacier and the loss of sikussak.

In 1999, the sikussak extends to the end of the Yelverton Glacier inlet, while the glacier terminus is 4.5 km up the inlet.  De Vries Glacier terminates adjacent to the northern tip of the peninsula separating De Vries and Yelverton.  In 2000, there is no change in the terminus or sikussak, the snowline is at 900 m.  In 2002, the terminus region and sikussak remain unchanged, the snowline is again close to 900 m. By 2015, Yelverton Glacier has retreated to its grounding line.  The sikussak that had existed is gone. In 2018, the terminus is exposed to open water and has retreated 8 km since 1999, the snowline is at 900 m. The area of sikussak that had been 6 km long has not returned and persisted since it disappeared. Pope and Copland (2012) noted the loss of multi-year land fast sea ice in the region beginning in 2005 and concluding with total loss by 2010 driven by warming.  This same climate change has also driven the retreat of Trinity Wickeham Glacier and Devon Ice Cap that also released new islands.  The Canadian Arctic Islands have seen widespread glacier area/mass balance loss particularly during the last two decades ( Noël, 2018).

Yelverton Glacier (Y) and De Vries Glacier (D) in 2002 and 2015 Landsat images.  Red arrows indicate the 1999 terminus and yellow arrow the 2018 terminus.  Point M indicates the area of melange or sikussak. 

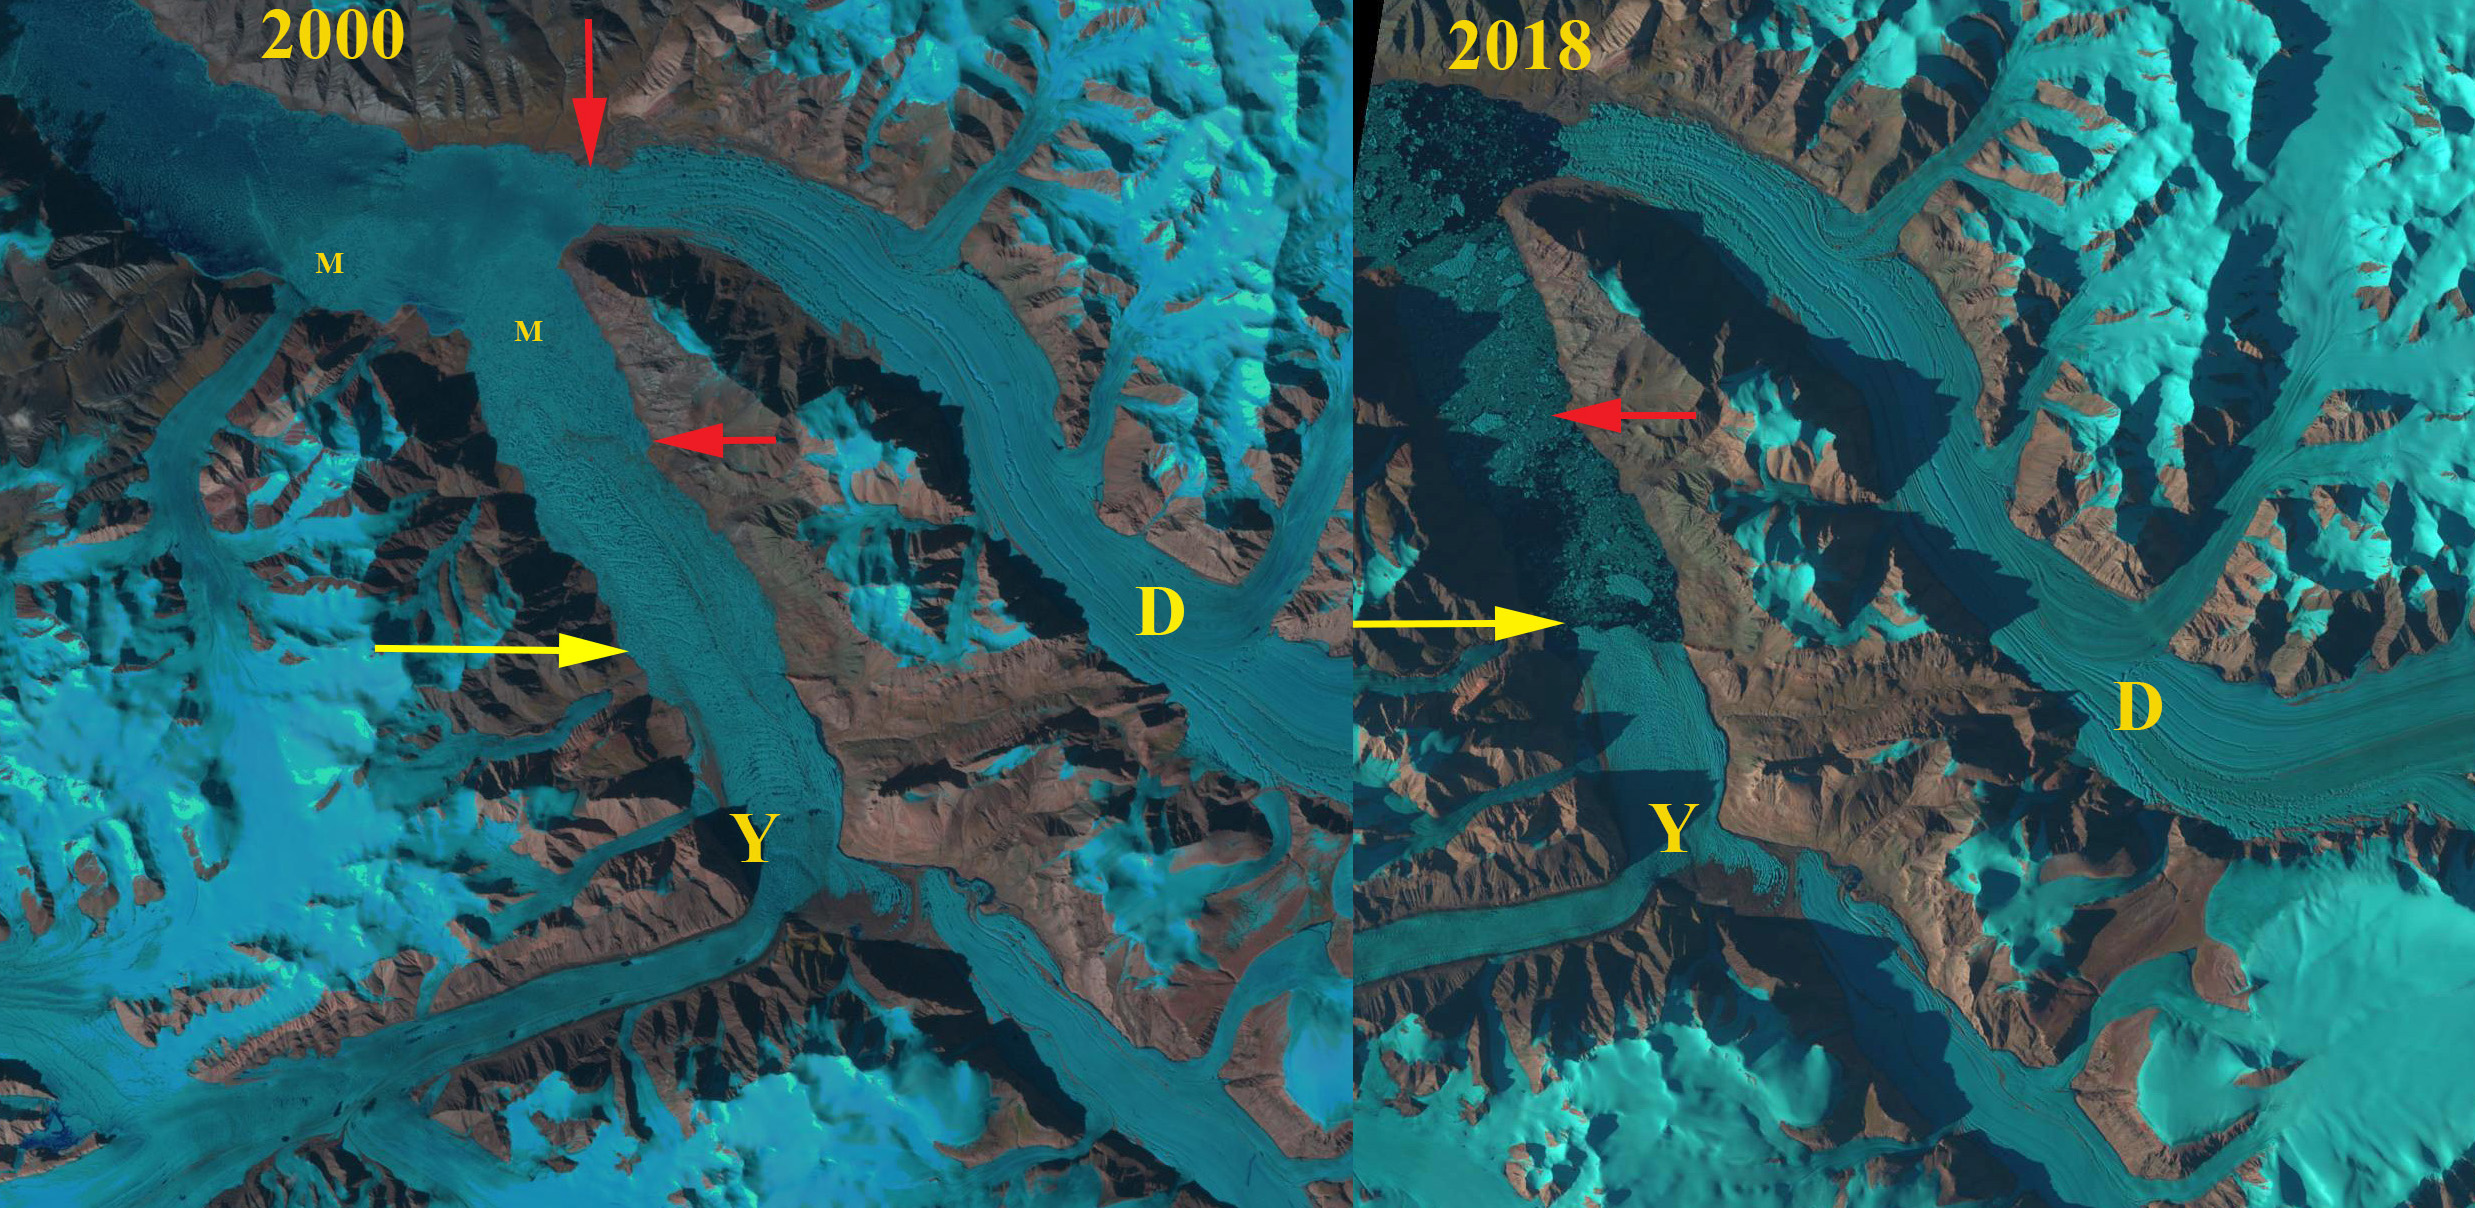
Yelverton Glacier (Y) and De Vries Glacier (D) in 2000 and 2015 Landsat images.  Red arrows indicate the 1999 terminus and yellow arrow the 2018 terminus.  Point M indicates the area of melange or sikussak. 

Trinity-Wykeham Glacier Retreat, Causing Separation, Ellesmere Is. Canada

Trinity (T) and Wykeham (W) Glacier in 1999 and 2016 Landsat images.  Red arrow indicates 1999 margin, yellow arrow 2016 margin, yellow dots the actual ice front. 

Trinity (T) and Wykeham (W) Glacier flow east from Ellesmere Island into a fjord off of Nares Strait.  Until recently the two have been joined just before the terminus. Millan et al (2017) observed glaciers in the region.  They noted a change  in ice loss from Queen Elizabeth Islands glaciers, during the 1991–2005 mass loss was 52% from ice discharge and 48% from surface mass balance. During 2005–2014, the mass loss increased dramatically with 10% from ice discharge and 90% from surface balance losses. They reported that Trinity and Wykeham Glacier had a stable velocity from 1991-2009 and doubled in speed by 2015.  They noted a retreat of 1.8 km for Wyjkeham Glacier form 1991-2015 and 5 km for Trinity Glacier.  Here we examine Landsat imagery from 1999, 2002, 2004 and 2016 to identify changes in the two glaciers.

In 1999 the two glaciers are joined with a 14 km long ice front.  The ice front of Trinity to the North extends to an outlet glacier entering the fjord from the north.  The southern margin of the joint front extends 4 km beyond a mountain marking the southern entrance to what will be Wykeham Fjord (SW).  In 2002 there is little change in the icefront.  By 2004 Trinity Glacier has retreated 4 km along the northern edge and 5 km on the southern edge, now terminating at the eastern end of a ridge marked (MR).  Wykeham Glacier has experienced a minor retreat.  From 2004 to 2016 there is little change in the front of Trinity Glacier, while Wykeham Glacier has retreated  1.5 km along the southern margin.  This illustrates the substantial ice discharge loss before 2004 of the two glaciers and limited ice discharge net loss after 2004, as Millan et al (2017) noted. The strong surface mass balance losses of recent years has led to thinning, which should drive further retreat. The two glacier will enter their own developing fjords. In 2016 it is evident that the melt area extends quite high on the glacier, bottom image.  Melt ponds extend up to at least 800 m, purple arrows.  The acceleration in 2015 if it continues will deliver a much higher flux further reducing volume and driving retreat.  We have seen this pattern of  thinning, acceleration and retreat on many glaciers typically driven by greater surface melt and frontal/basal melt, depending on flotation. The retreat here is similar to that of Mittie Glacier also on Ellesmere Island.

Trinity (T) and Wykeham (W) Glacier in 2002 Landsat image.  Red arrow indicates 1999 margin, yellow arrow 2016 margin, yellow dots the actual ice front. 

Trinity (T) and Wykeham (W) Glacier in 2004 Landsat image.  Red arrow indicates 1999 margin, yellow arrow 2016 margin, yellow dots the actual ice front. 

Trinity (T) and Wykeham (W) Glacier in 2016 Landsat image.  Red arrow indicates 1999 margin, yellow arrow 2016 margin, yellow dots the actual ice front and purple arrows melt ponds.