La Perouse Glacier, Alaska Lake Formation Retreat Acceleration

La Perouse Glacier in 2018 and 2023 Landsat images indicating the six developing proglacial lakes (1-6). The lakes in 2023 have a combined area of 1.3 km2. Debris cover has expanded notably at Points D.

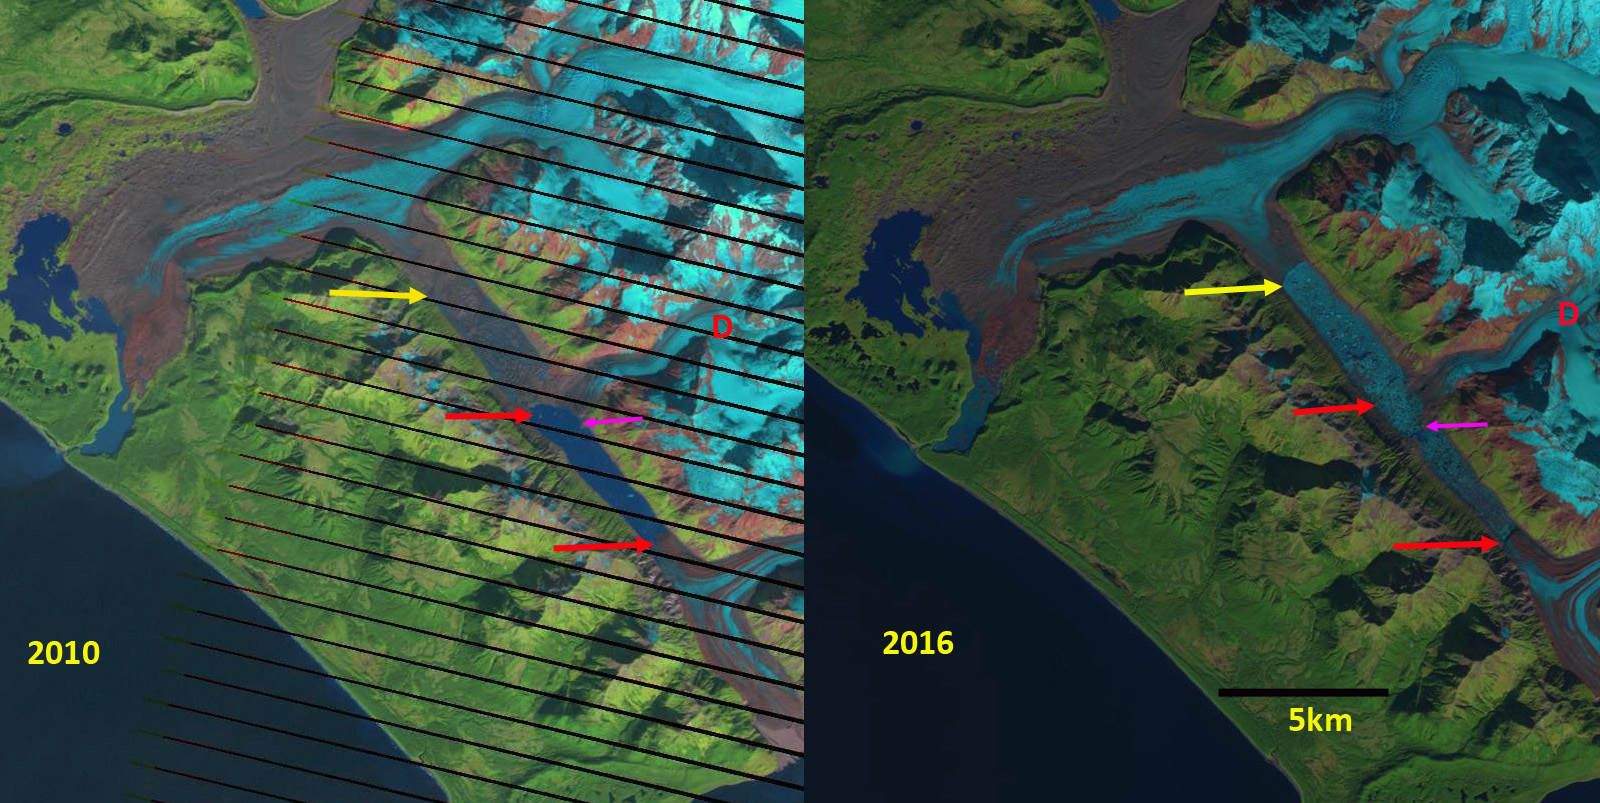
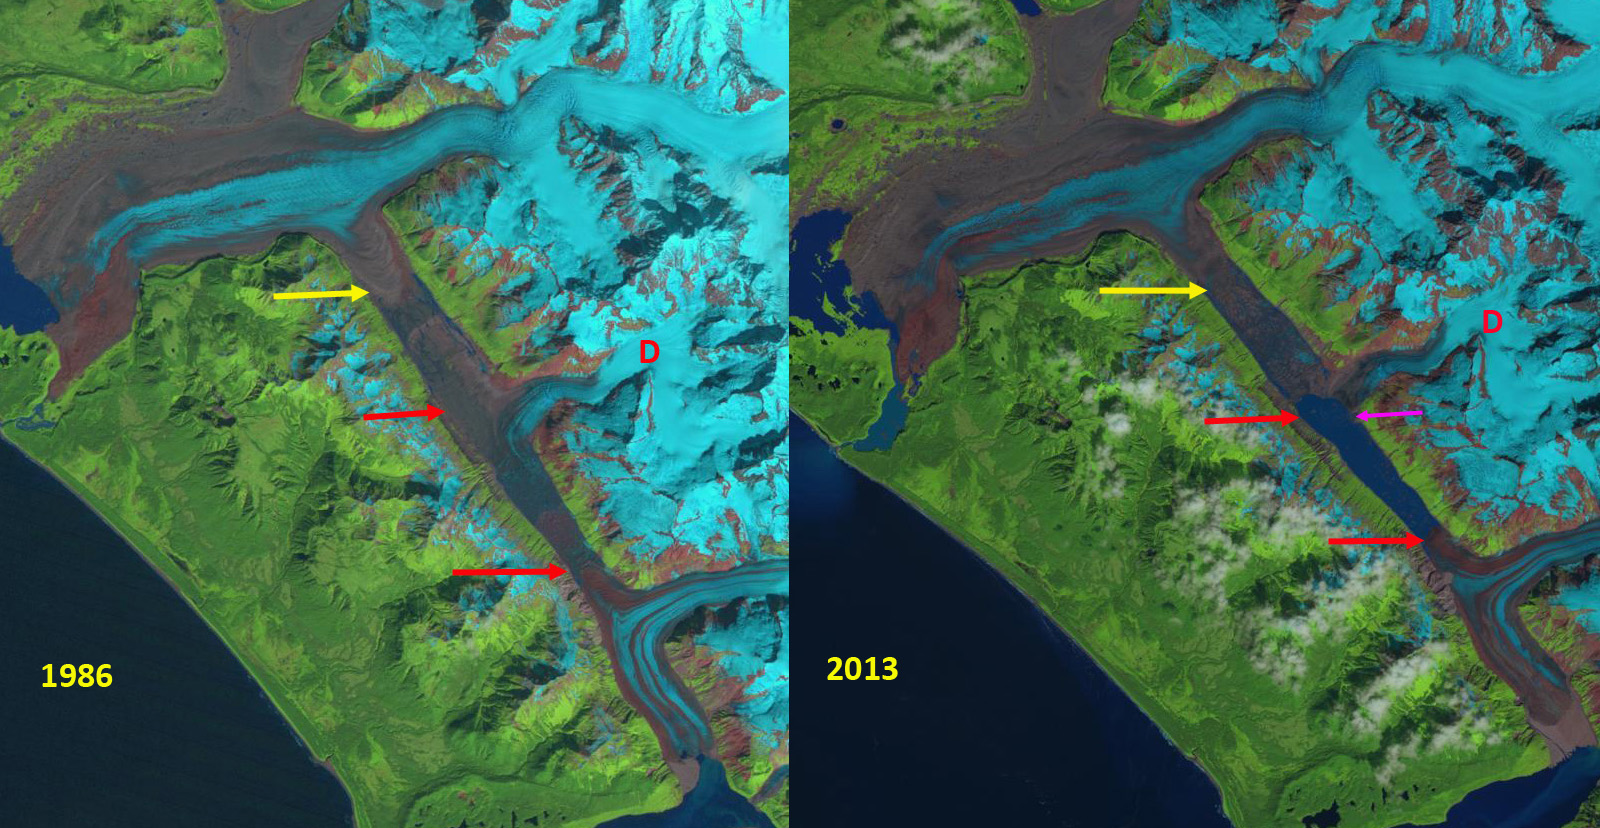
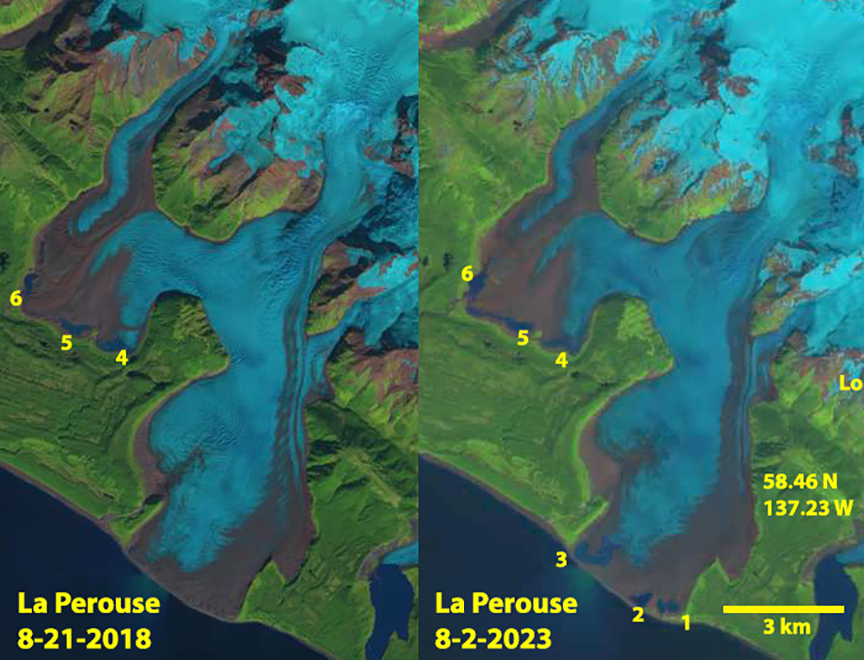
La Perouse Glacier flows from the Fairweather Range to the Pacific Coast. The glacier advanced to the coast in the mid-late 19th century and has remained tidewater on the coast since (Gaglioti et al 2019). I first saw this glacier in 1982 and its terminus stretched 3.5 km along the coast, a second terminus ended inland and was 3.2 km wide. Both of the terminus are piedmont fed by a significant accumulation area above 2300 m, that flows through a spectacular icefall from 1100 to 1800 m. This high accumulation zone helps make the glacier more resilent to warming temperature (Pelto, 1987). Berthier et al (2010) noted a ~0.5 m/loss average loss for glaciers in this region from 1962-2006, which has generated this retreat. The glacier because of its size and large piedmont lobe is slow to respond to climate change, 20 km2 coastal lobe and 10 km2 inland lobe.

La Perouse Glacier coastal terminus area indicating the three developing proglacial lakes, yellow arrows. False color Sentinal images.

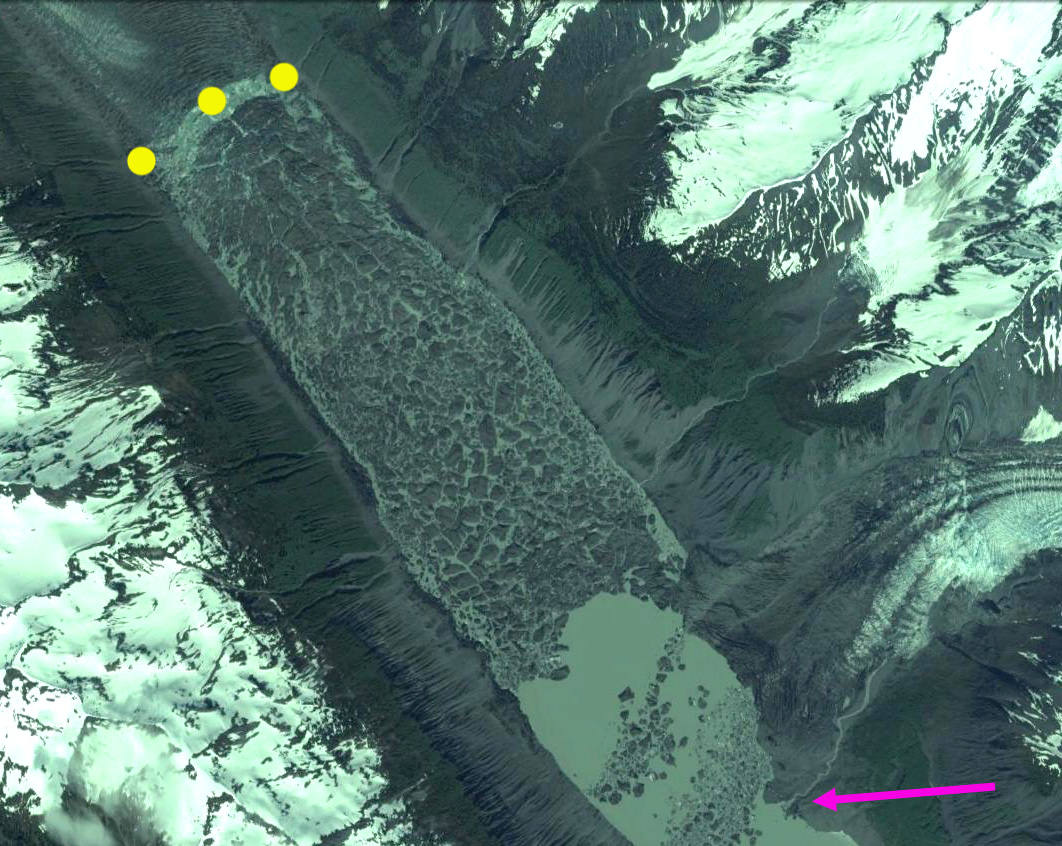
Up to 2018 the coastal terminus was thinning, but had not experienced significant recession or proglacial lake development. There was significant marginal recession by 2018 exposing a forest overrun by the glacier in the 1860’s (Gaglioti et al 2019). In 2018 the inland terminus had developed 3 proglacial lakes wiyth a combined area of 0.4 km2. By 2023 the inland terminus lakes spread across 90% of the width of the terminus, with a combined area of 0.7 km2. In 2023 the main terminus had developed three proglacial lakes each, #1 at 0.12 km2, #2 at 0.16km2 and #3 at 0.36 km2. Lake #3 has numerous bergs indicating the ability to rapidly expand by calving, due to having a greater water depth. In just five years the debris covered area has expanded notably. This combination of expanding glacial lakes and debris cover is an indication of ongoing rapid decline. The changes here are simialr to that at nearby Brady Glacier and progressing on the same trend as Fingers Glacier. Look for further lake development in 2024 particularly in the coastal lobe.

Desolation Valley, Alaska, Conversion from Glacier to Lake


desolation-compare

Retreat of Desolation-Fairweather Glacier from 2010-2016 in Landsat images.  The red arrow indicates 2010 terminus positions, yellow arrow the 2016 terminus. Pink arrow a delta exposed by lake level lowering. D=Desolation Glacier.

Desolation Glacier flows west from the Fairweather Range into Desolation Valley where in 1986 it joined with the Fairweather Glacier flowing from the north and the Lituya Glacier flowing from the south to fill the valley with glacier ice.  This is no longer the case, the valley once known for its long relatively flat area of largely debris covered ice, is mostly a lake now.  The valley has developed along the Fairweather Fault. Molnia (2007) noted that the tidewater termini of Lituya Glacier advanced ∼ 1 km since 1920 and continued to advance up to 2000 as it built an outwash plain reducing calving. Larsen et al (2015) noted thinning rates of 3 m per year for the Desolation Valley from Desolation Glacier north to Fairweather Glacier in the last decade (1994-2013).  Alifu et al (2016) identified that Desolation Glacier and Fairweather Glacier have lost 2.6% and 2.2% of their glacier area, respectively from 2000-2012. Only minor surface area changes were seen in Lituya Glacier during this period. They also noted that the mean snow line altitude of Fairweather, Lituya and Desolation increased by 120–290 m. Since 2012 extensive ice loss of the Desolation-Fairweather complex has occurred.  This is similar to the large rise in the transient snowline/equilibrium line noted by Pelto et al (2013) on nearby Brady Glacier.

In 1986 The Desolation Valley was filled with glacier ice from Fairweather Glacier to Liutya Bay.  By 2010 the southern half of the valley from Lituya Glacier to the outlet of Desolation Glacier into the valley had opened up and the terminus of Desolation Glacier and Lituya Glacier were at the red arrows, this represented a 5.3 km section of glacier lost. In 2013 the northern half of the valley filled by the Desloation-Fairweather Glacier was breaking up but still ice filled.  The Google Earth image from 2014 illustrates how broken up.  By 2016 the collapse was total and the new terminus is at the yellow arrow a 5.5 km retreat since 2010, this is a loss of 6.5 square kilometers of ice. The lake level also dropped which led to exposure of a lacustrine delta that had been submerged in 2013 and 2014, pink arrow. The lake has expanded in area, but lost in mean depth.  Will this continue to be a lake with continued retreat or become a braided river valley as the Fairweather Glacier continues to thin and retreat?  Desolation Glacier is no longer calving and its retreat rate should slow.  The terminus of the Fairweather Glacier should continue to retreat via calving in a fashion similar to glaciers around the world terminating in extensive lakes. Just to the north the North Fork Grand Plateau Glacier also experienced a large recent retreat with Landsat imagery in 2013 and 2014 indicating extensive calving from 2013 to 2015 and a retreat of 3.0 km, 1.5 km/year.  Fingers Glacier  is another nearby glacier that also is experiencing widespread retreat.  More images of the region are in a field blog on the region.

desolatiion-1986-2013

Retreat of Desolation-Fairweather Glacier from 1986 and 2013 in Landsat images.  The red arrow indicates 2010 terminus positions, yellow arrow the 2016 terminus. Pink arrow a delta exposed by lake level lowering. D=Desolation Glacier.

desolation-breakup

Google Earth image from 2014 of the disintegrating debris covered glacier.