
The Hardangerjøkulen Ice Cap is situated in southern Norway,150 km from the western coast. This elliptical shaped ice cap covers 73 square kilometers and ranges in altitude from 1020 to 1865 meters. It rises above the community of Finse offering access to snow year around. Norway has the most comprehensive glacier monitoring program in the world, mainly due to the heavy reliance on hydropower, for which glacier runoff is a key input. The Rembesdalsskaka drains west from the ice cap, the left side feeding the Rembesdalsvatnet Reservoir.  The research is led by the The Norwegian Water Resources and Energy Directorate (NVE). Statkraft runs the Sima power station that is fed from Rembesdalsvatnet Reservoir and the larger Sysenvatn fed by the southern glaciers of Hardanger. This system produces 620 Mw of hydropower. The largest glacier draining the western side of the ice cap is the Rembesdalsskaka with an area of 17 square kilometers. Since the LIA maximum Rembesdalsskaka has retreated almost two kilometres, The ice cap decreased in volume from the Little ice Age until 1917, followed by an increase in ice cap volume and glacial advance until 1928, . After this a period with high negative mass balances cause a rapid retreat of Hardangerjøkulen until 1950. Retreat continued until 1961, but the rate declined. From 1961 to 1995 mass balances increased, with the highest balances in the late 1980’s and early 1990’s. This resulted in an advance of Rembesdalsskaka. Since the early 1990’s mass balance has been negative, with exceptionally negative years in. This has led to the retreat of the Rembesdalsskaka each year from 2000-2009 a total of 307 meters.
  The retreat is measured each year from a benchmark painted on rock beyond the terminus, reported to the NVE and then to the World Glacier Monitoring Service. In 2009 the NVE reported 19 glaciers retreated, 3 were stationary and one advanced.
Tag: glacier mass balance
Mass Balance of the Easton Glacier 2009
Immediately below is Easton Glacier on Mt. Baker in the North Cascades in late May 2009. The glacier is still completely snow covered. The bench where the small gray cloud shadows are at 6000 feet averages 20 feet of snow remaining.
 Easton Glacier extends from the terminus at 5600 feet to the slopes near Sherman Crater at 9000 feet. Each summer since 1990 NCGCP has measured the mass balance of this glacier. View Youtube for a pictorial review of the full 2009 field season . The glacier has retreated 300 m since 1990. During this same period the glacier has lost a cumulative mean of 13 m of thickness. Given a thickness in 1990 between 60 and 75 m, this is about 20 % of the total glacier volume. The image below shows the terminus in 2009(green=2009, 2006=brown, red=2003, purple=1993 and yellow=1984).
  Measuring mass balance requires assessing snowpack depth and areal extent at the end of the summer melt season and the amount of melting in areas where blue ice or firn (snow more than a year old) is exposed. Below is measuring crevasse stratigraphy and below that emplacing a stake to measure ablation with weather instruments on it.

Mass Balance = residual snow accumulation – ice-firn melting.
The melt season began a bit late just when the May picture was taken Winter snowpack was between 75and 90% of normal in the area as of April 1. The melt season had been late to begin and snowpack by late May was near normal. Record heat was experienced at the end of May and the start of June, quickly causing snowpack to fall below normal.Each year we measure the snow depth via probing and crevasse stratigraphy at more than 200 locations. These depth measurements allow the completion of a map of snow distribution. This map is completed in early August and updated, based on a smaller number of observation in late September. The amount of melting is assessed from stakes emplaced in the glacier and the recession of the snowline in areas where snow pack depth has been assessed. below are images from early and then mid-August indicating the rise of the snowline. 

A warm June and July caused exceptional snow pack melt and by early August when we began assessing snow pack depth retained, the snowcover had receded to the 6400 foot level, 300-400 feet higher than normal. Snowpack remained below normal all the way to the 8600 foot level. the snowpack since early July had been rising nearly 100 feet per week. By mid-August at right the snow line on the glacier averaged 6800 feet. By mid and Late September the snowline had risen to 7400 feet a rate of rise of 150 feet per week since mid-August. Below is an image from mid-September 2009.  The amount of melting on the glacier in July was the highest we have measured totaling, 2.1 m. This led to the exposure of a couple of new bedrock knobs evident in the picture at right near the 2100 meters, black arrows. Overall the mass balance of the glacier in 2009 was a negative 2.06 m. This glacier averages 55-70 m in thickness and this mass balance loss represents a 3% volume loss in a single year for the glacier.
Columbia Glacier year by year
The following pictures give a year by year view of Columbia Glacier within one day of August 1. The best year was 1999, the worst, 2005.The snowy peaks of the Monte Cristo region can be seen from the Everett area. With 30 glaciers many at low altitudes, this region may receive more snow than any other region in the North Cascades. The largest and lowest is Columbia Glacier occupying a deep cirque above Blanca Lake and ranging in altitude from 4600 to 5700 feet. Kyes, Monte Cristo and Columbia Peak surround the glacier with summits over 2000 feet above the glacier. The Monte Cristo range is the first major rise that weather systems coming off the ocean encounter on the way east to the Cascade Crest. As a result precipitation is heavy. During the summer if it is raining anywhere in the North Cascades it will be in the Monte Cristo region. The glacier is the beneficiary of heavy orographic lifting over the surrounding peaks, and heavy avalanching off the same peaks. We measure the mass balance of this glacier each year and report the data to the World Glacier Monitoring Service. The location is gorgeous as seen in this painting by Jill Pelto 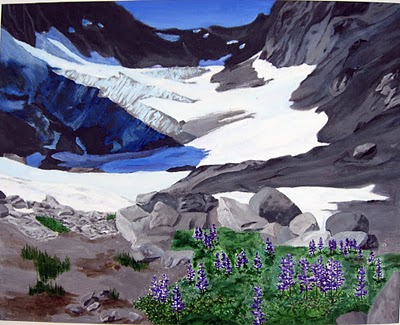 Despite the advantages of snow accumulation the glaciers mass balance since 1984 has average -0.5 m a year for a cumulative loss of 13 m. For a glacier that averages 60 m in thickness this is over 20% of its volume. Details of the mass balance research and methods are at
Columbia Glacier has retreated 134 m since 1984. Lateral reduction in glacier width of 95 m in the lower section of the glacier and the reduction in glacier thickness are even more substantial as a percentage. The major issue is that the glacier is thinning as appreciably in the accumulation zone in the upper cirque basin as at the terminus. This indicates a glaciers that is in disequilibrium with current climate and will melt away with a continuation of the current warm conditions. The glacier has lost 17 m in thickness since 1984, but still remains a thick glacier, over 75 meters in the upper basin and will not disappear quickly.
A lateral moraine deposited during the Little Ice Age, is visible at the western edge of the glacier, descending below the glacier to 4250 feet. This moraine has little vegetation on the inside, but is vegetated on the outside. Just in front of the terminus are two terminal moraines deposited during retreat in the last 20 years. Facing southeast Columbia Glacier is protected from any afternoon sun except during the summer. During the winters storm winds sweep from the west across Monte Cristo Pass dropping snow in the lee on Columbia Glacier. Avalanches spilling from the mountains above descend onto and spread across Columbia Glacier. The avalanche fans created by the settled avalanche snows are 20 feet deep even late in the summer. Nearly a third of the glacier is covered by avalanche fans, but no summer avalanches have been observed. Avalanches, shading from the sum provided by the high peaks, and wind drift snow deposition permits Columbia Glacier to exist at such a low altitude.
Devon Ice Cap
Two recent papers have examined the changes in flow, mass balance and volume of the Devon Ice Cap(Shepherd et al., 2007) (Dowdeswell, 2004). The Devon Ice Cap on Devon Island in the Canadian Arctic ice cap’s area has an area of 14,000 km2, with a volume of 3980 km3 . The ice cap area decreased by 332 km2 (2.4%) between 1960 and 2000.
The mass balance of the glacier has been assessed since 1960, the total mass loss due to surface melting and runoff between has been about 59 km3. Between 1960 and 1999 about 21 km3 of ice was lost from the ice cap by calving of icebergs, contributing 0.21 ± 0.02 mm to global sea level over this time. The long term mean net surface mass balance was 0.13 m from 1960-2000. From 1998-2007 the mean annual balance has been -0.23 m year, a substantial increase. 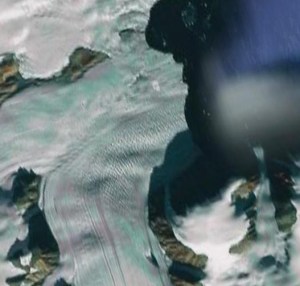 The Belcher Glacier above is the principal outlet glacier calving up to 30% of the total iceberg volume from the ice cap.
Devon Ice Cap’s negative balance has been due to warming and greater ablation, as the upper part of the glacier has seen some increase in accumulation, which has been more than offset by increased melting. 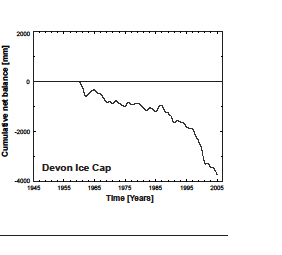 In this case the mass balance record indicates a dramatic worsening after 1995. It will be interesting to see the ablation results from the summer of 2008, when record melting was noted both in northern Greenland and northern Ellesmere Island. The glacier is not alone in its behavior, the Prince of Wales Icefield has had a negative mass balance over the last forty years of -80 km3, equivalent to a mean-specific mass balance across the ice field of -0.1 m w.e. a-1, contributes 0.20 mm to global eustatic sea level rise (Mair et at., 2008).
Photographs of the fieldwork coordinated by the University of Alberta

