Glacier Retreat Drives 400% Lake Expansion Southern Alps, New Zealand 1990-2020

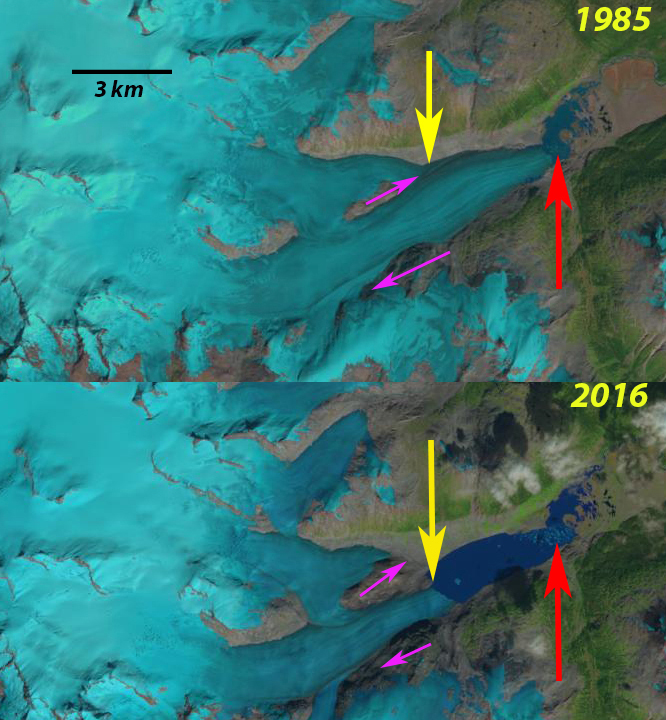
Landsat images  from 1990 and 2020 of the Mueller (M), Hooker (H), Tasman (T) and Murchison (Mn) Glacier.  Red arrows indicate the 1990 terminus location, yellow arrows the 2020 terminus location and pink arrows the upglacier extent of debris cover in 1990.

Glaciers of the Southern Alps of New Zealand have been losing ice volume since 1978, with an increasing rate in the last decade (Pelto, 2016).  Gjermundsen et al (2011) examined glacier area change in the central Southern Alps and found a 17% reduction in area mainly from large valley glaciers such as Hooker, Mueller, Tasman and Murchison Glacier. The NIWA glacier monitoring program noted that  30 per cent of New Zealand’s ice that was existed in the late 1970s has been lost in the past 40 years as snowlines have been rising. The retreat has been driven by a series of  increasingly warm summers (NIWA, 2019). The NIWA and University of Wellington 2020 snowline survey indicated improvement in 2020.  Lauren Vargo and Andrew Lorrey reported there was more retained snowcover compared to the very high snowlines in 2018 and 2019, despite the presence of ash/dust from Australian fires (NIWA, 2020).

If we look back to the 1972 Mount Cook map, see below, no lakes are evident at the terminus of Hooker (H), Mueller (M), Tasman Glacier (T), or Murchison Glacier that all drain into Lake Pukaki, pink dots indicate terminus location. In 1990 four lakes had developed one in front of each retreating glacier with a combined area of 2.5 km2.  By 2020 the combined lake area is 12.9 km2.

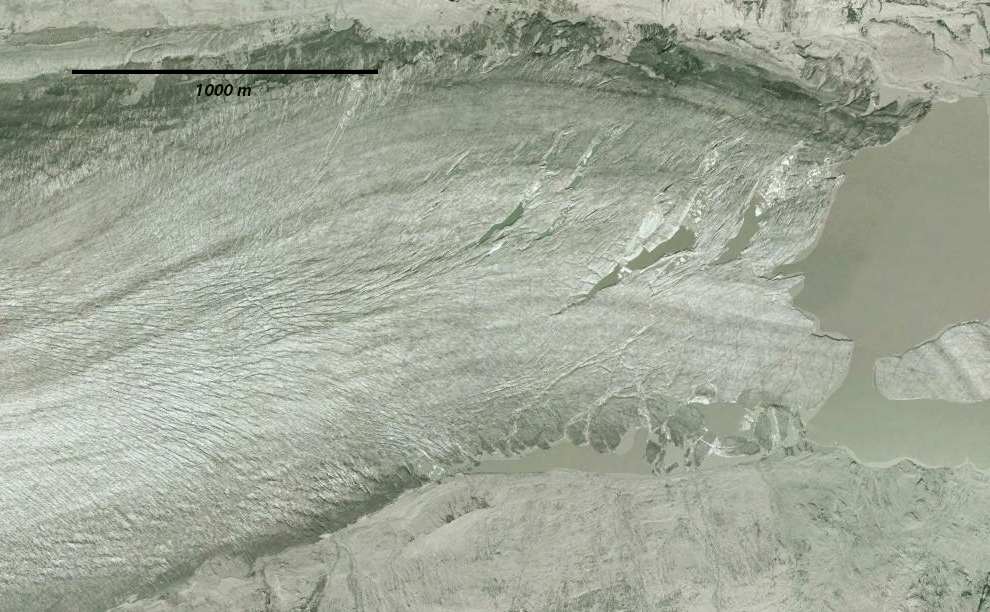
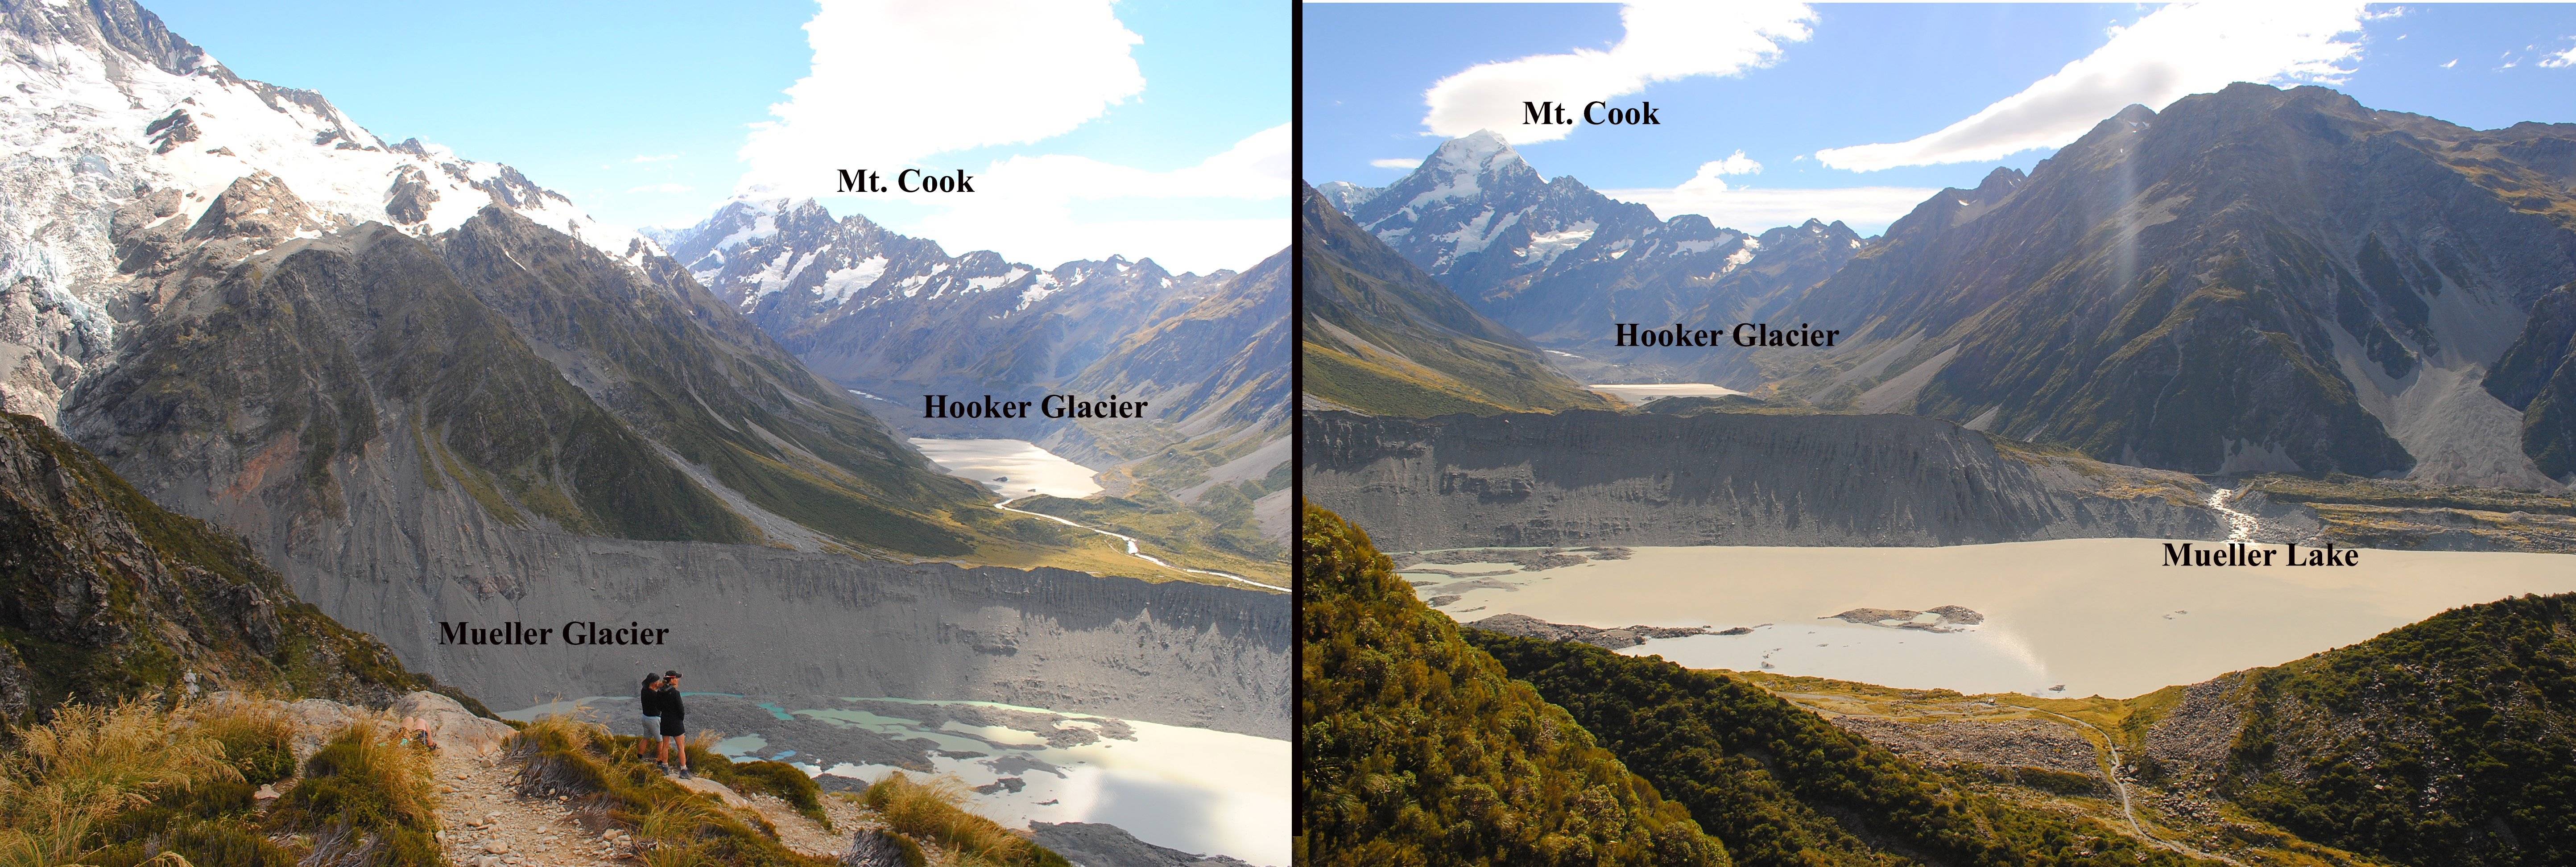
Mueller Glacier has had a 2300 m retreat from 1990-2020, which will continue in the future as the lower 1.2 km section of the glacier is stagnant. Mueller Lake area was under 0.2 km2 in 1990, expanding to 1.9 km2 by 2020. Mueller Glacier’s lower section is not a typical convex valley glacier, but a concave reach of debris covered ice with significant melt valleys and hollows indicating stagnation in the lowest 1.6 km.  In 1990 a fringing discontinuous area of water along the southern glacier margin existed.  By 2004 the Mueller Glacier Lake had expanded to a length of 700 meters.  Mueller Lake in 2010 had a surface area of 0.87 km2 and a maximum depth of 83 m (Robertson et al, 2012). By 2015 the lake had reached 1800 meters in length. From 2015-2020 the terminus collapsed into the lake with icebergs and other attached ice remnants.  Terminus images from 2018, taken by Jill Pelto, indicate the high turbidity of the lake, which is expected from a debris covered ablation zone.

Hooker Glacier retreated 1350 m from 1990 to 2020 with the retreat enhanced by calving in Hooker Lake. The lake had an area of 0.5 km2 in 1990, expanding to 1.5 km2 by 2020. The retreat was faster during the earlier part of this period with lake area reaching 1.22 km2 by 2011 (Robertson et al.,2013). Hooker Glacier has a low gradient which helps reduce its overall velocity and a debris covered ablation zone reducing ablation, both factors increasing response time to climate change  (Quincey and Glasser 2009). Hooker Lake which the glacier ends in began to form around 1982 (Kirkbride, 1993). The peak lake depth is over 130 m, with the terminus moving into shallow water after 2006 leading to declining retreat rates (Robertson et al, 2012). The debris cover now extends ~2 km further upglacier than in 1990.

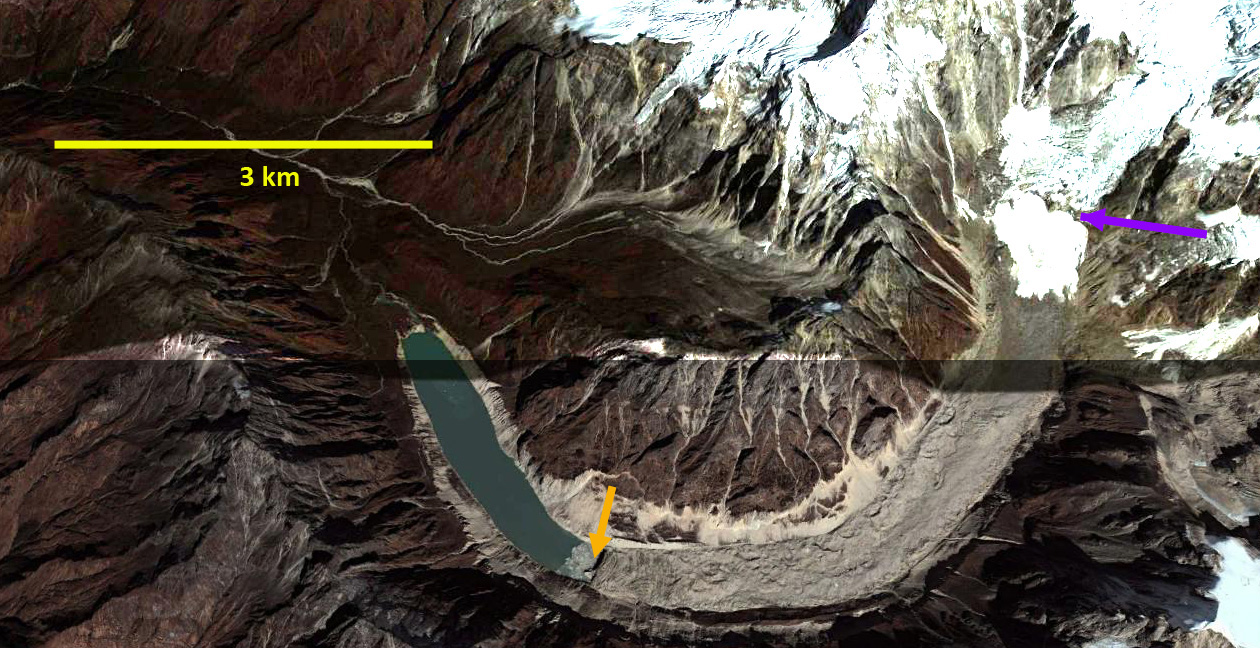
Tasman Glacier retreated 4900 m from 1990 to 2020 primarily through calving into the expanding proglacial lake. In 1990 Tasman Lake had an area of 1.7 km2, expanding to 7.1 km2 by 2020.  Dykes et al (2011) note a maximum depth of 240 m, and an annual growth rate of 0.34 km2 . The proglacial lake at the terminus continues to expand as the glacier retreats upvalley. The lake is deep with most of the lake exceeding 100 metes in depth, and the valley has little gradient, thus the retreat will continue. It has been noted by researchers at Massey University that the lake can expand in this low elevation valley another 9 km, and that at the current rate this could occur over two decades. The debris cover now extends ~1.5  km further upglacier than in 1990.

Murchison Glacier has retreated 2700 m From 1990 to 2020.  In 1990 the lake had an area of under 0.2 km2, expanding to 2.5 km2 by 2020. The rapid retreat will continue as 2010, 2013 and 2015 imagery indicate other proglacial lakes have now developed 3.5 km above the actual terminus. The debris cover now extends ~2 km further upglacier than in 1990.

For each glacier debris cover now extends further upglacier which along with rising snowlines highlights the expansion of the ablation area, that also drives volume loss, retreat and lake expansion.

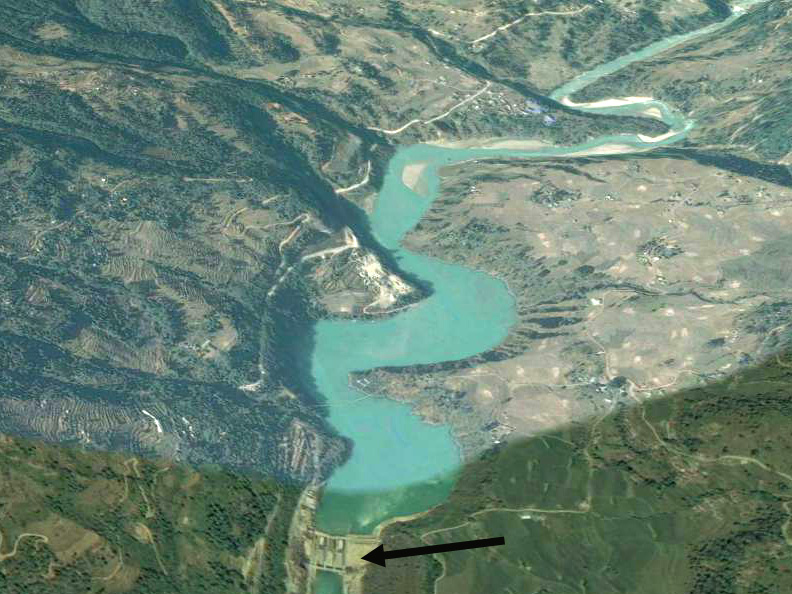
Glacier runoff is a key hydropower water resource. Water from Lake Pukaki is sent through a canal into the Lake Ohau watershed and then through six hydropower plants of the Waitaki hydro scheme: Ohau A, B and C. Benmore, Aviemore and Waitaki with a combined output of 1340 MW.  Meridian owns and operates all six hydro stations located from Lake Pūkaki to Waitaki.  Interestingly salmon have been introduced into the Waitaki River system for fishing near its mouth, though Lake Pukaki itself has limited fish.

Mueller Glacier terminus collapse in 2018, image from Jill Pelto.

1972 Map of region when Tasman, Mueller and Hooker Glacier lacked proglacial lakes.

Canals draining from Lake Tekapo to Lake Pukaki then upriver of Lake Benmore

Canal at Ohau hydropower, image from Jill Pelto.

Bridge Glacier Terminus Collapse, BC, 4 km retreat 1985-2016

Bridge Glacier comparison in 1985 and 2016 Landsat Images.  Red arrow is the 1985 terminus, yellow arrow the 2016 terminus and purple arrows indicate locations where tributaries have separated between the two dates. 

Bridge Glacier is an 17 km long outlet glacier of the Lillooet Icefield in British Columbia. The glacier ends in a rapidly expanding glacial lake and had an observed retreat rate of 30 m per year from 1981-2005 by Allen and Smith (2007). They examined the dendrolchronology of Holocene advances of the glacier and found up to 2005 a 3.3 kilometer advance from the primary terminal moraine band, with the most extensive advances being early in the Little Ice Age.  Chernos (2016)  indicates that the glacier in 2013 is approaching the upglacier end of the lake, which will lead to reduced retreat rates.  Here we compare Landsat imagery from 1985 to 2016 to determine response.

In 1985 the proglacial lake was 2.5 km long and 3.5 km upglacier of the terminus a major tributary joins.  The transient snow line is 2100 m. By 1993 the glacier has retreated 200-300 m and the snowline was at 2150 m.  By 2004 the terminus in a Google Earth image the terminus had retreated 1100 m since 1985.  By 2004 the tributary from the north has separated from the north side of the glacier.There are also some evident areas where the proglacial lake is visible up to 800 m upglacier of the terminus.  This suggests imminent collapse of this section of the terminus, which is afloat.  Matt Chernos researching this glacier documents this well with images.  Chernos (2016) observed that calving due to greater water depth and terminus buoyancy was key to retreat, but that most volume loss stemmed from melting.   In 2016 the terminus has retreated beyond the former junction of the Bridge Glacier and the northern tributary.  The glacier terminus is now within 500 m of a slope increase, likely marking the end of the developing lake basin. The total retreat in 31 years has been 4.1 km, this is a rate of 130 m/year, much faster than before. The 3 km retreat from 2004 to 2016 indicates a retreat of 250 m/year.  The separation of the three tributaries, purple arrows are not impacted by calving and indicate melting alone is sufficient to drive significant retreat.  The enhanced melt is also the cause of the high snowlines,, in 2016 the snowline is at 2150 m. The retreat is faster than nearby Klippi and Jacobsen Glacier, but both of those are also retreating fast.

This continued retreat and area loss will lead to glacier runoff decline in summer. This is crucial to the large Bridge River Hydro complex. This complex managed by BC Hydro can produce 490 MW of power, which is 6-8% of Province demand. Stahl et al (2008) note in their modeling study of the glacier that ,”The model results revealed that Bridge Glacier is significantly out of equilibrium with the current climate, and even when a continuation of current climate is assumed, the glacier decreases in area by 20% over the next 50 to100 years. This retreat is accompanied by a similar decreasein summer streamflow.”   Lillooet News (2016) notes that BC Hydro has commissioned research on the glacier to investigate impact on runoff tiiming. This parallels our findings on the Skykomish River in the North Cascades, Washington Pelto (2011).  The change in timing and the hydropower also impact salmon with late summer runs of chinook and fall coho runs.

Bridge Glacier comparison in 1993 Landsat Image.  Red arrow is the 1985 terminus, yellow arrow the 2016 terminus.

2005 Google Earth image of Bridge Glacier, note tributary separation from the north.

Closeup of terminus indicating exposures of proglacial lake upglacier of the terminus.Bridge Glacier Retreat Acceleration, BC, Canada

Thulagi Glacier, Nepal Retreat and GLOF Potential


thulagi-compare

Thulagi Glacier change in Landsat images from 1991 and 2016.  Red arrow is 1991 terminus, yellow arrow 2016 terminus and purple arrow increasingly exposed bedrock rib amidst icefall.

Written With Prajjwal Panday: @prajjwalpanday

Thulagi Glacier terminates in a lake referred to both as Thulagi and Dona Lake. ICIMOD (2011) has identified this as a potential threat for a glacier lake outburst flood (GLOF) and has conducted extensive fieldwork there.  Thulagi Lake is southwest of Mt..Manaslu in western Nepal at an altitude of 4,044 masl. Here we report on the identified threat and use Landsat imagery to identify changes in the glacier. Thulagi Lake has attracted much attention because two hydropower projects have been developed downstream on the Marsyangdi river basin, Marsyangdi Hydropower Project (69MW) and the Middle Marsyangdi Hydropower Project (70MW). Thulagi Lake began to form about 50 years ago and ICIMOD present field investigations showed that from 1995 to 2009, the length of Thulagi Lake had increased from 1.97 to 2.54 km, due to retreat and the lake area increased from 0.76 to 0.94 sq.km. ICIMOD (2011) did a bathymetric survey of Thulagi Lake using an inflatable boat. The volume was calculated to be 35.3 million cu.m in 2009 an increase from 31.75 million cu.m in 1995. The small increase despite significant area increase was because of a surface elevation lowering rate from 2003-2009  of 0.3 to 0.5 m/yr. They found the moraine walls were sinking, but more slowly at a rate of about 0.1 m/yr:  The glacier experienced substantial retreat of 1.65 km from 1958 to 1995.

From 1991 to 2016 the glacier has retreated 750 m a rate of 30 m/year.  The debris cover extends from the terminus 4.25 km upglacier  to 4500 m.  The low slope indicates the lake will continue to expand and the rate retreat should remain high. The bedrock rib is in the icefall that extends from 5600 m to 4600 m, purple arrow. The rock rib at 5000 m in the midst of the icefall is more exposed in Landsat images from 2012 to present than from 1988-2001.  This suggests some thinning.  All images indicate snowcover is persistent above 5800 m. The glacier terminus continues to calve into the lake as seen in the 2012 Google Earth Image, the 40 m high ice front calves only small icebergs that ICIMOD did not deem sufficiently large to trigger a GLOF event by the surge waves. They also noted that temporary blockage of the lake outlet by river ice, snow barriers, or lake ice debris, appears unlike.

Khanal et al (2015) examined the total value at risk under the modeled GLOF scenario of US $406.73 million for Thulagi. The estimated maximum flow was 4736 m3 /second for Thulagi. The majority of this potential damage was to the two hydropower projects.  They noted 125 buildings and  100 acres of irrigated land at risk. A group of Nepali and US scientists carried out stability assessment of Thulagi Lake and its moraine after the April 2015 7.8 magnitude earthquake (USAID, 2015). They noted that the main moraine complex at the end of the lake is relatively stable (black arrow), while the end moraine is less stable (purple arrow). The earthquake caused some slumping of the outlet at the terminal moraine and some deterioration of this moraine. Overall the hazard due to the declining water level would offset some or all of this moraine deterioration in terms of overall risk of a GLOF. Although local people are aware of the deteriorating nature of the terminal moraine at Thulagi, community discussions revealed less concern regarding the possibility of an outburst flood (USAID 2015). However, there is a demand for risk reduction activities such as installation of early warning systems, lowering of lake levels, and development of community-based disaster response plans. There is a general consensus for a science-base community driven approach to address and find solutions for these types of lakes where communities and stakeholders participate starting from research to action.

The retreat of Thulagi Glacier is similar but less rapid than many Himalayan glaciers terminating in lakes; Thong Wuk, West Barun, Lumding and Lhonak

middle-marsyangdi

Middle Marsyangdi Hydropower Station and reservoir in Google Earth

marsyandi

Marsyangdi Hydropower Station and reservoir in Google Earth

thulagi-outlet-copy

Thulagi Lake outlet.  Black arrow points to main moraine complex.  Purple arrow to the less stable terminal moraine.

thulagi-ge

Thulagi Lake in 2012 Google Earth image.  Yellow arrow is recently calved ice and purple arrow indicates bedrock within icefall.