For the 14th year I had the opportunity to author the Alpine Glacier section of the State of the Climate 2022 report published in the Bulletin of the American Meteorolocial Society. Below is this report with additional images.
An increasing frequency of heat waves impacting glaciated mountain ranges continues to lead to large mass balance losses. In 2022 heat events in the European Alps, Svalbard, High Mountain Asia and the Central Andes of Argentina and Chile resulted in a mean annual mass balance of -1433 mm w.e., for all 108 reporting alpine glaciers, with data reported from 20 nations on five continents. In the hydrological year 2021/22 the preliminary regionally averaged annual mass balance based on the World Glacier Monitoring Service (WGMS, 2021) reference glaciers was -1179 mm w.e. compared to the 1970-2020 average -490 mm w.e.
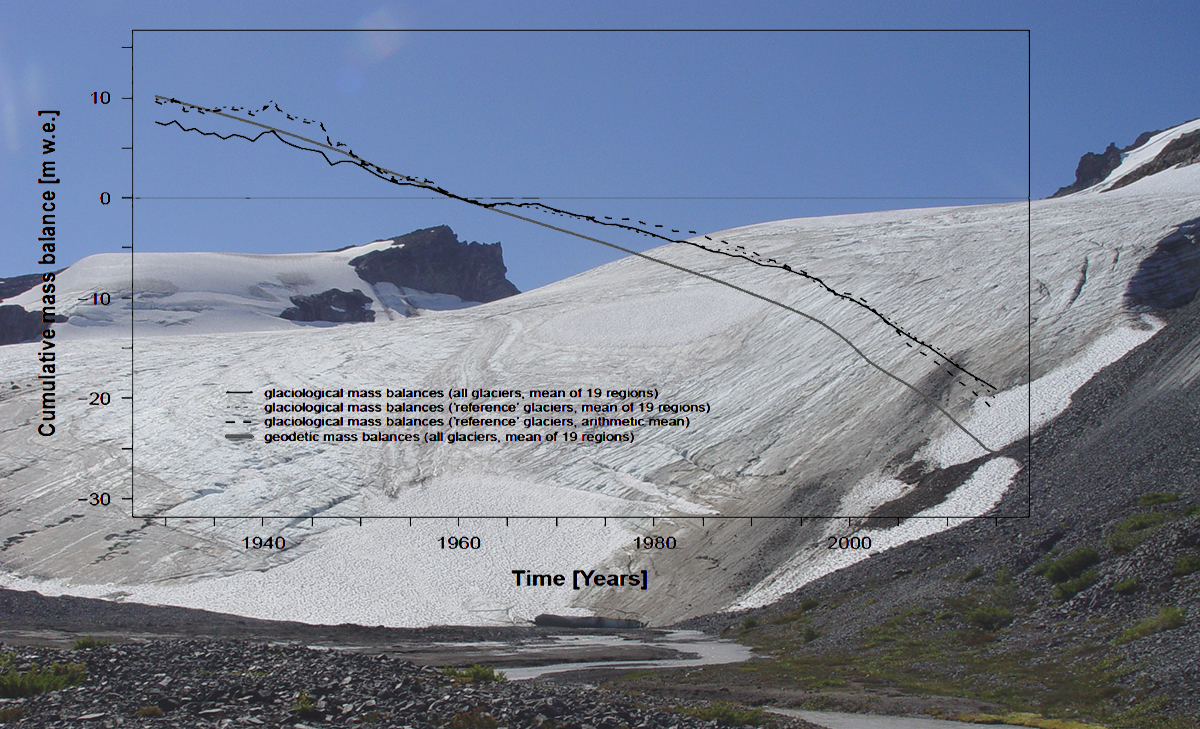
In 2022, a negative annual mass balance was reported from 34 of the 37 reference glaciers reported to WGMS. The mean annual mass balance of thereference glaciers reporting was -1547 mm w.e.. Reference glaciers each years of observation are used to generate regional averages. Global values are calculated using a single value (averaged) for each of 19 mountain regions in order to avoid a bias to well observed regions. The regionally averaged annual mass balance was -1179 mm w.e., less negative than the general mean. This makes 2022 the 35th consecutive year with a global alpine mass balance loss, and the 14th consecutive year with a mean global mass balance below -500 mm w.e. This acceleration in mass loss from global alpine glaciers in the 21st century matches the findings of Huggenet et al (2021).
 The lack of retained snowpack is evident at glaciers around the world in 2022.
More frequent and intense heat waves impacting glaciated ranges continued to take a toll on alpine glaciers in 2022. Heat waves reduce snow cover extent earlier in the melt season, exposing ice surfaces earlier and enhancing surface darkening, both causing higher melt rates on alpine glaciers (Shaw et al. 2021; Pelto et al. 2022; Cremona et al., 2023).
All 32 reporting glaciers in the Alps, Pyrenees and Caucasus Mountains had a negative mass balance averaging –3100 mm w.e. in 2022. In the European Alps the combination of low winter snowpack and several summer heat waves generated unprecedented mass loss (BAMS, 2023?). In Switzerland the 25 days of heat waves in 2022 are estimated to have melted 1.27±0.10 km3 w.e., equivalent to 35 % of the overall glacier mass loss during the summer (Cremona et al, 2023).
In Norway and Sweden, the average balance of 11 reporting glaciers was -443 mm w.e., with three glaciers in Norway having a positive balance. Iceland completed surveys of nine glaciers, five had a positive balance and four a negative balance with a mean mass balance of -7 mm w.e., e.g. equilibrium.
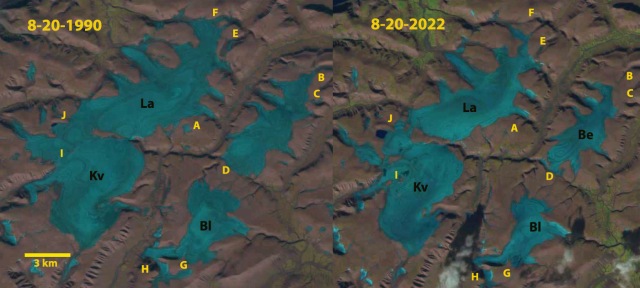 Langjokulen (La), Kvitisen (Kv), Bergfonna (Be) and Blaisen (Bl) ice caps on Edgeøya in Sentinel image from 8-20-2022 illustrating the lack of snowcover, limited firn areas and numerous annual layers.
On Svalbard the mean loss of the four reporting glaciers was -1102 mm w.e.. The negative mass balances were due to several summer heat events (BAMS, 2023?), which led to many glaciers and ice caps losing all or most of their snow cover, further accelerating mass loss (Figure 2.c.3.1).

Helm Glacier BC with limited retained snowpack.
In Alberta and British Columbia, Canada and in Alaska and Washington, United States,19 glaciers had a negative mass balance, averaging -965 mm w.e.. The Alberta, British Columbia and Washington region again experienced several prolonged heat waves. Daily glacier ablation in this region was noted as increasing by 30-40% during heat wave periods (Pelto et al 2022).

Volcan Overo, Argentina with no retained snowpack
In South America, mass balance data, reported from five Andean glaciers in Ecuador, Argentina, and Chile, were negative with a mean of -1465 mm w.e.. The combination of drought and heat events left many central Andean glaciers snow free by mid-summer in 2022. Shaw et al. (2021) noted a significant decline in surface albedo (Section 2.h.1) due to decrease fractional snow cover that further enhances melt.
In the High Mountain Asia mass balance measurements were completed on glaciers in China, Kazakhstan, Kyrgyzstan, Russia, and Tajikistan. All twenty glaciers reported negative balances. The average mass balance was -1040 mm w.e.. The negative balances were driven by above average melting during the May-July period (BAMS, 2023?).
In New Zealand the mass balance assessed on Brewster and Rolleston Glacier was strongly negative at -1125 and -1065 mm w.e. respectively. This matched the end of year snowline observations on 50 glaciers that was one of the five highest of the last 45 years.
Annual mass balance is reported in mm water equivalent (w.e.). A value of -1000 m w.e. per year is representing a mass loss of 1,000 kg m-2 of ice, or an annual glacier-wide thickness loss of about 1100 mm yr-1