Samudra Tapu Glacier, India Accelerated Retreat 1998-2016

samudra-tpa-compare

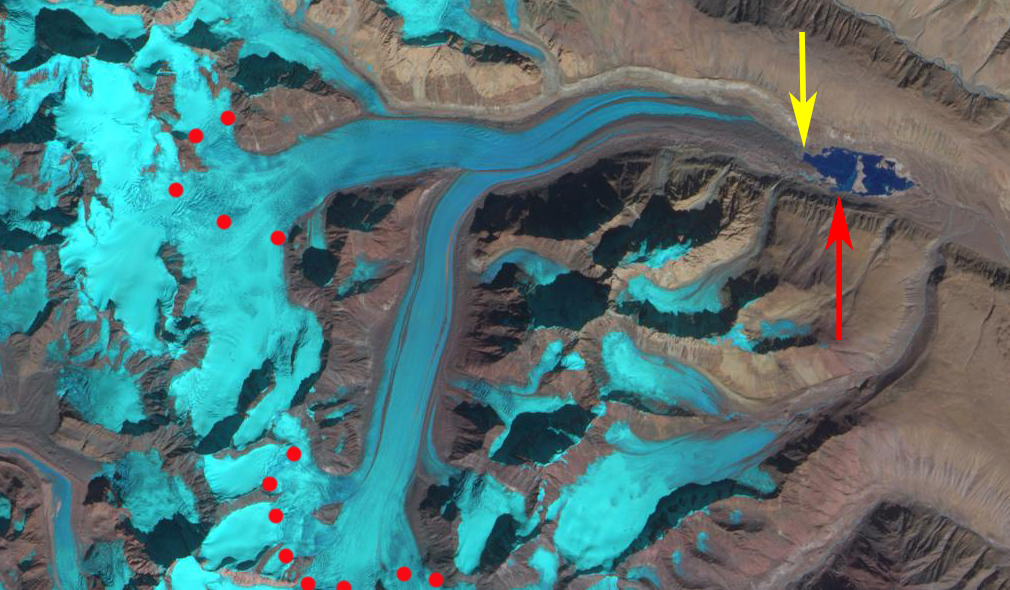
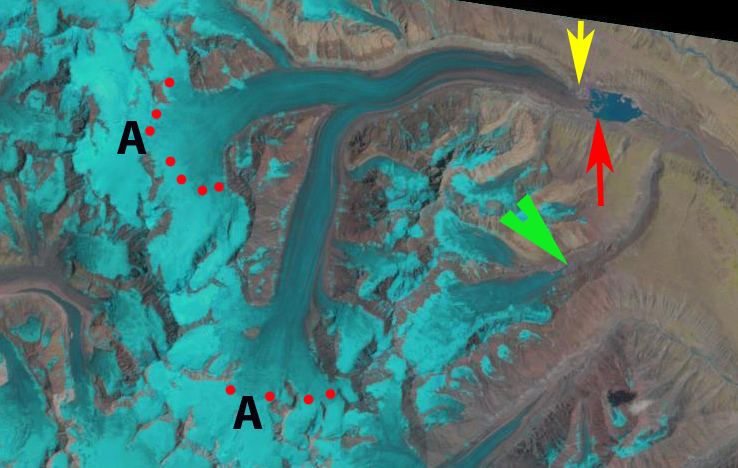
Landsat Comparison from 1998 and 2016 of Samudra Tapu Glacier, India.  Red arrow is the 1998 terminus, yellow arrow the 2016 terminus, green arrow a subsidiary glacier tongue, red line and dots the snowline and pink arrow an area indicating a water level decline in the lake. 

Samudra Tapu Glacier is one of the largest in the Chenab Basin, India. Maanya et al (2016) indicate the glacier terminates at 4150 m and is 16 km long and has an area of 62.5 square kilometers. In a glacier inventory in the basin by Kulkarni et al (2007) the 466 glaciers in the basin were observed to have lost 21% of their total area from 1962 to 2001. This study coordinated by the Space Applications Centre of the Indian Space Research Organization, has combined field observations of the glacier with remote sensing to observe the changes in area and length of the glaciers. The Chenab River also provides 690 MW of hydropower at the Salal Hydroelectric Project

In this post we use 1998, 2002 and 2016 Landsat imagery to examine the terminus of this glacier.  The terminus in 1998 is in an expanding proglacial lake and the snowline is at 5200 m.  In 2002 the glacier has retreated a short distance since 1998 and the snowline is at 5300 m.  Note that the smaller glacier tongue at the green arrow is disappearing. An October 2016 image indicates a further lake expansion and a glacier retreat of 600 m since 1998.  The lake level has also fallen as evident by the expansion of peninsula areas in the lake, pink arrow. A Sentinel 2 image from November 11, 2016 indicates the snowline is higher than in October or during the other years observed at 5400 m. The lower glacier is heavily debris covered, has a low slope and is essentially stagnant in its lowest 1 km, note image below from Anil Kulkarni. These factors will lead to continued retreat. There are some remarkably long supraglacial streams, the longest is 3.5 km long, that further illustrate the slow velocity of the lower glacier.  This is in a region where ice thickness is 100-200 m, see image below  Maanya et al (2016). Neither glacier is at the end of the melt season.   The glacier at the green arrow has retreated well upvalley from the green arrow.  This glacier is not calving into a lake and is retreating faster than Samudra Tapu.  This suggests that the debris cover is reducing melting more than the lake is enhancing melting. In November 2016 the snowline is at 5400 m.  An ELA of 5300+ meters leaves an accumulation area insufficient to maintain the current glacier size. In 1970 the ELA was at 4900 meters Kulkarni et al (2007) .  The retreat of Samudra Tapu is noted by Kulkarni (2006) as 20 meters/year during the 1962-2000 period. From 1998 to 2016 the glacier retreated nearly 600 m, closer to 30 meters/year. The retreat of this glacier is less than that of other large glaciers nearby Sara Umaga and Gangotri, but similar to Durung Drung Glacier.

samudra-tupa-sentinel-11-11-16

Sentinel 2 image from 11/11/16.  Red arrow is the 1998 terminus, yellow arrow the 2016 terminus, red dots the snowline.

sumadra-tupa-2002

Landsat image from 2002.  Red arrow is the 1998 terminus, yellow arrow the 2016 terminus, green arrow a subsidiary glacier tongue, red  dots the snowline.

sumadra-tupa-kulkarni-300x224

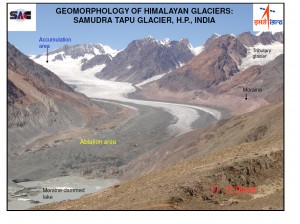
Image of the debris covered stagnant terminus of Samudra Tapu from Anil Kulkarni taken in 2006

samudra-tupa-supraglacial


samudra-tupa-depth

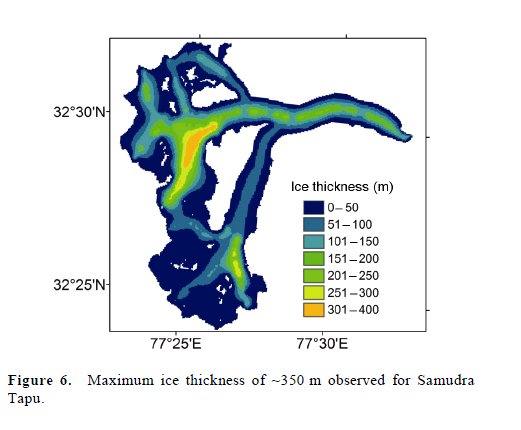
The above figure is from Maanya et al (2016).

Malana Glacier Retreat, Himachal Pradesh, India

The Malana Glacier (top image) is at the headwaters of the Malana River in the Himachal Pradesh of India. The glacier feeds the Malana Hydropower Plant (second image) a 108 MW run of river hydropower plant, that lacks a significant reservoir. The Malana River than flows into the Parbati and Beas River. Malana Glacier runoff once in the Beas River feeds hydropower facilities at Larji (120MW: third image), which alters streamflow below it leaving the river bed quite exposed at times (fourth image), Pandoh (990MW) and Pong (360 MW). The Pandoh Dam diverts water out of the basin into the Sutlej System to generate the power, see Sara Umaga Glacier retreat for details. The Malana Valley is very secluded and is sometimes referred to as the Shangri-la. This glacier differs from many of the glaciers in the region that have a heavily debris covered terminus such as the Gangotri or Satopanth. The retreat is similar to that of all glaciers in the region (Kulkarni et al, 2007). and in the high mountains of Asia except the Karokoramlarji outlet beas streamflow
Google Earth image below Larji dam indicating low streamflow near Markanda Temple.
The Malana Glacier flows south from Mt. Indrasan and Mt. Deotibba and has until the last few years turned west where the Manala valleys turns and the Malana Glacier used to join the South Manala Glacier flowing north to this junction point. Here we look at Landsat imagery from 1998, 2000 and 2011. In 1998 and 2000 the glacier turns the corner and begins the western descent to its terminus purple arrow, the narrow tongue of blue in both cases is evident heading west, though further in 1998. There is a prominent bedrock knob, yellow arrow at the western turn on the east side of the glacier. By 2011 the lower 600 meters of the glacier below the western turn has melted away and the glacier now ends at the prominent knob, yellow arrow, there is no tongue of glacier ice turning west. Just above the terminus one significant tributary, green arrow, that had been joined to the glacier during the first ascents in the region in the 1960’s had separated by a short distance in 1998 and 2000. In 2012 this distance has increased as the former tributary also retreats. The Google Earth imagery from 2004 also indicates the glacier turning the corner and descending 400-500 meters ending at an elevation of 3900 meters. A closeup of the terminus indicates the thin uncrevassed nature in 2004 suggesting that this section was largely stagnant and melting away. The 2004 terminus is indicated with green dots and the 2012 terminus with yellow dots.

Sara Umaga (Tos) Glacier, India snowline rise and retreat-Hydropower

Sara Umaga Glacier drains into the Beas River in the Himachal Pradesh region of India. The glacier has retreated over 1600 meters since initial 1970. The glacier is also a key water source for hydropower, this will be detailed below. The glacier is 15 km long extending from 5600 m to 3900 m. The glacier has retreated at a rate of 44 meters/year from 1989-2004 (Kulkarni, 2005). The glacier is adjacent to the Chota Shingri Glacier which has retreated at a rate of 7 m/year from 1970-1989 and 27 m/year from 1990-2000. The retreat is the result of the rise of the equilibrium line, approximately the snowline at the end of the summer, where ablation equals accumulation. In the late 1980’s the snowline averaged 4700 m. In recent years the snowline has been a high as 5180 meters (Wagnon et al., 2007). This same rise has led to high snowlines on the Sara Umaga Glacier. In recent satellite images the snowline is above 4900 m, and the snowline is below where the ELA will be at the end of the melt season. The snowline and the head of the glacier are noted in the image below. This leaves only 20 % of the length of the glacier in the accumulation zone. In terms of area 25-30% of the area of the glacier has been above the current ELA. For a glacier to be in equilibrium at least 50% of the glacier must be in the accumulation zone. The Sara Umaga is retreating as it cannot sustain the large lower elevation ablation area. Retreat has revealed two vegetation trimlines. The older is a Little Ice Age trimline-the former the trimline is from the 1950-1970 period. This is an attempt to restore equilibrium. An examination of the heavily debris covered ablation zone indicates that the lowest 2.25 km of the glacier is stagnant and will melt away. The end of the stagnant zone is indicated by the green arrow and the change in thickness to the Little Ice Age lateral moraine by the brown arrow and the current terminus by the pink arrow.
. The lower section of the glacier is heavily debris covered which reduces melt rates. There is no apparent crevassing or convex shape to the glacier cross profile in the lower 2.25 km indicating stagnation. The debris covered section is not sensitive to soot deposition, as it is already sufficiently dark. The Glacier drains into the Beas River, which flows first through the Larji Hydropower project, which alters streamflow often leaving the stream below nearly dry. The Beas River is then impounded by the Pandoh Dam-and lake, third image below, which diverts water through a tunnel into the Saltuj (Sutlej) River, fourthimage, and thence the Bakrhra Dam at 1200 MW hydropower project. The tunnel from Pandoh is the largest tunneling project in Inida 13 km with a diameter of 8 m. larji hydropower
Larji Hydropower looking upstream to reservoir and beyond. Notice the influence of the dam on the river which is nearly dry below the dam on the date of the imagery near Markanada Temple.
larji outlet beas streamflow

Gangotri Glacier Retreat Continues 2013 and Hydropower

In India the Gangotri Glacier is the largest glacier at the headwaters of the Bhagirathi River. The false-color image below provided by NASA shows the retreat of Gangotri Glacier, situated in the Uttarkashi District of Garhwal Himalaya. It is one of the larger glaciers in the Himalaya, and like all of the nearby Himalayan glaciers is retreating significantly. The Bharigrathi River has the Tehri Dam, a 2400 mw hydropower facility. With an area of 286 square kilometers Gangotri Glacier (Singh and others, 2006) provides up to 190 cubic meters per second of runoff for this river. Gangotri Glacier provides hydropower as it passes three hydropower plants generating 1430 MW, including the 1000 MW Tehri Dam and reservoir and maneri Bhali I and II, see map below. The Tehri also provides flood control, such as this past week of June 17, 2013. The Tehri Reservoir level rose 25 m within 48 hours which is a storage of approximately 1.3 billion cubic meters. Below is a view of the Tehri Reservoir, images of the dam and its operations are here. Bhagirathi 150411
Map from the Southeast Asian Network on Dams, Rivers and People
tehri dam map 2007Gangotri Glacier retreated 26.5 meters per year form 1935-1971. From 1968-2006 the glacier retreated 800 meters, close to 20 meters per year (Bhambri et al, 2012). Srivastava et al (2013) indicate the retreat rate of 21 m/ year from 2004-2010. The glacier continues to thin and tributary inflow decline, while the thick heavily insulated by debris terminus retreat is slow. Srivastava (2012) published a report with numerous terminus pictures though they do not have a common reference point beginning on page 90. Where the river exits the glacier is referred to as Gomukh.
Here we compare both Landsat and Google Earth images during the 2000-2013 period. First the 2000 and 2013 Landsat images. A 2000 and 2013 landsat image pinpoint the terminus change, the yellow and red arrows converge on the 2000 location of Gomukh. The blue arrow indicates the mouth of a side valley from the east that is at the terminus in 2013 and actively cutting the face, which is not the case in 2000. The orange dots indicate the course of this stream. A 2006 Cartosat image from Bhambri et al (2012) can be compared to the 2010 and 2013 Google Earth images. In Google Earth the 2010 image gives a clear view of Gomukh which can be compared to the 2006 Cartosat image from Bhambri et al (2012). In 2000 and even 2006 this was not the case. A 2013 Google earth also indicates this point,with the glacier having retreated to the side valley from the east. The retreat from the location of Gomukh in 2000 to 2013 is 240-270 m, approximately 20 m per year as noted by Srivastava et al (2013) for a shorter interval.
gangotri Glacier 2000
2000 Landsat image

gangotri glacier 2013
2013 Landsat image

.
2006 Cartosat image

gangotri 2010
2010 Google Earth image

gangotri 2013 ge
2013 Google Earth image
Gangotri 2013
2013 Google Earth image

This glaciers remains over 30 km long, and is not in danger of disappearing anytime soon. The lower section of the glacier is heavily debris covered, which slows melting. The debris cover prevents black carbon-soot from enhancing melt over most of the ablation zone. The upper reaches of the glacier extends above 6000 meters and remains snow covered even during the summer melt season June-August, as this is also a main accumulation season due to the summer monsoon. This is different from other alpine regions, where the melt season is also the dry season, here it coincides with the wet season and the accumulation season on the upper glacier. Compare the differences in hydrographs from Thayyen and Gergen (2009) Figure 3 and 4. The new snowcover on the upper glacier also limits the impact of black carbon or soot on ablation. The glacier is fed from avalanches off of the even larger area of mountains above 6000 meters adjacent to it. This is one of many glacier in the Himalaya that is being tapped for hydropower. The retreat is slower than that of nearby Malana Glacier and Samudra Tupa Glacier but similar to Durung Drung Glacier.