Mittivakkat, Greenland and Lemon Creek Glacier, Alaska transient snowline paper

Mernild et al (2013) is a new paper that has authors from several countries that I am co-author on with Knudsen, Malmros in Denmark, Hanna from UK, Yde currently in Norway and Mernild in Chile. The key items here are using the snow line observed on any particular melt season day (transient snowline=TSL) as input for mass balance assessment. This paper examines how similar the migration of the TSL is from year to year, and how ablation rate can be determined using it, when field data can be used for validation. The first two images are figures from the paper of Lemon Creek Glacier and Mittivakkat Glacier illustrating the TSL at various dates. A second key is that if the progression is relatively repeatable towards the end of the melt season, than the equilibrium line altitude (ELA) can be determined, snowline at the end of the melt season, which is a key mass balance variable. Clouds often obscure the ELA from satellite image assessment, and this allows appropriate extrapolation. The figure below needs more data to determine the consistency and nature of the TSL variation at the end of the melt season, the ELA is the top of the parabola. lemon creek base map4
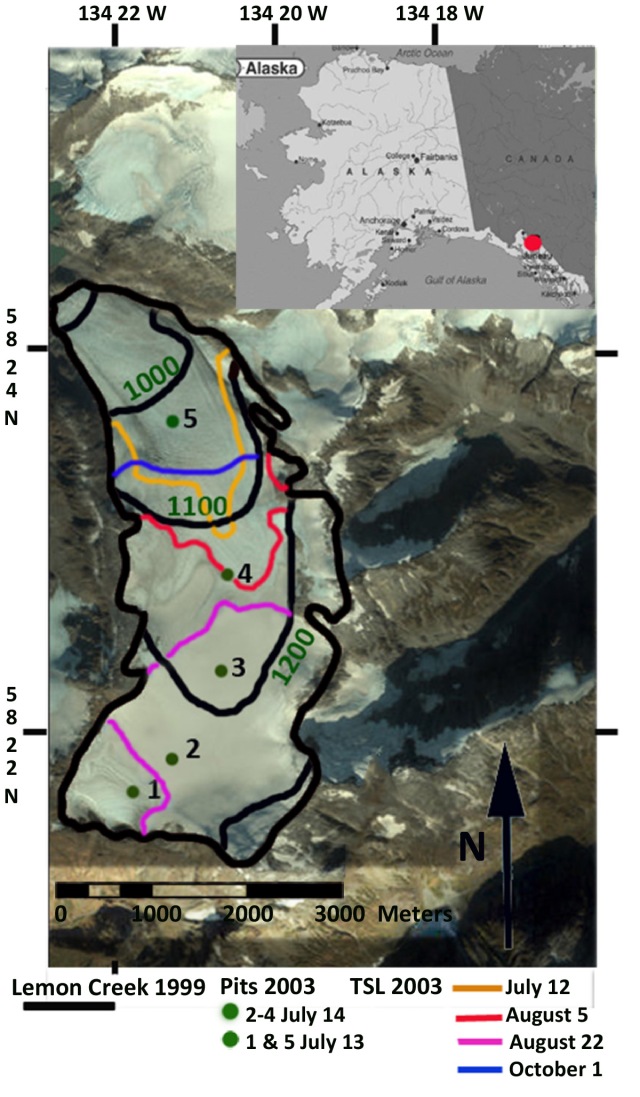
Base map of Lemon Creek Glacier in 2003 with colored lines indicating various dates of the TSL.
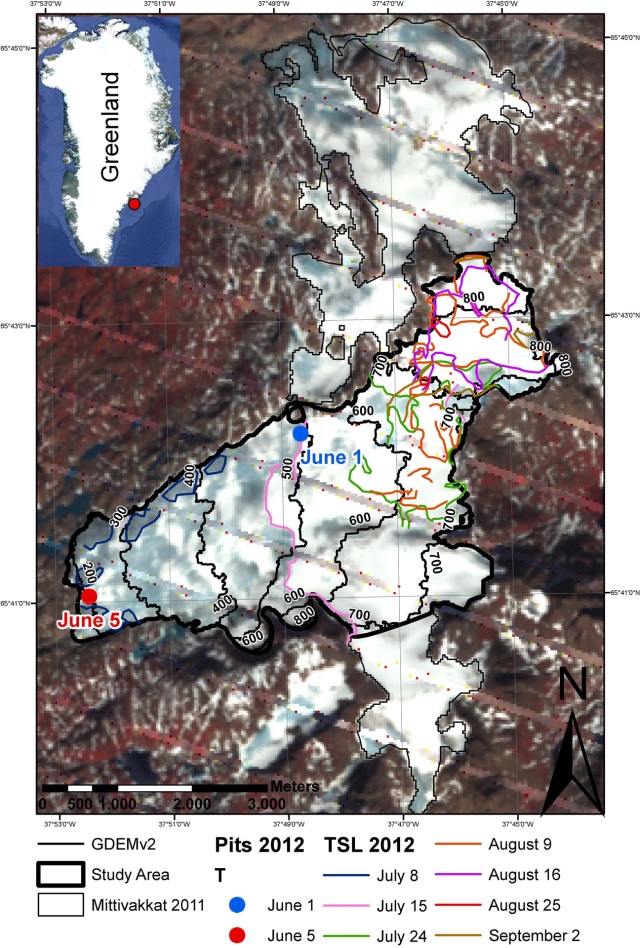
fig 3 aw
Base map of Miitivakkat Glacier in 2012 with colored lines indicating various dates of the TSL.
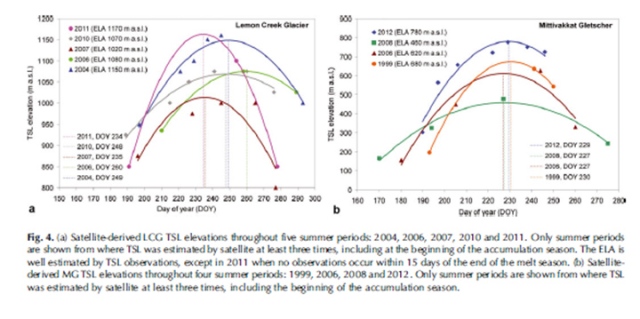
tsl-ela
Progression of the TSL approximated with a second order Polynomial, to help derive the ELA.

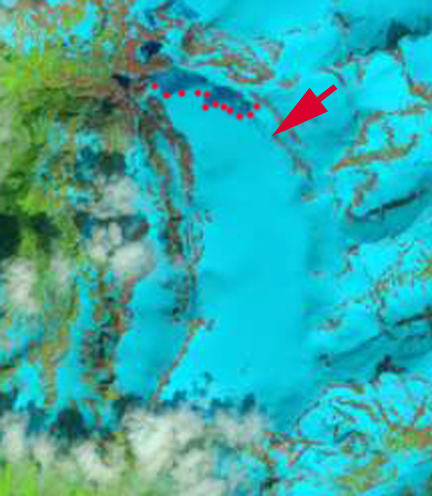
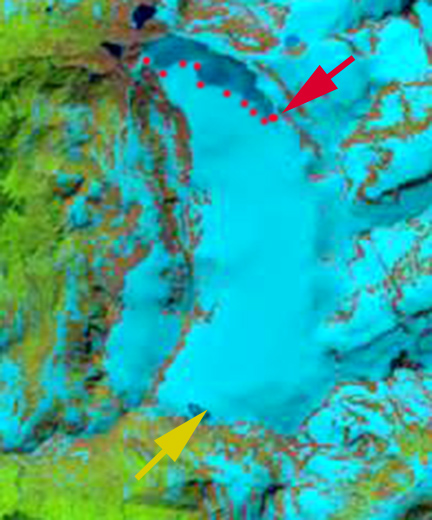
A good example of the utility is an examination of the Landsat 8 imagery from this summer. Alaska had a warm and relatively clear weather period that provided a rare chance to examine the TSL in three consecutive satellite passes on June 14, June 21 and June 30. This period began with the glacier almost completely snow covered, red dots indicate TSL, red arrow indicates the 6/30 TSL. On June 14 the TSL was at 775 m within a couple of hundred meters of the terminus. By 6/21 the TSl had moved up the northwest side of the glacier 1.5 km to an altitude of 900m. On June 30th the TSL was at 975m two kilometers from the terminus. This progression up the northwest side of the glacier is typical. At the start of July the glacier is still 90% snowcovered. The Juneau Icefield Research Program is on this glacier in early July and field work will be critical to identifying snow depths above the TSL, that the TSL will transect later in the summer identifying ablation. The yellow arrow indicates the formation of Lake Linda, a meltwater lake that forms on the glacier, the expansion from June 14 to June 30 is evident. Pictures of the lake from JIRP during self arrest practice are gorgeous. More detailed examination of the longer term change of Lemon Creek Glacier and Mittivakkat Glacier has been completed.lemon creek 165-2013
June 14 2013 Landsat image

lemon creek 172-2013
June 21 2013 Landsat image

lemon creek 181-2013
June 30 2013 Landsat image

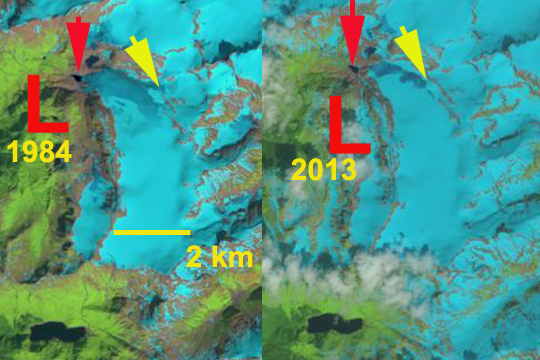
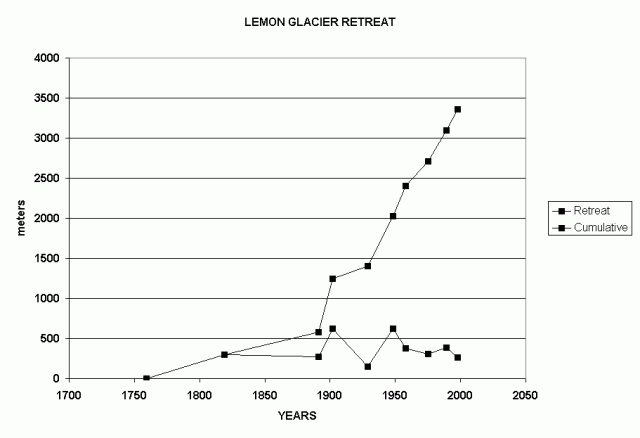
Lemon Creek Glacier Retreat Juneau Icefield Alaska

lemon glacier changeAbove is a paired Landsat image with 1984 left and 2013 right, indicating a 300 m retreat in this interval.

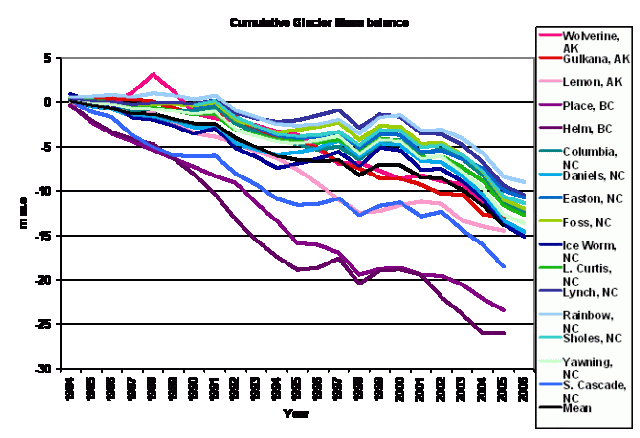
Annual balance measurements on the Lemon Creek Glacier, Alaska conducted by the Juneau Icefield Research Program from 1953 to 2013 provide a continuous 61 year record. This is one of the nine American glaciers selected in a global monitoring network during the IGY, 1957-58 and one of only two were measurements have continued. These show cumulative ice losses of –13.9 m (12.7 m we) from 1957-1989, of –19.0 m (-17.1 m we) from 1957-1995 and –24.4 m (–22.0 m we) from 1957-1998. The mean annual balance of the 61 year record is -0.43 m/a and a loss of at least 30 m of ice thickness for the full 61 year period from 1953-2013. In the second graph the similarity with other North American glaciers is evident (Pelto et al, 2013).

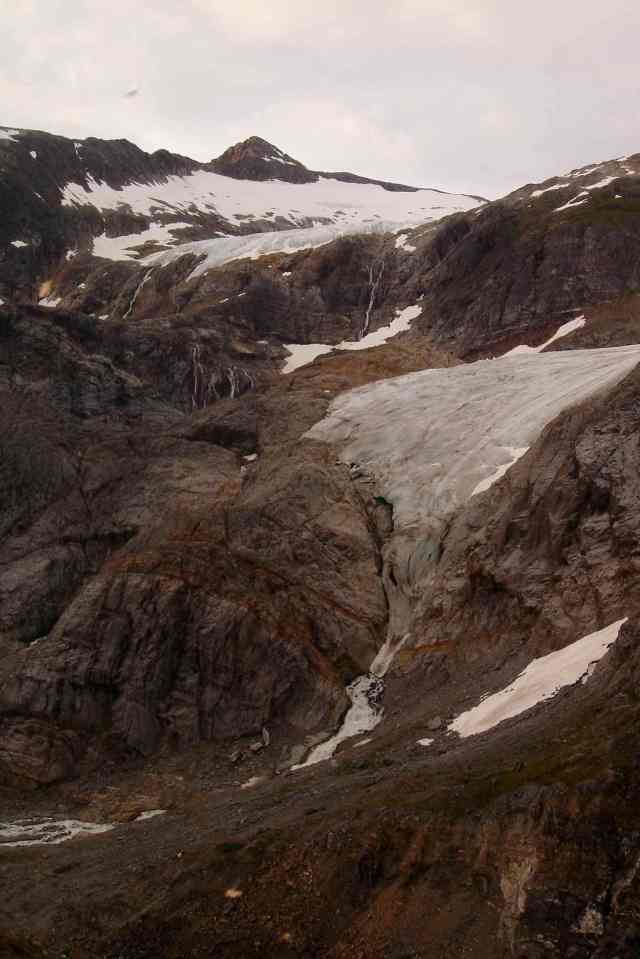
This negative mass balance has fueled a terminal retreat of 800 m during the 1953-1998 period, and an additional 200 meters of retreat by 2013. Below is a picture of the terminus enroute to Camp 17 in 1982, and below that from 2005. The annual balance trend indicates that despite a higher mean elevation and a higher elevation terminus, from thinning and retreat, mean annual balance has been strongly negative since 1977 (-0.60 meters per year). Dramatically negative mass balances have occurred since the 1990’s, with 1996, 1997 and 2003 being the only years with no retained accumulation since field observations began in 1948.

These data have been acquired primarily by employing consistent field methods, conducted on similar annual dates and calculated using a consistent methodology. The research is conducted from Camp 17 on a ridge above the glacier. This is a wet and windy place with three out of four summer days featuring mostly wet, windy and cool conditions in the summer. The camp was initially built for the IGY in 1957, and Maynard Miller and Robert Asher saw to its continued improvements through the 1980’s. The mass balance record have been were until 1998 precise, but of uncertain accuracy. Then two independent verifications indicated the accuracy (Miller and Pelto, 1999). Comparison of geodetic surface maps of the glacier from 1957 and 1989 allowed determination of glacier surface elevation changes. Airborne surface profiling in 1995, and comparative GPS leveling transects in 1996-1998 further update surface elevation changes resulting from cumulative mass balance changes. Glacier mean thickness changes from 1957-1989, 1957-1995 and 1957-1998 were -13.2 m, -16.4 m, and –21.7 m respectively. It is of interest that the geodetic interpretations agree fairly well with the trend of sequential balances from ground level stratigraphic measurements. The snowline of the glacier lies a short distance above a tributary glacier from the north that has separated from the main glacier since 1982. The snowline on the glacier was just below this juncture in the 1950’s and 1960’s but now has typically been above this former juncture. The two images below are looking down and upglacier from this former tributary in 2005.

At the head of the glacier is a supraglacial Lake Linda, which now drains under the ice. Robert Asher in the late 1970’s and 1980’s mapped this lake system when it drained under the head of the glacier not down under the terminus of the glacier.