
Mass balance, terminus and supra glacial stream assessment are illustrated in the video, Filmed by Mauri Pelto, Jill Pelto, Melanie Gajewski, with music from Scott Powers.
This is the story of the annual monitoring of Easton Glacier, Washington. We have been monitoring Easton Glacier on Mount Baker, a stratovolcano in the North Cascade Range, Washington since 1990. Each year we survey the terminus position, measure its mass balance, assess crevasse depths and map surface elevation on a transect across the glacier. In 1990 Easton Glacier was in contact with an advance moraine built from the late 1950’s- 1980’s. The advance moraine is noted in the 2015 Washington DNR Lidar image of the terminus area by black arrows. The green arrows indicate the recessional moraine from the winter of 2015. Red arrows indicate the Little Ice Age lateral moraines Railroad Grade (RG) to the west and Metcalfe Moraine (MM) to the east. From 1990-2017 the glacier has retreated 370 m, including 65 m in the last three years. The second Lidar image indicates the transect where the surface elevation is mapped, red line. This is close to 2000 m in elevation, and in a good snow year retains snowpack and in most recent years has lost its snowpack (note paired image below). In 2015 the worst year, the snowpack had been lost by the end of July. Note the comparison of the 2017 transect snowpack and 2015 lack of snowpack.
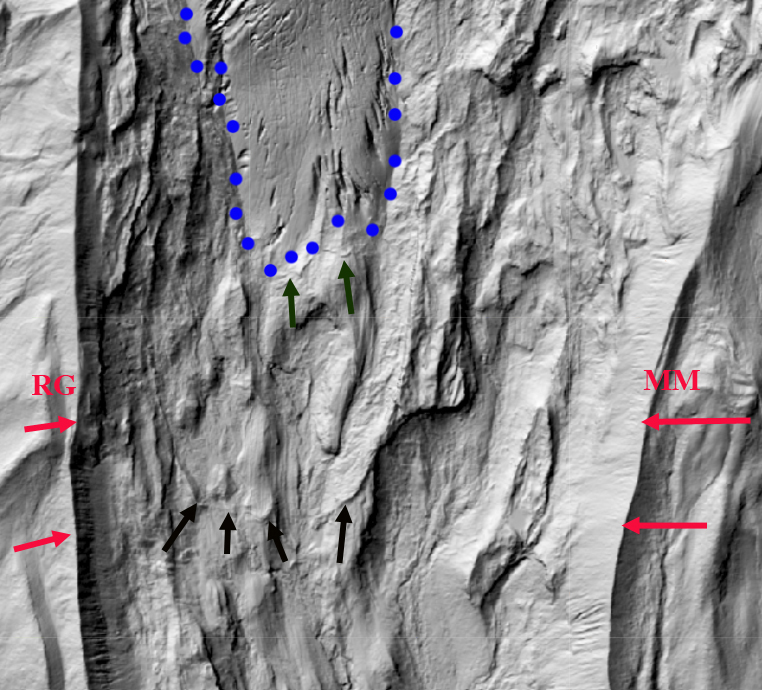
Washington DNR Lidar image of Easton Glacier , black arrows indicate 1980’s advance moraine, green arrows 2015 winter moraine and red arrows the Little Ice Age lateral moraines. Blue dots indicate the glacier margin.

Washington DNR Lidar image of Easton Glacier. Blue dots indicate the glacier margin. Red line the cross glacier profile.

A view along the cross glacier profile at 2000 m in early August of 2015, snowpack gone already and in 2017 with 2 m of snowpack remaining.
More than 5000 measurements of snow depth and melt have been completed illustrating the glacier has lost 16.6 m of water equivalent thickness, over 18 m of thickness from 1990-2016. For a glacier that averaged 70 m in thickness in 1990 this is ~25% of the volume of the glacier gone. The glacier has not maintained sufficient snow cover at the end of the summer to have a positive mass balance, this is the accumulation area ratio. The mass balance and terminus data is reported annually to the World Glacier Monitoring Service. The area lost in the terminus region due to the retreat has been 0.22 km2.
The glacier has also slowed its movement as it has thinned, evidenced by a reduction in number of crevasses. In the lowest icefall Jill Pelto has surveyed the crevasse depths finding a mean depth 20 m and a maximum depth of 32 m. This glacier supplies runoff to Baker Lake and its associated hydropower projects. Our annual measurements here and on Rainbow Glacier and Lower Curtis Glacier in the same watershed provide a direct assessment of the contribution of glaciers to Baker Lake. The glacier is also adjacent to Deming Glacier, which supplies water to Bellingham, WA. The Deming is too difficult to access, and we use the Easton Glacier to understand timing and magnitude of glacier runoff from Deming Glacier. Deming Glacier has retreated a greater distance during this period, 705 m, but has lost a similar area.

Annual terminus survey in 2015 terminus exposed to melting by early July. In 2017 terminus being exposed first week in August. Taken from same location.

Crevasses measurement in lower icefall and on the cross profile. In both cases crevasse depth is measured, on the profile 2017 winter snow depth remaining measured.
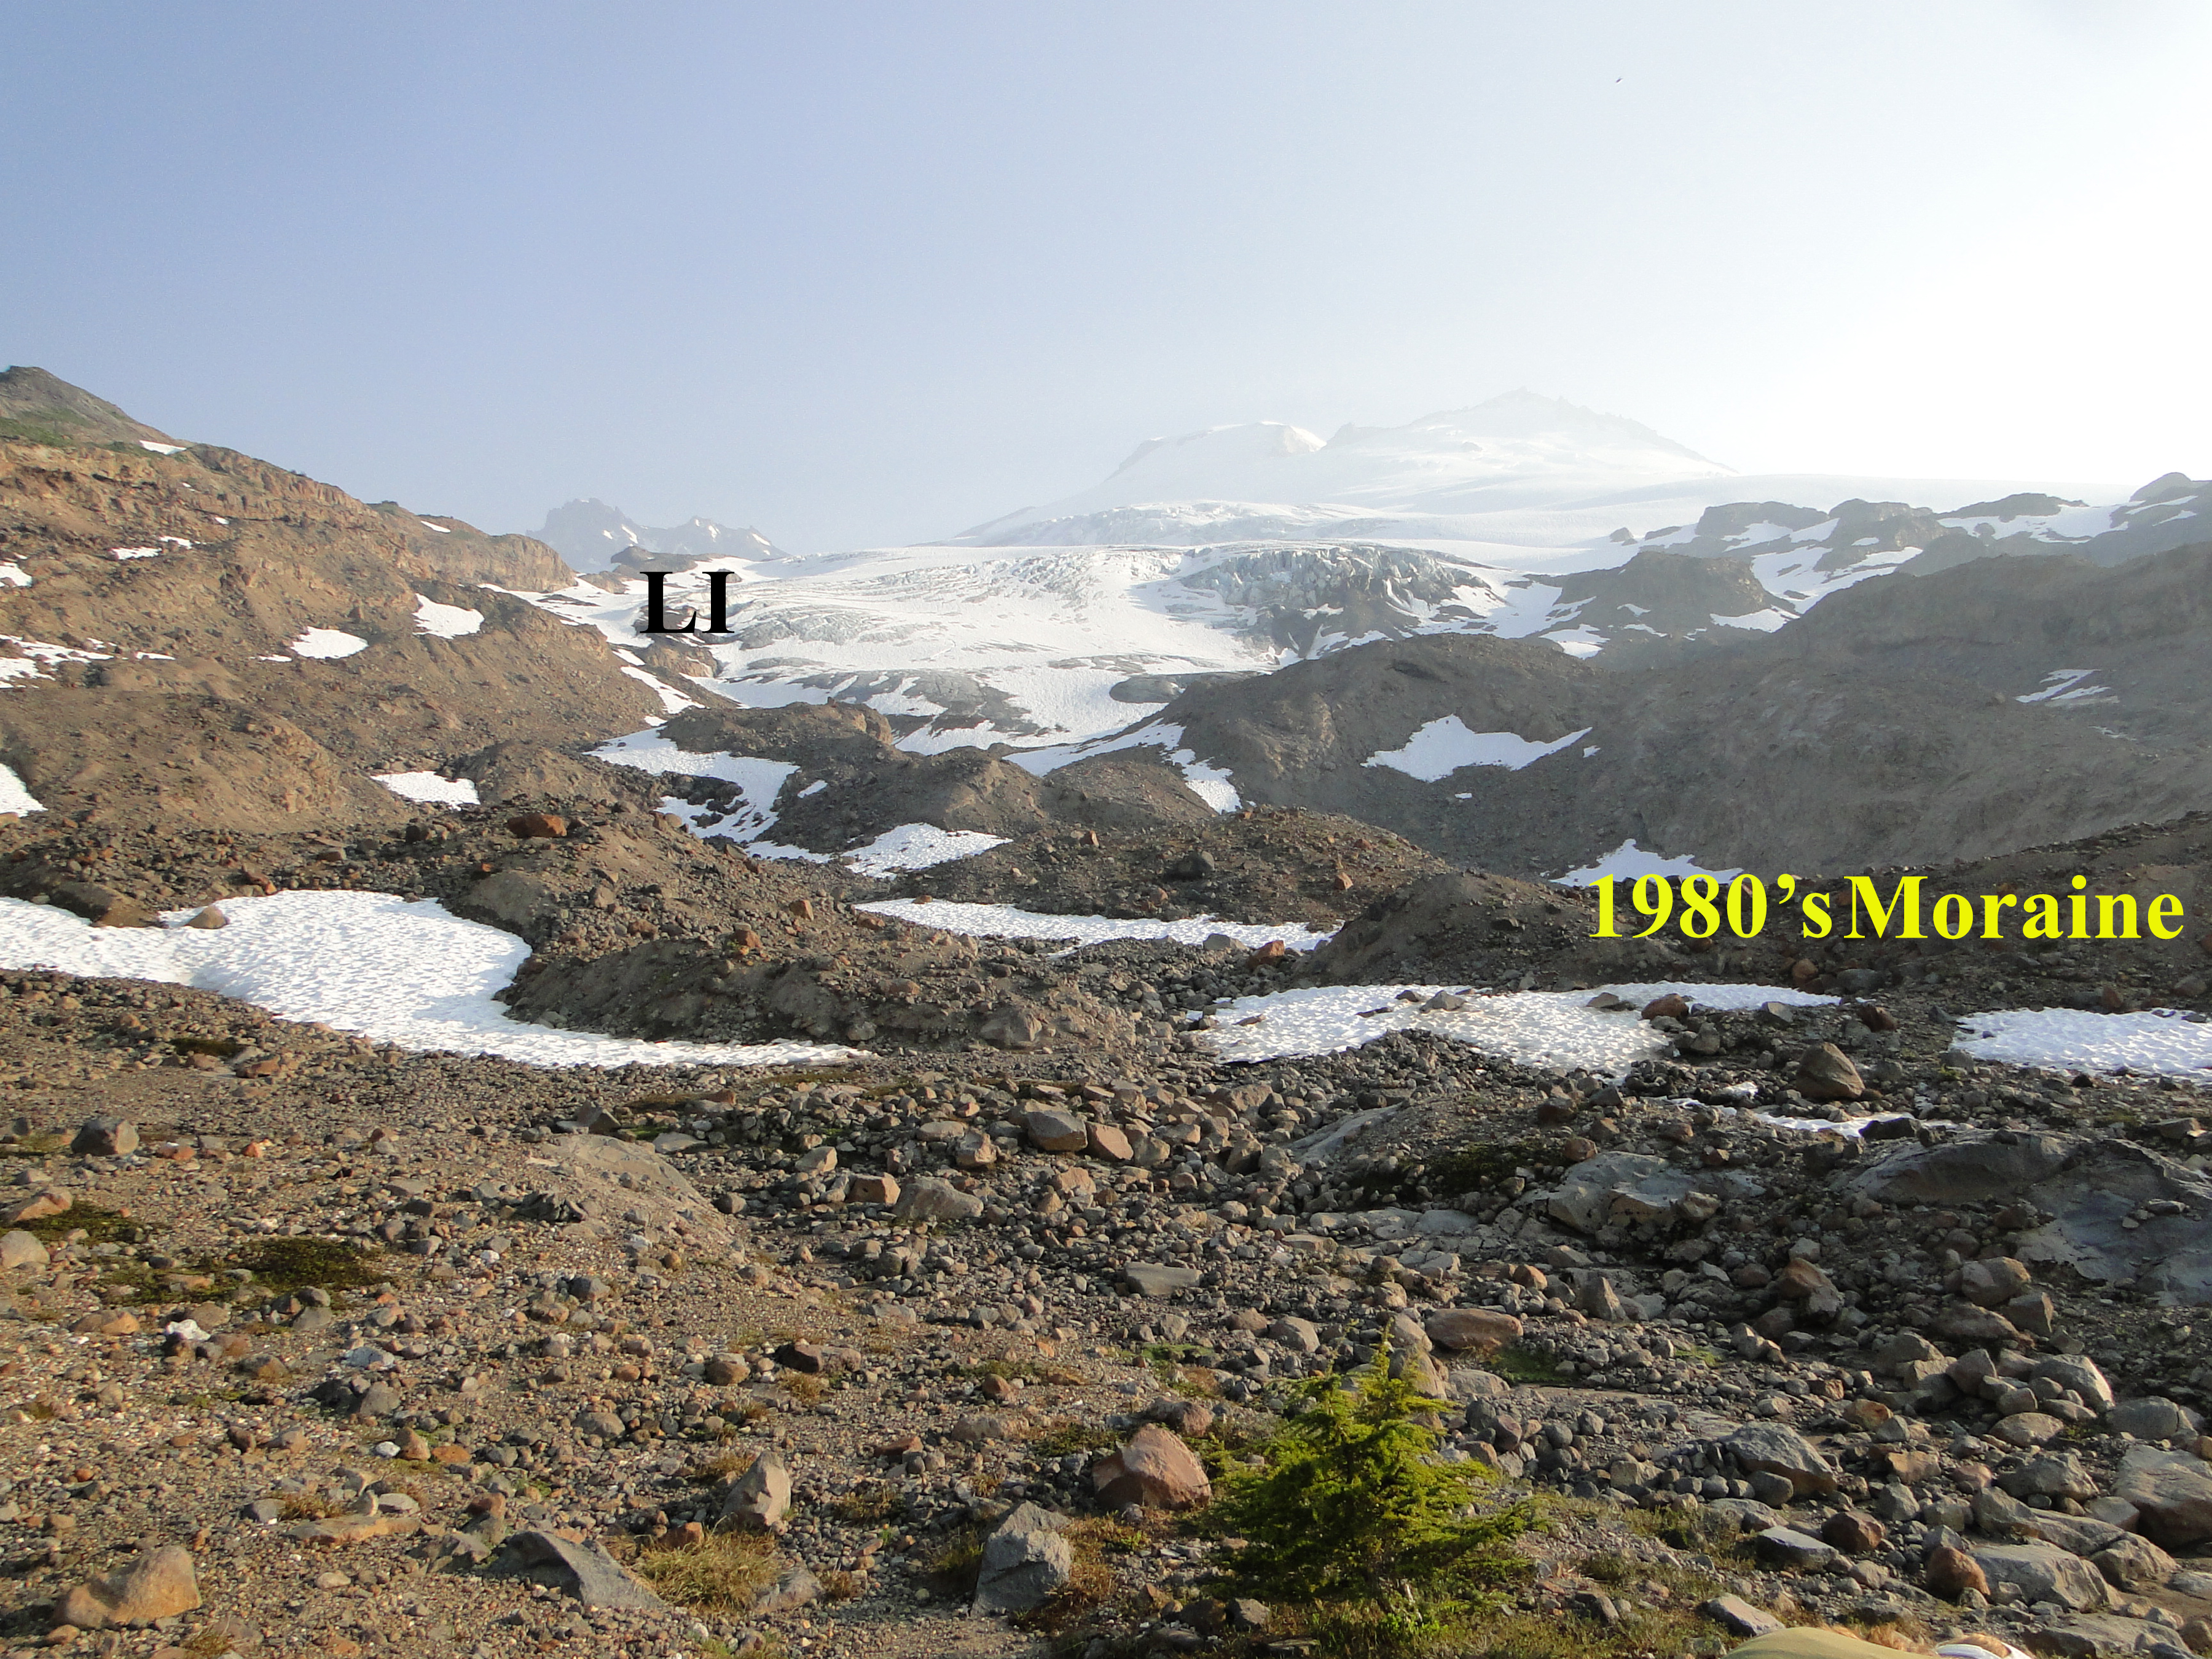
Easton Terminus viewed from our benchmark location just beyond 1980’s margin. Tree in foreground is over 50 years old.

