Blondujökull, Iceland Retreat Exposes Broad Landscape

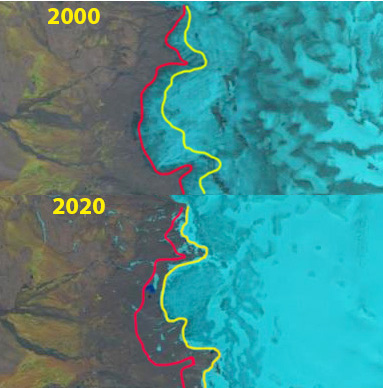
Blöndujökull in Landsat images from 2000 and 2020 illustrating terminus position, yellow line is 2020 and red line is 2000.

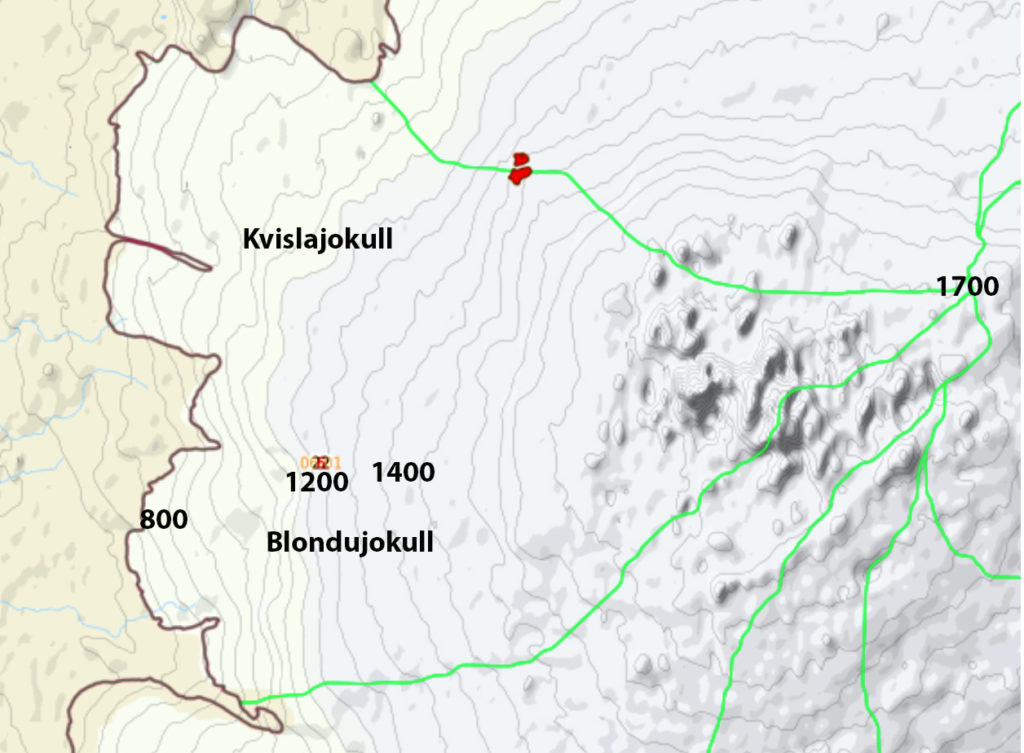
Blöndujökull  is an outlet glacier on the west side of Hofsjökull, Iceland. The National Land Survey of Iceland has developed a DEM application that provides a detailed view of the islands glaciers and their immediate landscape. Johannesson (1997) reported the response time for Blöndujökull  to a climate change as ~90-100 years, with significant warming beginning in 1985. Since 1995 Hofsjökull has had only two years with a positive mass balance (Aðalgeirsdóttir et al 2020).  They further report the ice cap has lost 56 m w.e. from 1890-2019 with ~50% of that loss since 1995. Belart et al (2019) reported near equilibrium conditions for 14 Icelandic glaciers from 1960-1994 and mass losses of ~-1.2 m w.e. per year from 1994-2010.The ice cap geometry leads to the maximum area being in the terminus zone.  The result is instead of a larger retreat distance of a narrow outlet terminus with a limited area loss, there is a smaller retreat distance with a large area loss (see below).  This leads to divergent flow at the terminus, which also enable better formation and preservation of glacial deposits as there is limited glacial runoff reworking. Here we examine the response of this outlet glacier using Landsat imagery from 2000-2020.

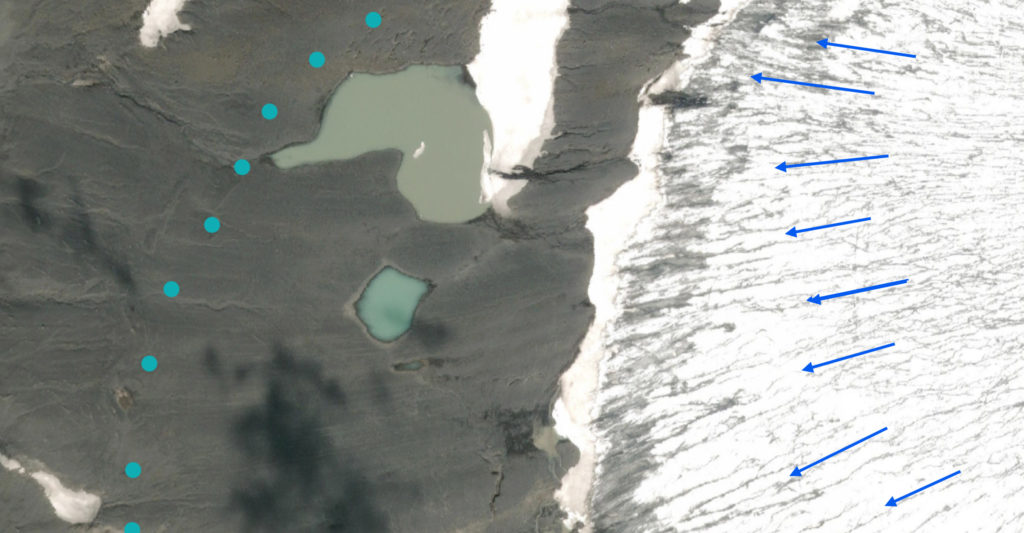
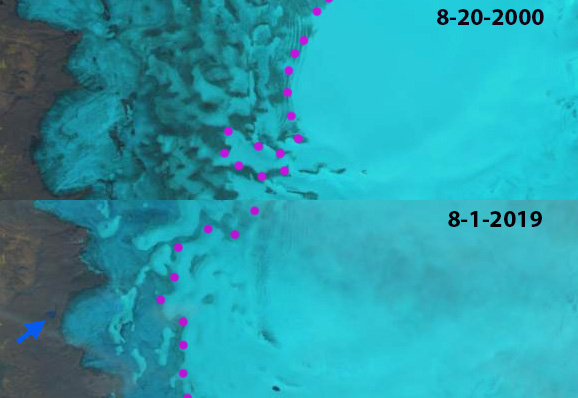
Blöndujökull in 2000 ends on a gently sloping at ~750 m and has no proglacial lake near the terminus.  The snowline is a patchwork  at ~1550 m this leads to an accumulation area ratio of  ~25%.  In 2019 the glacier has retreated exposing a proglacial lakes.  The snowline in 2019 is at 1200 m at the start of August.  A close up view of the proglacial lake using the National Land Survey of Iceland, also indicates the flow directions parallel the supraglacial streams. The image also reveals the fluted moraine on the newly deglaciated terrain. By 2020 the terminus has retreated on average ~550 m. This has exposed an area of nearly 4 km2 of deglaciated terrain.

Retreat has been the consistent response of more than 90% of  Iceland glaciers since 2000 (Iceland Glaciological Society), including the outlets of Hofsjökull, Tungnafellsjökull and NorðurjökullAðalgeirsdóttir et al (2020) note that mass losses of the largest Iceland Ice Caps has tripled from the 1900-1990 period to the 1995-2019 period, which give the response time noted earlier illustrates the glaciers are still far from having adjusted to the climate of the 1990-2020 period.

Terminus of Blöndujökull in National Land Survey of Iceland orthophoto. Flow direction indicated by blue arrow, which parallel supraglacial streams and which are also diverging. Blue dots indicate the 2000 terminus position with the new proglacial lakes evident.


Blöndujökull in Landsat image from 2000 and 2019 illustrating snowline-purple dots.

Kvislajökull and Blöndujökull drainage basin on Hofsjökull in GLIMS. Note the expanding width of the basin from the summit to terminus.

Lemon Creek Glacier 2018 Ablation and Glacier Runoff

Lemon Creek Glacier (L) with the snowline (black line) indicated in Landsat images from July 5, July 30 and Sept. 16 2018. P=Ptarmigan Glacier, T=Thomas Glacier, red arrow is the 1948 terminus location. A,B and C mark firn horizons exposed by the loss of all snowpack in the accumulation zone.

The summer of 2018 was exceptional for warmth in Southeast Alaska.  July was the most unusual with Juneau recording daily highs above 70 F on 18 days, including 12 consecutive days at the end of the month.  The average temperature in July in Juneau was 2.4 C above average and the warmest average monthly temperature in history. Precipitation was recorded on just 6 days of precipitation at the Long Lake SNOTEL site in the mountains near Juneau. This resulted in the highest observed snowline of the 70 year record on Taku Glacier, a 25 km2 snow swamp developing in three days on Lowell Glacier and the loss of all snowpack on Lemon Creek Glacier.  For a glacier to be in equilibrium most glaciers need to be more than 50% snowcovered.  On Lemon Creek Glacier at the end of the summer the glacier must be covered 62% to be in equilibrium (Pelto et al 2013).  The Lemon Creek Glacier is a reference glacier of the World Glacier Monitoring Service, with mass balance measured since 1953 by the Juneau Icefield Research Program (JIRP).  The USGS began monitoring the glacier in 2016 and currently reports mass balance to WGMS, Chris McNeil (USGS) is leading a reanalysis of the mass balance record. The cumulative mass loss from 1953-2018 is ~37 m w.e, with 2018 having the most negative balance of -2.31 m w.e. The area of the glacier has declined from 12.8 square kilometers in 1948 to 9.7 square kilometers in 2018, a 24% decline.  For the glacier to provide an equivalent runoff ablation rates would have had to rise by 24%.

In 2018 on July 5 2018 the snowline on Lemon Creek Glacier was at 950 m.  From July 4-6 a series of snowpits were dug on the glacier by JIRP yielding a retained snowpack ranging from 0.9 m (water equivalent=w.e.) to 1.2 m (w.e.).  One of the snowpits with 0.9 m w.e. was at 1075 m.  On July 30 the snowline had reached 1100 m, indicating approximately 0.9 m of snow ablation in that 21 day interval. Because ice ablates faster than snow, 36% faster on Lemon Creek Glacier this would equate to  ~1.2 m of ice ablation. By September 2 the snowline had risen above the top of the glacier, with one small snowpatch in the northwest corner at 1200 m, firn horizon exposed by snowpack loss are evident .  This remains the case in the Sept. 16 image.  The small snowpatch also melted away by the end of September.  There was no accumulation zone for the third time in the last five years,indicating this glacier cannot survive current climate (Pelto, 2010).

The consistency of the balance gradient, seen below from year to year allows for determination of melt rates and runoff based on the rise of the snowline.  The transient snow line migration rate times the balance gradient yields ablation rate at the snowline (Pelto, 2011). The impact of a greater area of surface ice exposed is increased ablation.  To illustrate this impact if we as an example take a day with a mean temperature of 10 C:

This would yield 350,000 m3 of melt on July 5, the glacier was 23% bare ice and 77% snow cover on this date.

This would yield 382,000 m3 of melt on July 30, the glacier was 41% bare ice and 59% snow cover on this date.

This would yield 480,000 m3 of melt on Sept. 16, the glacier was 97% bare ice/old firn and 3% snow cover on this date.

The actual July 5 temperature for Lemon Creek Glacier was 12 C. This yields 420,000 m3 of runoff.

The actual July 30 temperature for Lemon Creek Glacier was 11.5 C. This yields 440,000 m3 of runoff.

The actual Sept. 16 temperature for Lemon Creek Glacier was 1.5 C. This yields 72,000 m3 of runoff.

Base map of Lemon Creek Glacier from 2014 prepared by Chris McNeil (JIRP and USGS).  The blue dots are JIRP 2018 snowpit locations and the lines are the snowline on the respective dates. Camp 17 is the JIRP camp used for Lemon Creek Glacier research, including the upcoming 2019 field season.

USGS topographic map based on 1948 aerial photographs. On right is the hillshade image from 2011, margin is the black dots.

Image of the glacier on 9/2/2018 indicating firn horizons and the small remaining snowpack in the southwest corner.

Balance gradient of Lemon Creek Glacier, note the consistency.