Lumding Glacier Rapid Retreat, Nepal 1992-2016

Landsat comparison of Lumding Glacier terminating in Lumding Tsho. Red arrow on each Landsat image indicates 1992 terminus and yellow arrow 2016 terminus location.

Lumding Glacier, Nepal terminates in Lumding Tsho, a proglacial lake, in Dudh Khosi Valley in the Mount Everest region of Nepal. This lake poses a hazard for a glacier lake outburst flood in the Dudh Khosi valley. The lake expansion results from retreat of the Lumding Glacier. International Centre for Integrated Mountain Development (ICIMOD) study examined the changes in Lumding Tsho from 1962-2000 and found the lake grew from 0.2 km2 in 1962 to 0.77 km2 in 2000. ICIMOD has an ongoing specific focus on assessing glacier lake outburst flood potential. The lake growth was the result of a retreat of 40 meters/year from 1976-2000 and 35 meters/year from 1962-2007, as noted in figure below from Bajracharya  & Mool (2009). Here we update the changes to 2016 using Landsat imagery.

The lake begins at the end of the heavily debris covered Lumding Glacier draining east from Numbur Himal . Red arrow on each Landsat image indicates 1992 terminus and yellow arrow 2016 terminus location. The lake was 1675 meters long in 1992, 1950  meters long in 2000, 2350 meters long in 2009 and 2800 meters in 2016. This 1100 m retreat in 25 years is a retreat rate of 45 meters/year. The lake at 2.8 km in length now has an area of over 1 square kilometer. The glacier is fed largely by avalanching off the flanks of Numbur, blue arrows. King et al (2017) noted a mean mass balance of all 32 glaciers examined in the Mt. Everest region from 2000-15 was  −0.52  water equivalent per year. The mean mass balance of nine lacustrine terminating glaciers, like Lumding Glacier, was 32 % more negative than land-terminating debris-covered glaciers.  An additional problem for the glacier in the future is the retreat of the terminus of the tributary glaciers that avalanche onto the lower Lumding Glacier. The yellow letter A in the 2016 Sentinel images indicates the retreat of a feeder glaciers, 300 m since 1992.  The lower section of the Lumding Glacier is heavily debris covered, noted best in Google Earth image, which insulates the underlying ice, reducing melting and retreat. This also indicates the avalanche source of much of the accumulating snow and ice. The increased distance to the feeding snow and ice slopes will reduce this input.  The two blue arrows indicate plumes of glacier runoff into the lake.  This glacier loss in mass driving the retreat is like that on Hinku Nup Glacier and Middle Lhonak Glacier

A 2016 Sentinel image of Lumding Glacier with avalanche paths shown by blue arrows, and retreating tributary above Point A.

Google Earth image of Lumding Glacier front.  This illustrates the debris cover and also meltwater plumes entering lake. 

Hinku Nup, Nepal Downwasting Lake Development

Hinku Nup Glacier in November 2016 Sentinel 2 image.  Yellow arrows indicate three supraglacial lakes that have formed.  

Hinku Nup is a valley glacier in the Dudh Khosi basin in the Mount Everest region of Nepal.  The glacier is heavily debris covered in its lowest 4 km which is a low slope section extending from 5100-4900 m.  In 1992 Landsat images there are only small supraglacial lakes, less than 100 m across on the glacier surface.  In 2000 this remains the case on Hinku Nup proper, though a lake has formed at the terminus of a former tributary, northwest yellow arrow.  By 2013 a lake has formed at the junction of Hinku Nup and Hinku Shar Glacier and a lake near the terminus of the glacier.  By 2016 the terminus lake has expanded to a length of 600 m.  There are a series of lakes that appear ready to coalesce that will extend the lake to 800 m in length, smaller yellow arrow.  The lake at the junction of Hinku Nup and Hinku Shar is 200 m across in 2016.  The proglacial lake at the terminus of the former tributary to Hinku Nup is now 500 m wide and 400 m long.  The coalescing of the lakes near the terminus will lead to the formation of lake large enough to enhance melting and lead to calving.  This should lead soon to a rapid retreat of the terminus, such as occurred on nearby Lumding Glacier.  Glacier lakes have been inventories by ICIMOD, who found little change in glacier lake area from 2001 to 2009 but a sharp decrease in the number of lakes, primarily due to coalescing.  The lake here lacks the clearcut moraine dam that exists on Thulagi Glacier and typifies glaciers that pose a Glacier lake outburst flood hazard.

King et al (2017) noted a mean mass balance of all 32 glaciers examined in the Mt. Everest region from 2000-15 was  −0.52  water equivalent per year. The mean mass balance of nine lacustrine terminating glaciers was 32 % more negative than land-terminating, debris-covered glaciers.  This mass loss is what has been driving the widespread glacier retreat in the region.  Bajracharya and Mool (2009) noted the glaciers in the Mount Everest region retreated at a rate of 10–59 m/year from 1976-2009.

[ngg_images source=”galleries” container_ids=”9″ display_type=”photocrati-nextgen_basic_imagebrowser” ajax_pagination=”1″ template=”/nas/wp/www/sites/blogsorg/wp-content/plugins/nextgen-gallery/products/photocrati_nextgen/modules/ngglegacy/view/imagebrowser-caption.php” order_by=”sortorder” order_direction=”ASC” returns=”included” maximum_entity_count=”500″]

Thulagi Glacier, Nepal Retreat and GLOF Potential


thulagi-compare

Thulagi Glacier change in Landsat images from 1991 and 2016.  Red arrow is 1991 terminus, yellow arrow 2016 terminus and purple arrow increasingly exposed bedrock rib amidst icefall.

Written With Prajjwal Panday: @prajjwalpanday

Thulagi Glacier terminates in a lake referred to both as Thulagi and Dona Lake. ICIMOD (2011) has identified this as a potential threat for a glacier lake outburst flood (GLOF) and has conducted extensive fieldwork there.  Thulagi Lake is southwest of Mt..Manaslu in western Nepal at an altitude of 4,044 masl. Here we report on the identified threat and use Landsat imagery to identify changes in the glacier. Thulagi Lake has attracted much attention because two hydropower projects have been developed downstream on the Marsyangdi river basin, Marsyangdi Hydropower Project (69MW) and the Middle Marsyangdi Hydropower Project (70MW). Thulagi Lake began to form about 50 years ago and ICIMOD present field investigations showed that from 1995 to 2009, the length of Thulagi Lake had increased from 1.97 to 2.54 km, due to retreat and the lake area increased from 0.76 to 0.94 sq.km. ICIMOD (2011) did a bathymetric survey of Thulagi Lake using an inflatable boat. The volume was calculated to be 35.3 million cu.m in 2009 an increase from 31.75 million cu.m in 1995. The small increase despite significant area increase was because of a surface elevation lowering rate from 2003-2009  of 0.3 to 0.5 m/yr. They found the moraine walls were sinking, but more slowly at a rate of about 0.1 m/yr:  The glacier experienced substantial retreat of 1.65 km from 1958 to 1995.

From 1991 to 2016 the glacier has retreated 750 m a rate of 30 m/year.  The debris cover extends from the terminus 4.25 km upglacier  to 4500 m.  The low slope indicates the lake will continue to expand and the rate retreat should remain high. The bedrock rib is in the icefall that extends from 5600 m to 4600 m, purple arrow. The rock rib at 5000 m in the midst of the icefall is more exposed in Landsat images from 2012 to present than from 1988-2001.  This suggests some thinning.  All images indicate snowcover is persistent above 5800 m. The glacier terminus continues to calve into the lake as seen in the 2012 Google Earth Image, the 40 m high ice front calves only small icebergs that ICIMOD did not deem sufficiently large to trigger a GLOF event by the surge waves. They also noted that temporary blockage of the lake outlet by river ice, snow barriers, or lake ice debris, appears unlike.

Khanal et al (2015) examined the total value at risk under the modeled GLOF scenario of US $406.73 million for Thulagi. The estimated maximum flow was 4736 m3 /second for Thulagi. The majority of this potential damage was to the two hydropower projects.  They noted 125 buildings and  100 acres of irrigated land at risk. A group of Nepali and US scientists carried out stability assessment of Thulagi Lake and its moraine after the April 2015 7.8 magnitude earthquake (USAID, 2015). They noted that the main moraine complex at the end of the lake is relatively stable (black arrow), while the end moraine is less stable (purple arrow). The earthquake caused some slumping of the outlet at the terminal moraine and some deterioration of this moraine. Overall the hazard due to the declining water level would offset some or all of this moraine deterioration in terms of overall risk of a GLOF. Although local people are aware of the deteriorating nature of the terminal moraine at Thulagi, community discussions revealed less concern regarding the possibility of an outburst flood (USAID 2015). However, there is a demand for risk reduction activities such as installation of early warning systems, lowering of lake levels, and development of community-based disaster response plans. There is a general consensus for a science-base community driven approach to address and find solutions for these types of lakes where communities and stakeholders participate starting from research to action.

The retreat of Thulagi Glacier is similar but less rapid than many Himalayan glaciers terminating in lakes; Thong Wuk, West Barun, Lumding and Lhonak

middle-marsyangdi

Middle Marsyangdi Hydropower Station and reservoir in Google Earth

marsyandi

Marsyangdi Hydropower Station and reservoir in Google Earth

thulagi-outlet-copy

Thulagi Lake outlet.  Black arrow points to main moraine complex.  Purple arrow to the less stable terminal moraine.

thulagi-ge

Thulagi Lake in 2012 Google Earth image.  Yellow arrow is recently calved ice and purple arrow indicates bedrock within icefall.

West Hongu Glacier Retreat-Ablation Extending into January, Nepal

hongo compare

Landsat comparison of West Hongu Glacier snowline, purple dots from October 2015 to January 2016. The red arrow indicates the 1993 active terminus location and the yellow arrow the 2015 active terminus location. 

West Hongu Glacier is a small glacier in the Dudh Khosi Basin of Nepal. The glacier drains the east side of Ama Dablam Peak. Shea et al (2015) noted that glaciers in the Dudh Khosi Basin of Nepal lost 16% of total volume and 20% of area from 1961-2007. Shea et al (2015), in an ICIMOD project, modeled future changes in glaciers with various climate scenarios, finding a minimum projected volume change by 2050 of −26 % and maximum of −70 %. This glacier is a short distance from Mera Glacier where mass balance is measured.  Both are summer accumulation type glaciers with 80% of annual precipitation occurring during the summer monsoon season. Salerno et al (2015)  found that the main and most significant increase in temperature is concentrated outside of the monsoon period, leading to more ablation favoured during winter and spring months, and year around close to the glacier terminus. The lake at the end of the glacier is unnamed and not listed as one of 20 lakes recorded as potentially unstable and warranting further investigation in Nepal (Ives et al., 2010). ICIMOD has continued to inventory and assess the hazards from glacier lakes and their capacity to induce outburst floods.  ICIMOD notes the area of the lake is 0.366 square kilometers.

Here we examine the snowline from fall into winter in 2015/16. Above is the comparison indicating the rise of the snowline from October into January. This has been a common occurrence in recent years, indicating that ablation though limited, continues in the post-monsoon into the mid-winter period. The snowline rises from 5550-5600 m in October to 5650-5700 m in January. Besides ongoing ablation into January, the high snowline illustrates the lack of significant accumulation at any elevation on the glacier in the post Monsoon period extending into January. The snowline remained high on Jan.20, 2016, but the image has considerable cloud cover. This tendency has been noted at Nup La-West Rongbuk Glacier, on the Nepal-China border, Chutanjima Glacier, China and Lhonak Glacier, Sikkim.

Below the active ice terminus change from 1993-2013 is noted.  The active ice ended on the shore of the lake in 1993, red arrow.  By 2013 the active ice has retreated 500 m from the lake, yellow arrow. There is still debris covered stagnant ice in this zone. The inactive ice is dissected by significant stream channels that cannot develop in an area of active ice. Some of the stream channels have cut to the base of the glacier.

hongu terminus

Comparison of active terminus location from 1993-2013 in Landsat images. The red arrow indicates the 1993 active terminus location and the yellow arrow the 2015 active terminus location.hongu glaceri terminus 2013

Terminus of West Hongu Glacier inn 2013. Yellow arrows indicate the stream channels cutting through the debris covered inactive ice.Map below indicates glacier ending in the lake.

west hongu map

Kanchenjunga Glacier, Nepal Volume Losses

kanchenjunga compare
Figure 10-16. Kanchenjunga Glacier (K) from 1991 to 2015, green arrows indicate locations of enhanced supraglacial lakes since 1991. Purple arrow indicates areas of thinning at higher elevations in the region. Location 2 is the main junction area. 

Kanchenjunga Glacier is the main glacier draining west from Kanchenjunga Peak, also listed on maps as Kumbukarni. The glacier is similar to Zemu Glacier flowing east from the same mountain into Sikkim, in the heavy debris cover that dominates the glacier in the ablation zone extending from the terminus for 15 km and an altitude of 5600 m. Identifying the retreat is difficult due to the debris cover. Racoviteanu et al (2015) examined glaciers in this region using 1962 and 2000 imagery. They found area losses of 14% for debris covered glacier and 34% for clean glaciers. The debris covered glaciers terminus response is even more muted indicating why terminus change is an easy measure of glacier change but not always the best. For Kanchenjunga Glacier Racoviteanu et al (2015) indicate the glacier area declined by just 4-8% from 1962-2000.

What is apparent in the Landsat images at the green arrows is the increase from 1991 to 2015 of supraglacial lakes. Also features of thinning are evident in the mid reaches of the glacier, purple arrows, where tributaries have narrowed and detached from the main glacier. A closeup of the main glacier junction 12 km above the terminus indicates the number of large supraglacial lakes. These cannot form in a region where melting does not dominate over glacier motion. The Google Earth image from 2014 of the terminus area indicates a patchwork of moraine cored ice dotted with supraglacial lakes and dissected by the glacial outlet river in the lower 3 km of the glacier. This is clearly not an active portion of the glacier, it is thin not moving and does not fill even the valley floor. An overlay of images indicates the lack of motion. The heavy debris cover has slowed retreat and thinning, however, the lower glacier is poised for an increased rate of retreat with merging of supraglacial lakes, which will lead to further area losses. The Kanchenjunga Glacier is losing volume like all other 41 glaciers examined in detail and linked at the Himalayan Glacier Index page. 

kanchenjunga glacier jct

Google Earth image of the main glacier junction region (2) Supraglacial lakes in the area of at 5200 m. 


kanchenjunga glacier

Google Earth image of supraglacial lakes 2-5 km above the terminus and the region along the north margin of the glacier where the glacier is receding from the lateral moraine. 

kanchenjunga terminus

2014 Google Earth image of terminus reach.  Black arrows indicate ice cored moraine, blue arrow the lowest large supraglacial lake, 2.5 km above the terminus and red arrow the last remnant of ice. 

Nobuk Glacier Retreat, Tamor Basin, Nepal

At the headwaters of the Tamor Basin in eastern Nepal is an unnamed glacier that terminates in an expanding glacial lake. The glacier is referred to as “Nobuk” Glacier here in reference to the nearby named peak on the map. The glacier is upstream of a Chheche Pokhari a lake formed by a glacier outburst flood in 1980. Two arms of the glacier both avalanche fed from the steep border peaks with Tibet. ICIMOD has recently finished a detailed inventory of glacier change in Nepal since 1980. In the Tamor basin they indicate glacier area from 2000 to 2010 has declined from 422 square kilometers to 386 square kilometers. nobuk map
Topographic map showing lake and glacier flow paths

nobuk glacier ge
Google Earth image of area

Here the glacier is examined from 1989 to 2013 using Landsat images. In 1989 the lake had several developing areas amidst the decaying glacier ice, but the glacier still reached to the far eastern shore of the lake. By 2000 Nobuk Glacier terminates at a southeast turn on the south side of the glacial lake it terminates in, red arrow, 500 m from the 1989 terminus. The glacier is fed by two arms, the southern arm has a steeper icefall near the terminus and is narrower. The two arms of the glacier are separated by a buttress, marked with a Pink Point A. This buttress is 750 m from the debris covered ice front. By 2009 the glacier two arms of the glacier are separate and the southern arm no longer reaches the lake. The glacier front has retreated back to the base of the buttress at Point A. By 2013 the lake has more than doubled in length and area since 2000, red arrow at 2000 terminus in each image. The southern arm terminates 150 m from the lake and the debris covered northern arm, though still ending in the lake, it is a very thin low slope terminus that appears to be close to retreating from the lake basin that the glacier has carved. This is evident in the 2010 Google Earth image. The glacier has retreated 500 m from 2000 to 2013. The lake is now 1 km long and has an area of 0.4 square kilometers. The retreat matches that of most Nepal glaciers. This glacier was noted as shrinking from 2.3 to 1.4 square kilometers in area from 1980-2010 by the ICIMOD glacier inventory, they documented a 24% loss in area and 29% in volume during this interval For Nepal’s glaciers. Individual glacier such as Lumding, West Barun, Imja, and Ngozumpa.
nobuk 1989
1989 Landsat image
nobuk 2000
2000 Landsat image

nobuk 2001
2001 Landsat image

nobuk 2009
Landsat image 2009

nobuk 2013
Landsat image 2013

nobuk terminus
Google Earth image 2010

West Barun Glacier Retreat Lake Expansion, Nepal

The West Barun Glacier flows southwest from Baruntse Peak at 7100 meters ending at Barun Khola (lake) at 4500 meters. Comparison of images from 1992, 2003 and 2009 indicate the retreat of the glacier and expansion of the lake. In the early 1990’s the lake was observed to be 1100 meters long with an area of 0.66 square kilometers (ICIMOD, 2010). In 2003 the lake was 1500 meters long. In 2009 the lake was 2000 meters long and had an area of 1.4 square kilometers having doubled in size. In 2013 the maximum length of the lake is 2700 m and the area 1.5 to 1.6 square kilometers. The importance of such lakes impounded in part by moraines, is the potential for glacier lake outburst floods (GLOF). The Barun Khola has no specific date for a GLOF observed, but does pose a risk and has produced floods as indicated by Pradeep Mool (2001) in Figure 1 of the ICIMOD (2010) report, reproduced here, Band C are Barun Khola. ICIMOD has examined this hazard extensively in Nepal and particularly the Dudh Khosi Basin. To date the Dudh Khosi does not have main stem hydropower, but a 210 MW plant is in development. An examination of Landsat imagery from 1992 and 2009 along with Google Earth imagery from 2003 and 2009 is used to identify the retreat. The red line in the Google earth images is the 1992 terminus, the orange line the 2003 terminus and the green line the 2009 terminus. The glacier is outlined in magenta in the Landsat images. The glacier retreated 270 meters, 25 m/year), from 1992 to 2003. From 2003 to 2009 the glacier retreated an additional 480 meter, 80 meters per year. In the 2013 Landsat image the southern portion of the terminus has not markedly retreated since 2009, but the lake expansion continues on the northern shore of the lake., pink arrow.
1992 Landsat image

2003 Google earth image

2009 Google Earth image

2009 Landsat image
barun glacier 2013
2013 Landsat image

A closeup view of the terminus from Google Earth indicates lots of icebergs near the ice front, magenta arrows. The icebergs in the Landsat image later in 2009 have drifted further from the glacier. The angular nature of the icebergs indicates recent large calving event. There are also some small lakes on the surface of the glacier, yellow arrows.
This glaciers retreat and lake expansion is like the nearby North Lhonak Glacier, Middle Lhonak Glacier, Imja Glacier and Nobuk Glacier.

Himalaya Glacier Index

Himalaya-Pamir-Hindu Kush-Tien Shan-Quilian-Karakoram Range Glacier Change

Below is a list of individual glaciers in the Himalaya and high mountains of Central Asia that illustrate what is happening glacier by glacier. In addition to the individual sample glaciers we tie the individual glaciers to the large scale changes of approximately 10,000 glaciers that have been examined in repeat satellite image inventories. In the high mountains of Central Asia detailed glacier mapping inventories, from GLIMS: (Global Land Ice Measurements from Space), ICIMOD (International Centre for Integrated Mountain Development), ISRO ( Indian Space Research Organisation) and Chinese National Committee for International Association of Cryospheric Science (IACS) of thousands of glaciers have indicated increased strong thinning and area loss since 1990 throughout the region except the Karokoram. The inventories rely on repeat imagery from ASTER, Corona, Landsat, IKONOS and SPOT imagery. It is simply not possible to make observations
on this number of glaciers in the field.

Reqiang Glacier, Tibet———-Ngozumpa Glacier, Nepal
Samudra Tupa, India———-Zemu Glacier, Sikkim
Theri Kang Glacier, Bhutan———-Zemestan Glacier, Afghanistan
Khumbu Glacier, Nepal———-Imja Glacier, Nepal
Gangotri Glacier, India———–Milam Glacier, India
Satopanth Glacier, India———-Kali Gandaki Headwaters, Nepal
Menlung Glacier, Tibet———-Boshula Glaciers, Tibet
Urumquihe Glacier, Tibet———-Sara Umaga Glacier, India
Dzhungharia Alatau, Kazakhstan———-Petrov Glacier,Kyrgyzstan
West Barun Glacier, Nepal—–Malana Glacier, India
Warwan Basin, India—–North Lhonak Glacier, Sikkim
Changsang Glacier, Sikkim——Emend River Headwaters, Afghanistan
Yajun Peak Glacier, Afghanistan—–Godur Glaicer, Pakistan
Tirich Mir, Pakistan—–Longbasba Glacier, Tibet
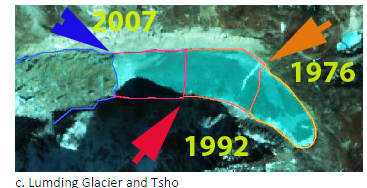
Lumding Glacier, Tibet—-Rongbuk Glacier, Tibet
Matsang Tsanpo Glacier, Tibet——-Sepu Kangri, China
Jiongla Glacier, Tibet—-Bode Zanbo Headwaters, Tibet
Zayul Chu Headwaters, TibetHkakabo Razi, Myanmar.
Jaonli Glacier, India
In the Russian Altai mapping of 126 glaciers indicate a 19.7 % reduction in glacier area 1952-2004, with a sharp increase after 1997 (Shahgedanova et al., 2010). In Garhwal Himalaya, India, of 58 glaciers examined from 1990-2006 area loss was 6% (Bhambri et al, 2011). They also noted the number of glaciers increased from 69 (1968) to 75 (2006) due to the disintegration of ice bodies. Examination of 466 glaciers in the Chenab, Parbati and Baspa Basin, India found a 21% decline in glacier area from 1962 to 2004 (Kulkarni, 2007). Glacier fragmentation was also observed in this study, which for some fragments represents a loss of the accumulation area, which means the glacier will not survive (Pelto, 2010). The India glacier inventory (ISRO, 2010) identified glacier area losses and frontal change on 2190 glaciers and found an area loss rate of 3.3% per decade and 76% of glaciers retreating. In the Nepal Himalaya area loss of 3808 glaciers from 1963-2009 is nearly 20% (Bajracharya et al., 2011). The Langtang sub-basin is a small northeast-southwest elongated basin, tributary of Trishuli River north of Kathmandu and bordered with China to the north. The basin contained 192 km2 of glacier area in 1977, 171 km2 in 1988, 152 km2 in 2000 and 142 km2 in 2009. In 32 years from 1977 to 2009 the glacier area declined by 26% (Bajracharya et al., 2011). In the Khumbu region, Nepal volume losses increased from an average of 320 mm/yr 1962-2002 to 790 mm/yr from 2002-2007, including area losses at the highest elevation on the glaciers (Bolch et al., 2011). The high elevation loss is also noted in Tibet on Naimona’nyi Glacier which has not retained accumulation even at 6000 meters. This indicates a lack of high altitude snow-ice gain (Kehrwald et al, 2008). The Dudh Koshi basin is the largest glacierized basin in Nepal. It has 278 glaciers of which 40, amounting to 70% of the area, are valley-type. Almost all the glaciers are retreating at rates of 10–59 m/year and the rate has accelerated after 2001 (Bajracharya and Mool, 2009). In the Tien Shan Range over 1700 glaciers were examined from 1970-2000 glacier area decreased by 13%, from 2000-2007 glacier area shrank by 4% a faster rate than from 1970-2000 (Narama et al, 2010).

An inventory of 308 glaciers in the Nam Co Basin, Tibet, noted an increased loss of area for the 2001-2009 period, 6% area loss (Bolch et al., 2010). Zhou et al (2009) looking at the Nianchu River basin southern Tibet found a 5% area loss. 1990-2005. Cao et al, (2010) completed an inventory of 244 glaciers in Lenglongling Range of Eastern Qilian Mountains from 1972 to 2007 and found a 23.5% loss in glacier area. The highest rate of 1% per year of area loss was identified from 2000 to 2007. In the Pumqu Basin, Tibet an inventory of 999 glacier from the 1974 & 1983 to 2001 indicated the loss of 9% of the glacier area and 10% of the glaciers disappeared (Jin et al, 2005).

Pan et al (2011) looking at the Gongga Mountains, China found a 11.3% area loss from 1966-2009. In the Wakhan Corridor, Pamir Range, Afghanistan 30 glaciers were examined over a 27 year period, 1976-2003, indicating that 28 of the glacier retreated with an average retreat of 294 m, just over 10 meters/yr (Haritashya, et al., 2009). The Karokoram is the one range where a mix of expansion and retreat is seen. The anomalous expansions are confined to the highest relief glaciers and appeared suddenly and sporadically (Hewitt, 2005). After decades of decline, glaciers in the highest parts of the central Karakoram expanded, advanced, and thickened in the late 1990s. Many of the largest glaciers in the Karakoram are still retreating including the Baltoro, Panmah and Biafo Glacier, albeit slowly (Hewitt, 2011).

A new means of assessing glacier volume is GRACE, which cannot look at specific changes of individual glaciers or watersheds. In the high mountains of Central Asia GRACE imagery found mass losses of -264 mm/a for the 2003-2009 period (Matsuo and Heki, 2010). This result is in relative agreement with the other satellite image assessments, but is at odds with the recent global assessment from GRACE, that estimated Himalayan glacier losses at 10% of that found in the aforementioned examples for volume loss for the 2003-2010 period (Jacobs et al, 2012). At this point the detailed glacier by glacier inventories inventories of thousands of glaciers are better validated and illustrate the widespread significant loss in glacier area and volume, though not all glaciers are retreating.

This page will continue to be updated as new inventory data is published and new individual glaciers are examined herein. Yao et al (2012) in an examination of Tibetan glaciers observed substantial losses of 7090 glaciers.