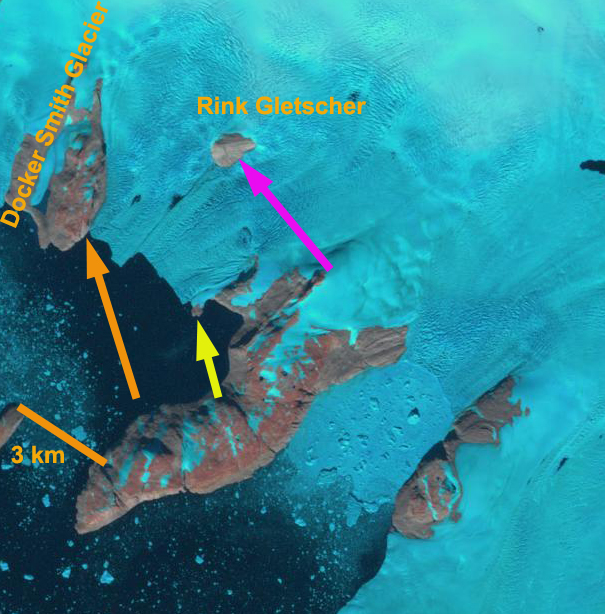
The northern coast of the Devon Ice Cap with Lady Ann Strait at the top in a 2000 and 2017 Landsat image indicating the development of islands at Cape Caledon, at yellow arrows. See map below.
The Devon Ice Cap on Devon Island in the Canadian Arctic ice cap’s area has an area of 15,000 km², with a volume of 3980 km³. The ice cap has been the focus of an ongoing research program led by the University of Alberta Arctic and Alpine Research Group. The mass balance from 1960-2009 was cumulatively -5.6 m, with nine of the eleven most negative years occurring since 1998. Noel et al (2018) update this observation noting that Canadian Arctic ice caps have been losing mass for decades and that mass loss accelerated in 1996. This followed a significant warming (+1.1∘C), which increased the production of meltwater. This has led to widespread area losses. White and Copland (2018) quantify the change in the areal extent of 1773 glaciers on Northern Ellesmere Island from 1999 to 2015. They found regional glacier area decreased by ∼6%, with not a single glacier increasing in areal extent.
East of Belcher Glacier, a large retreating tidewater outlet of the Devon Ice Cap, maps indicate a glacier terminating at Cape Caledon, a series of rocky Points on the southern side of the Lady Ann Strait. Today the Cape Caledon Glacier no longer reaches these rocky Points that have now become islands. Here we examine Landsat images from 2000 to 2018 to illustrate the changes.
In 2000 the Cape Caledon Glacier terminates along its north side on three rocky points, yellow arrows, while the eastern margin is pinned on the northeastern most of the Points and extends nearly due south to another rocky Point, yellow arrow. In 2002 little has changed on the northern or eastern margin. By 2017 the glacier has separated from the three rocky Points on the northern margin, each is now a new island. The mid-August 2017 image indicates that the snowline is particularly high, with none of the Cape Caledon Glacier in the accumulation zone. This supports what has been observed in terms of significant changes in the nature of the firn due to increased meltwater infiltration in the region (Gascoin et al 2013). The eastern margin has retreated along most of its length, but remains attached to the rocky Point on the southern margin. In 2018 the islands remain separated from the glacier, but have some sea ice still around them. The eastern margin that had terminated at the northeast most rocky Point has retreated from 500-700 m along nearly the entire front, except for the very southern margin. The generation of new islands is a process occurring across the Arctic as glaciers recede (Ziaja and Ostafin, 2018).

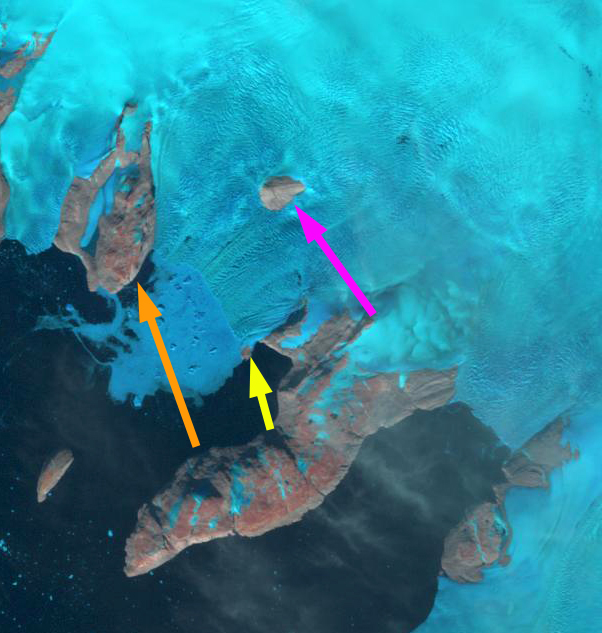
The northern coast of the Devon Ice Cap with Lady Ann Strait at the top in a 2002 and 2018 Landsat image indicating the development of islands at Cape Caledon, at yellow arrows.

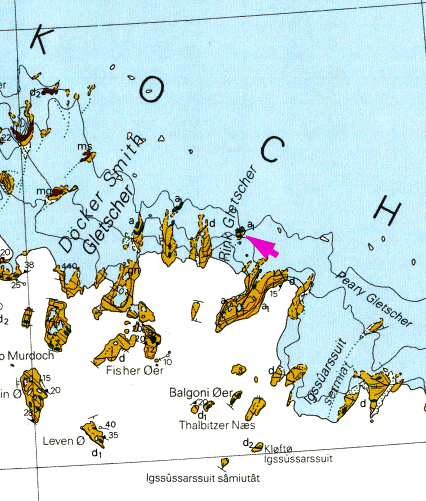
Map of Cape Caledon on the north coast of the Devon Ice Cap
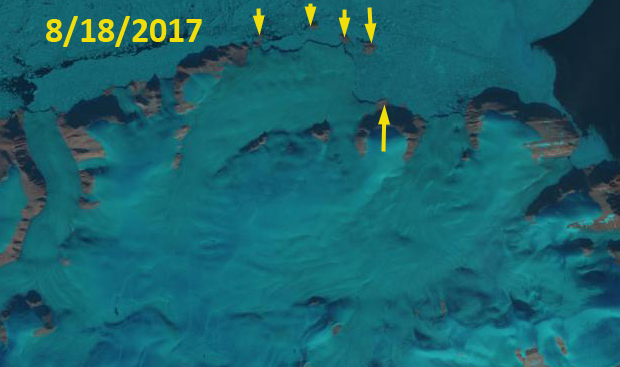
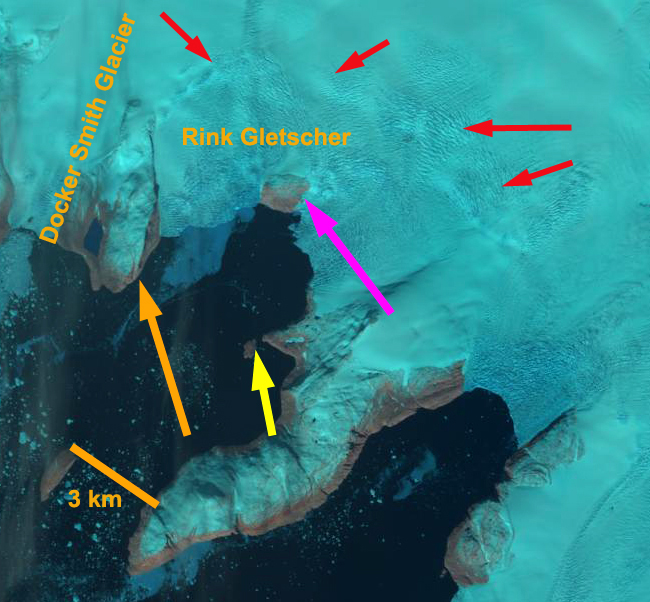
The northern coast of the Devon Ice Cap with Lady Ann Strait at the top in a 2017 Landsat image indicating the development of islands at Cape Caledon, at yellow arrows, surrounded by some sea ice.