34th Annual, 2017 North Cascade Glacier Climate Project Field Season

2017 Field Season Video

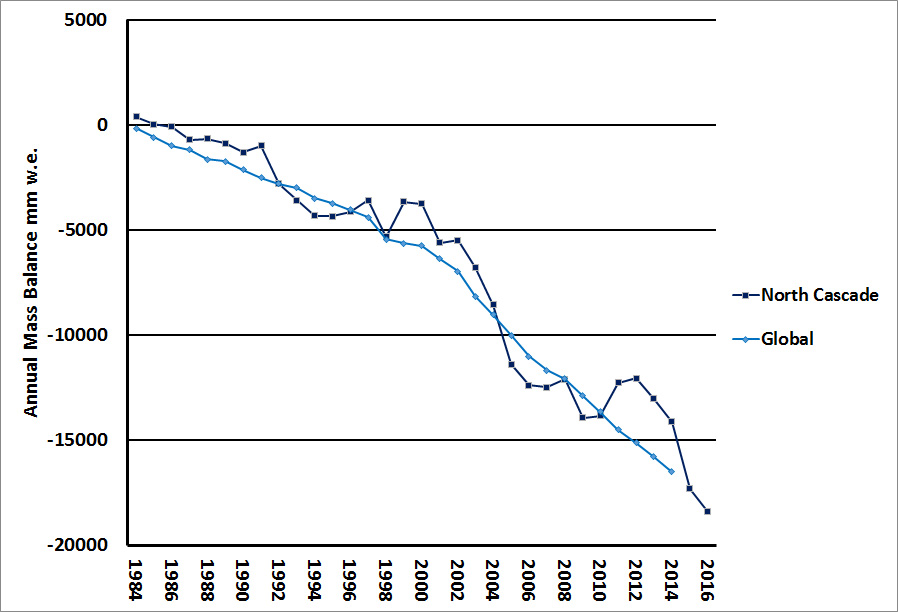
For the thirty fourth consecutive summer we headed into the field to monitor the continued response of North Cascade glaciers to climate change.  In 1984 when I began this program we selected 10 key glaciers to monitor.  Two of these have now disappeared.  All the glaciers have retreated extensively and lost considerable volume.  The mass balance loss is 19 m of water equivalent thickness, which is over 20 m of ice thickness loss on glaciers that averaged less than 75 m thick. This is significant with 25-30% of their entire volume lost. This project continues to monitor glacier loss and the runoff they provide.  We also complete an annual inventory of ice worms on Sholes Glacier and mountain goats on Ptarmigan Ridge region.  In 2017 our key project was a continue partnership with the Nooksack Indian Tribe monitoring glacier melt and runoff in the North Fork Nooksack River basin.  We have not yet had the chance to determine the daily glacier discharge and the resultant contribution to the North Fork Nooksack River. The dry conditions of August certainly will lead to many days with  more than 40% of the flow coming from glacier melt as was the case in 2015. 

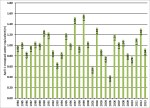
The snowpack on April 1st snowpack was 110% of normal, by June 1st, the snowpack was trending down steeply, but
remained well above the last four years and similar to 2012. Summer turned out to be the driest on record in Seattle and

June 1 snowpack comparison

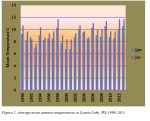
tied for the warmest for the June 21-Sept. 22nd period (KOMONews).  In the mountains the overall melt season temperatures for May 1 through Sept. 30th was 0.15 C cooler than 2015 values, due to a cooler spring.  The most striking feature of the field season was the forest fire smoke largely from British Columbia that obscured views most days. 

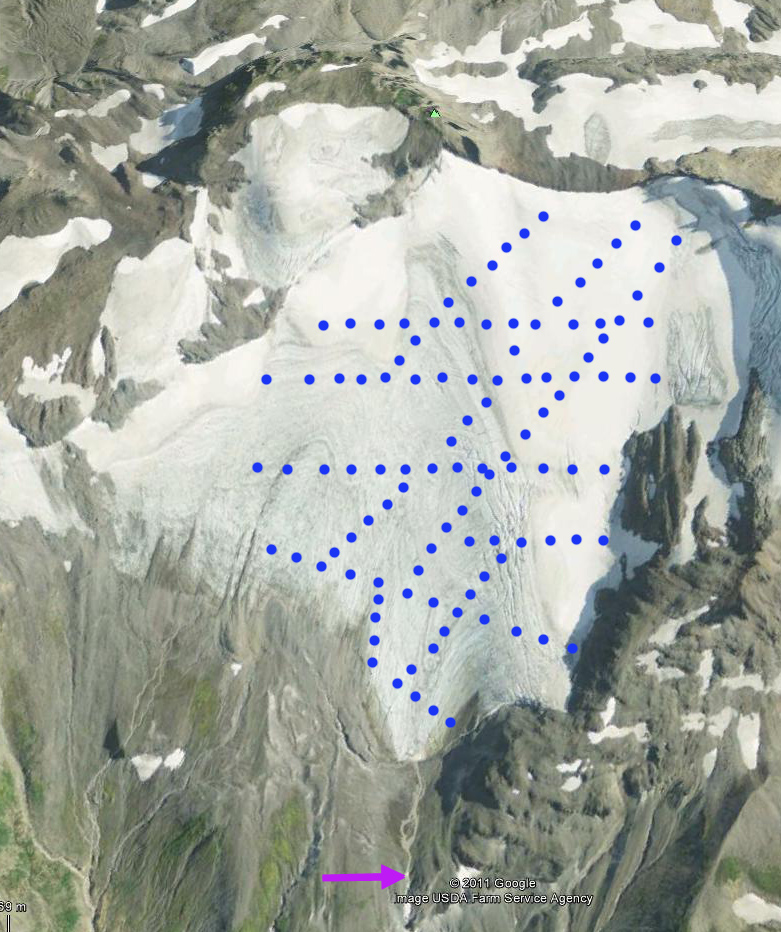
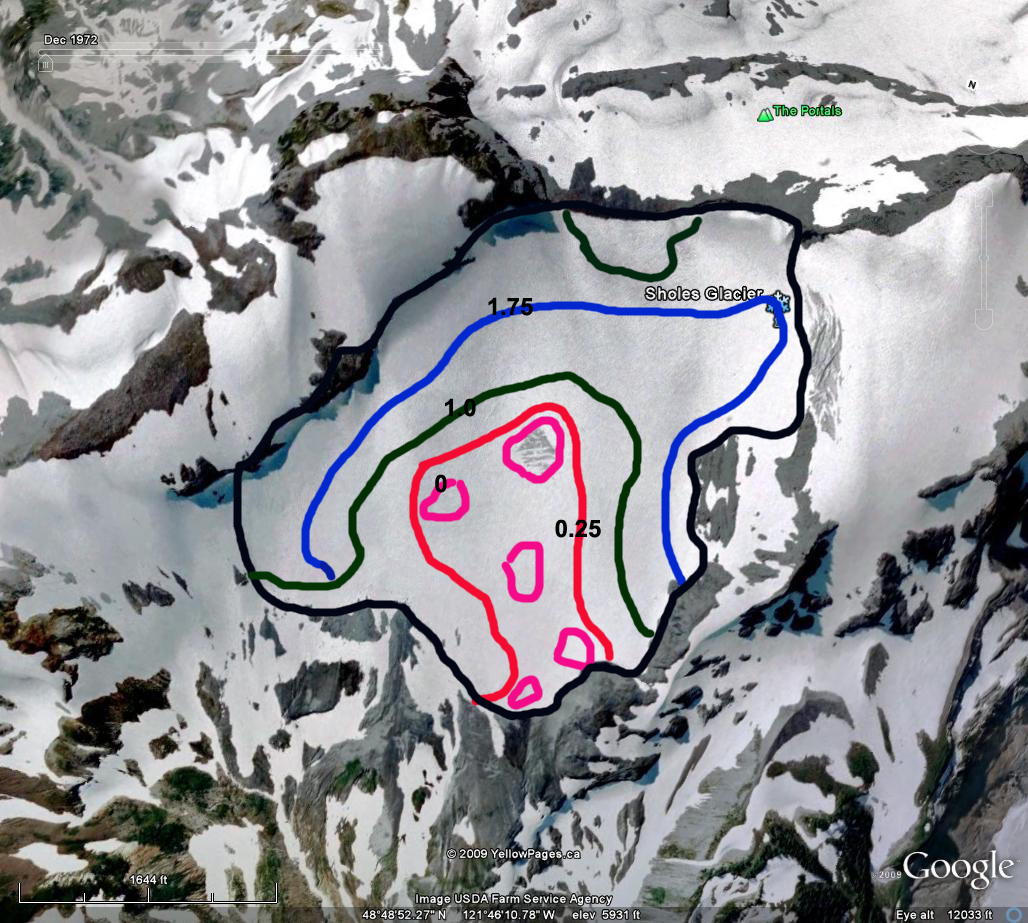
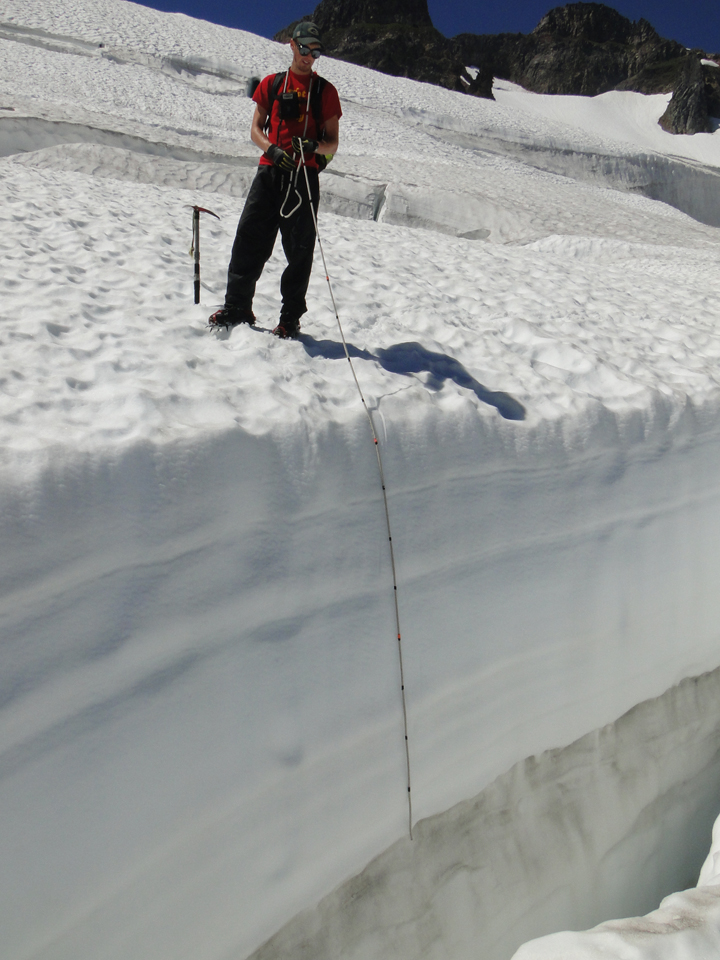
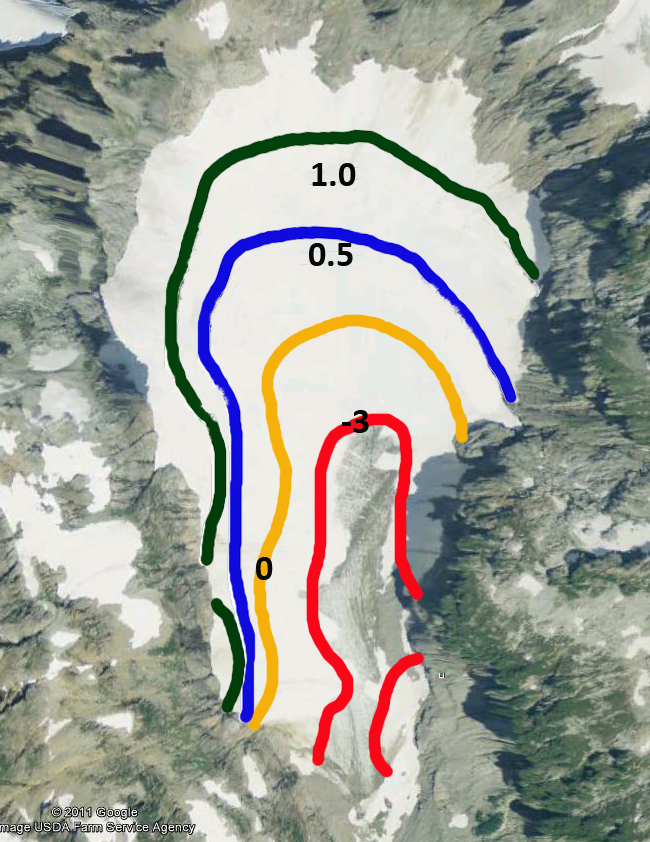
Of the glaciers observed one had a significant positive balance, one a slight positive balance-essentially equilibrium and seven had negative mass balances.  The two glaciers with the most positive balance were the Sholes and Rainbow Glacier, adjacent glacier on the north side of Mount Baker.  The nearby Mount Baker ski area reported 860 inches of snow in 2017, significantly above average.  Compared to other locations in the range this winter snowfall was a positive anomaly, that also was observed on the nearby glaciers. The snow water equivalent in multiple crevasses on Rainbow Glacier at 2000 m in early August was 3.8-4.1 m.  On both Easton and Rainbow Glacier the mass balance gradient was steeper than usual.  On Rainbow Glacier the mass balance was -3 m at 1500 m, 0 at 1700 m and +2.5 m at 200 m as summer ended. We also observed terminus retreat on every glacier.   Retreat averaged 12 m in 2017, lower than in 2015 or 2016.  More striking than retreat in some cases is thinning that reduces slope and frontal thickness.  On Lower Curtis Glacier the terminus seracs are 15 m shorter than two years ago.  On Columbia Glacier the lowest 200 m of the glacier has a slope that has declined by 5 degrees in the last three years and the glacier terminus has retreated 60 m in two years. 


34th Annual Field Program NORTH CASCADE GLACIER CLIMATE PROJECT 2017


2016 Field Season Video

NORTH CASCADE GLACIER CLIMATE PROJECT 2017

For the thirty fourth consecutive summer it is time to head into the field to monitor the continued response of North Cascade glaciers to climate change.  In 1984 when I began this program we selected 10 key glaciers to monitor.  Two of these have now disappeared.  All the glaciers have retreated extensively and lost considerable volume.  The mass balance loss is 19 m of water equivalent thickness, which is over 20 m of ice thickness loss on glaciers that averaged less than 75 m thick. This is significant with 25-30% of their entire volume lost. This project looks at the implications of the glacier loss as we complete an annual inventory of ice worms on Sholes Glacier, mountain goats on Ptarmigan Ridge region and monitor runoff all summer below Sholes Glacier with the Nooksack Indian tribe. 

Illustration of research (Megan Pelto and Jill Pelto)

The result of volume loss and area loss is that despite higher melt rates, the reduction in area of melting glaciers has led to a decline in glacier runoff in the region. The reduced runoff effects salmon, hydropower and irrigation. Details of the runoff impacts are detailed in a Book “Climate Driven Retreat of Mount Baker Glaciers and Glacier Runoff and summarized in Salmon Challenges from the Glaciers to the Salish Sea.

The focus will be on mass balance observations, longitudinal profiles and terminus observations. For Mount Baker, Washington the winter freezing level was much lower than the previous two winters, and was 100 m below the long term mean. The snowpack on April 1st snowpack was 110% of normal, by June 10th, the snowpack is trending down steeply, but remained just above average.  Since then a persistent dry period and the impending heat wave that begins today, Aug. 1 has led to rapid snow loss.  The most recent  comparable year is 2009, which featured a good winter snowpack and very warm mid to late summer conditions. We will first travel north to Mount Baker and the Easton Glacier.    Of the 40 glacier in the World Glacier Monitoring Service Reference glacier list we have two Columbia and Rainbow, as soon as Easton Glacier has 30 years, the minimum requirement it will be added, that is in 2019. The field team consists of Mauri Pelto, 34th year, Jill Pelto, UMaine for the 9th year, Anthony Himmelberger, Clark University 1st year.  Tom Hammond, 14th year will join us for a selected period as will Pete Durr, Mt. Baker Ski Area, 2nd year.   We will report on our findings in a month. Field photos will be posted periodically on Twitter.

Measuring terminus change and snowpack thickness in 2016

Aug.   2:  Hike into Easton Glacier
Aug.   3:  Easton Glacier
Aug.   4:  Easton Glacier
Aug.   5:  Hike Out Easton Glacier, Hike in Ptarmigan Ridge
Aug.   6:  Sholes Glacier
Aug.   7:  Rainbow Glacier
Aug.   8:  Sholes Glacier
Aug.   9:  Hike out and into Lower Curtis Glacier
Aug. 10:  Lower Curtis Glacier
Aug. 11: Hike out Lower Curtis Glacier- Hike in Blanca Lake
Aug. 12:  Columbia Glacier
Aug. 13:  Columbia Glacier
Aug. 14:  Hike out Columbia Glacier; Hike in Mount Daniels
Aug. 15:  Ice Worm Glacier
Aug. 16:  Daniels and Lynch Glacier
Aug. 17:  Ice Worm Glacier, Hike out Mount Daniels-Hike out-

Pacific Northwest Glacier Mass Balance 2013

North Cascades Climate Conditions:
The 2013 winter accumulation season featured 93% of mean (1984-2013) winter snow accumulation at the long term USDA Snotel stations in the North Cascades, Washington (Figure 1). The melt season was exceptional by several measures. The mean summer temperature from June-September and July-September at Lyman Lake is tied with the highest for the 1989-2013 period (Figure 2). The average minimum temperature at Lyman Lake was the highest since 1989 for the July-September period, and tied with the highest for the June-September period (Figure 3). SeaTac airport minimums were high as well indicating the regional nature.

Glacier Mass Balance:
Snow depth was measured at a 30 m spacing across the entire glacier on August 4th. The position of the snowline indicates the location where snow depth is zero. Assessment of stakes emplaced in the glacier from Aug. 3-20 indicates mean ablation during the period of 7.8 cm/day. Assessment of ablation from remapping of the snowline on Sept. 1 indicates mean ablation of 7.5 cm/day during the August 4th-Sept. 1st period. A preliminary map of Sholes Glacier mass balance for Aug. 8th is seen below (Figure 6). The contours are in meters of water equivalent, which is the amount of water thickness that would be generated if the snow or ice was melted. Note the similarity of the 1.75 m contour and the Sept,. 12th snowline.The best measure of ablation over the period from August 4th to Sept. 12th is the shift in the snowline, as identified in satellite imagery (Figure 7 and 8). The snow depth at a particular location of the snowline on Sept. 12th indicates the snow ablation since August 4th. Observations of the snowline margin on Aug. 20, Sept. 1 and Sept. 12 indicated mean ablation of 7.4 cm per day from Aug. 4th to Sept. 12th.

sholes 2013 August melt
Figure 4 Comparison of snowpack on Sholes Glacier on August 4th and September 1st, 2013

sholes glacier network
Figure 5. Sholes Glacier snow depth measurement network

sholes 2013 8-8
Figure 6. Snow depth distribution in snow water equivalent on Sholes Glacier on Aug. 8th, 2013.

sholes 8-4-2013
Figure 7 August 4th satellite image showing snowline on Sholes Glacier from Landsat imagery.

sholes 9-12-2013
Figure 8. September 12 snowline on Sholes Glacier from Landsat imagery

Snow depth observations on Easton Glacier on the bench below the main icefall at 2000 m, yielded an average depth of 3.1 m on Aug. 10th. The bench was completely snowcovered on Aug. 10th. GPS measurements of the snowline on Sept. 15th indicate ablation of 2.75 m since Aug. 10th. This is an ablation rate of 7.6 cm of snow melt per day. This is 0.2 cm/day higher than Sholes Glacier. The time period is not identical either. The southern orientation of Easton Glacier typically leads to higher ablation rates at specific elevations than on Sholes Glacier. Satellite observations of the change in snowline position compared to snow depth observations from Aug. 4th to Sept 12th indicate mean ablation of 7.2-8.0 cm/day.

On the four Mount Baker glaciers a total of 380 snow depth measurements were made on (Figure 9). The initial mass balance assessment is -0.78 m on Columbia Glacier. -1.58 m on Easton Glacier, -0.5 m on Foss Glacier, -0.76 m Ice Worm, -0.85 m on Lower Curtis Glacier, -0.40 m Lynch Glacier, -1.85 m on Rainbow Glacier, -1.7 m on Sholes Glacier and -1.15 m on Yawning Glacier. easton crevasse depth
Figure 9 Snow depth in crevasse on Easton Glacier.

columbia glacier Ba 2013
Figure 10 Mass balance map for Columbia Glacier in meters of water equivalent.

On the Juneau Icefield in southeast Alaska the ablation season was warmer and longer than normal. The result was snowlines rising above average at Lemon Creek and Taku Glacier, where the Juneau Icefield Research Program measures mass balance. For Taku Glacier the ELA was 1050 m, 75 m above an equilibrium snowline, and 1115 m, 100 m above an equilibrium snowline for Lemon Creek Glacier. The final mass balance for these glaciers will be in the -0.5 to -1.0 m range for both. Further north the USGS reports preliminary results, from there two Alaskan benchmark glaciers, which indicate that Gulkana Glacier in the Alaska Range, mass balance was the 5th most negative year. At Wolverine Glacier in the Kenai Mountains mass balance will likely be the most negative on record. In British Columbia both the Helm Glacier and Place Glacier are observed annually for mass balance. On Sept 12, 2013 Landsat imagery indicates limited remaining snowcover on both of these glaciers. The snowline is at 2050 m on Helm Glacier and 2300 m on Place Glacier, red arrows. The snowcovered area is less than 20% on Helm Glacier and 30% on Place Glacier, which will lead to large negative mass balances (Figure 11 and 12). Hence, all 16 glaciers examined here will have significant negative mass balances in 2013.

taku lemon creek snowline 2013
Figure 11. Landsat image indicating the snowline on Sept. 24, 2013 on Lemon Creek and Taku Glacier.

helm glacier 2013
Figure 12 Helm Glacier in Landsat imagery 9-12-2013

place glacier 2013
Figure 13 Place Glacier in Landsat imagery 9-12-2013

Mass balance 2011 North Cascades, Washington and Juneau Icefield, Alaska

In the summer of 2011, the North Cascade Glacier Climate Project completed 430 measurements of snowpack on 10 glaciers using probing and crevasse stratigraphy. This is much less than our normal number because of the exceptionally deep snowpack. The probe we use was 5 meters long, beyond that only crevasses could be used. The mass balance was quite positive for the first time since 2002. The combination of a La Nina and a negative PDO almost always deliver a mass balance in the North Cascades, 9 of 11 times (Pelto, 2008). The March-May period was the coldest and wettest spring ever in the North Cascade region. Summer was also cool in the region. This led to positive balances ranging from +1.2 to +2.2 m, the first year with significant mass balance since 1999. The first image below is the preliminary mass balance map for the Lynch Glacier in 2011, indicating the measurement points, black dots, and the blue contour line is the snowline. The cumulative mass loss since 1984 is still 12 meters, or 20-30% of the total volume of these glaciers, second image below. . Below is the field season captured in images.

Fourteen hundred kilometers north the Juneau Icefield glaciers did not fare as well. As part of the Juneau Icefield Research Program mass balance measurements are made every summer on the Taku and Lemon Creek glaciers. This summer the program was headed by Jay Fleisher, the mass balance portion was spearheaded by Chris McNeil and Toby Dittrich, Portland Community College. Satellite imagery from Sept. 11, 2011 indicates the snowline at the end of the melt season was just over 1000 meters on Taku Glacier and nearly 1100 meters on Lemon Creek Glaciers. This is higher than average and indicates negative mass balances for both glaciers. Snowpit and probing measurements at 40 locations, will yield a more specific mass balance, than provided by the snowline. The snowline is quite similar to 2009 and 2010 with snowpack depths generally a bit lower, 2009 and 2010 were also negative mass balance years. The snowpits are typically 2-4 meters deep and quite an effort to dig, the image below is from Cathy Connor at University of Alaska Southeast. The cumulative mass balance loss since 1953 on Lemon Creek Glacier is 25 meters, 15 meters since 1984.