Croker Bay Glacier, Nunavut Canada Poised for Further Retreat

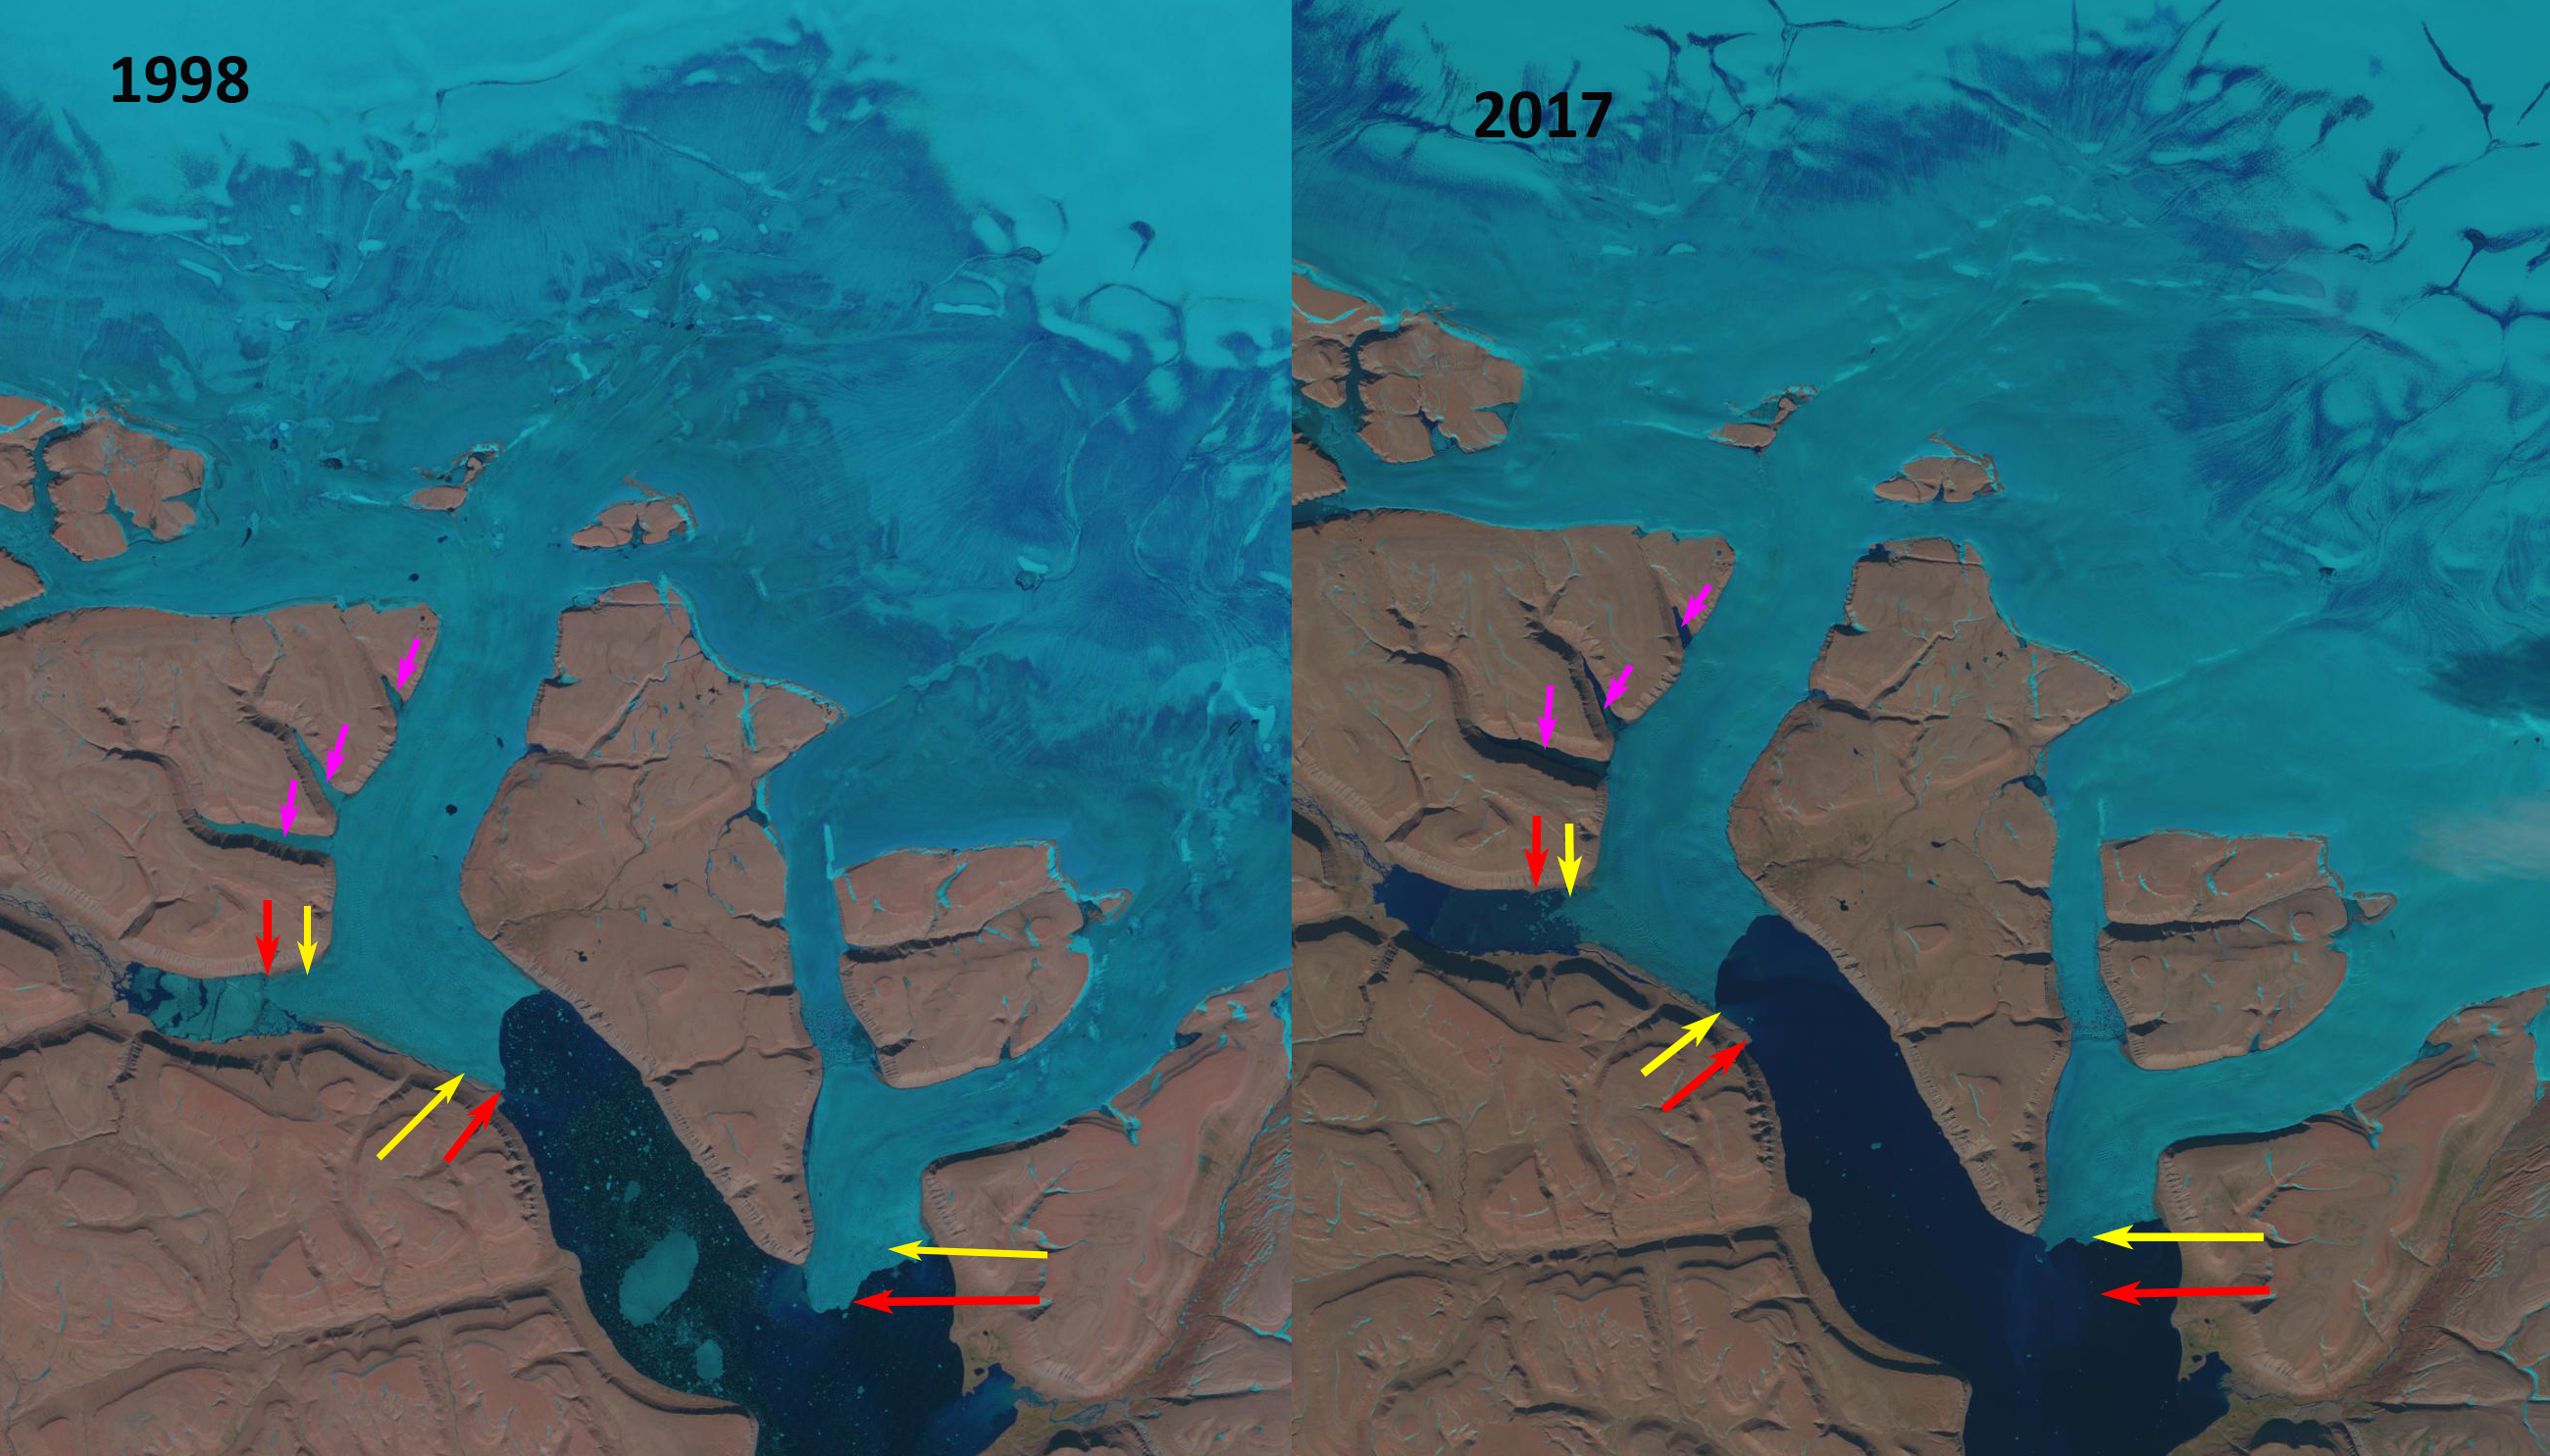
Croker Bay Glacier, Devon Ice Cap, Nunavut in Landsat images from 1998 and 2017.  The red arrows indicate the 1998 terminus location, yellow arrows the 2017 terminus location.  The pink arrows indicate three inlet on the north glacier. 

Croker Bay Glacier drains the southwest quadrant of the Devon Ice Cap, Nunavut.  A study by Van Wychen et al (2012) focused on velocity changes of the Devon ice Cap. They identify that Croker Bay Glacier has two main termini, the south and north terminus and that the region of higher velocity +100 m/year for these glaciers penetrates further into the ice cap than other outlets.  This is on the opposite side of the ice cap from where three new islands have emerged due to retreat.

In 1998 the south terminus of Croker Glacier extends 1.2 km beyond the tip of the peninsula on its west margin. In 1998 the northern terminus has both an east and a west terminus. The west terminus extends up a side valley.  The pink arrows indicate three side channels into which the glacier flows into the southern two.  The transient snowline in 1998 is ~1100 m, with the crest of the ice cap at 1800 m.  In 2001 there is limited change and a recent snowfall has covered most of the glacier. By 2017 the southern terminus has retreated to approximately parallel with the western margin peninsula, a distance of 1700 m.  The northern terminus has retreated 1400 m on the eastern side and 1100 m on the western side. The result is a much thinner ice connection reaching the southern side of the Croker Bay fjord. The transient snowline is high at ~1100 m again.  The 2018 image is from 2018. The snowline has already begun to decline due to a late summer snow event. There are a number of small icebergs in Croker Bay, particularly trapped in front of the western most terminus indicating continued calving retreat.  The observations here are a local example resulting from the ongoing mass losses  found on Canadian Arctic ice caps that have been losing mass for decades and that mass loss accelerated in 1996,  Noel  et al (2018).  This has led to widespread area losses.  White and Copland (2018) quantify the change in the areal extent of 1773 glaciers on Northern Ellesmere Island from 1999 to 2015. They found regional glacier area decreased by ∼6%, with not a single glacier increasing in areal extent.

Croker Bay Glacier, Devon Ice Cap, Nunavut in a Landsat image from 2001 and a Sentinel image from 2018.  The red arrows indicate the 1998 terminus location, yellow arrows the 2017 terminus location.  The pink arrows indicate three inlet on the north glacier. 

Velocity Map of Devon Ice Cap, which is Figure 1 from Van Wychen et al (2012)

Trinity-Wykeham Glacier Retreat, Causing Separation, Ellesmere Is. Canada

Trinity (T) and Wykeham (W) Glacier in 1999 and 2016 Landsat images.  Red arrow indicates 1999 margin, yellow arrow 2016 margin, yellow dots the actual ice front. 

Trinity (T) and Wykeham (W) Glacier flow east from Ellesmere Island into a fjord off of Nares Strait.  Until recently the two have been joined just before the terminus. Millan et al (2017) observed glaciers in the region.  They noted a change  in ice loss from Queen Elizabeth Islands glaciers, during the 1991–2005 mass loss was 52% from ice discharge and 48% from surface mass balance. During 2005–2014, the mass loss increased dramatically with 10% from ice discharge and 90% from surface balance losses. They reported that Trinity and Wykeham Glacier had a stable velocity from 1991-2009 and doubled in speed by 2015.  They noted a retreat of 1.8 km for Wyjkeham Glacier form 1991-2015 and 5 km for Trinity Glacier.  Here we examine Landsat imagery from 1999, 2002, 2004 and 2016 to identify changes in the two glaciers.

In 1999 the two glaciers are joined with a 14 km long ice front.  The ice front of Trinity to the North extends to an outlet glacier entering the fjord from the north.  The southern margin of the joint front extends 4 km beyond a mountain marking the southern entrance to what will be Wykeham Fjord (SW).  In 2002 there is little change in the icefront.  By 2004 Trinity Glacier has retreated 4 km along the northern edge and 5 km on the southern edge, now terminating at the eastern end of a ridge marked (MR).  Wykeham Glacier has experienced a minor retreat.  From 2004 to 2016 there is little change in the front of Trinity Glacier, while Wykeham Glacier has retreated  1.5 km along the southern margin.  This illustrates the substantial ice discharge loss before 2004 of the two glaciers and limited ice discharge net loss after 2004, as Millan et al (2017) noted. The strong surface mass balance losses of recent years has led to thinning, which should drive further retreat. The two glacier will enter their own developing fjords. In 2016 it is evident that the melt area extends quite high on the glacier, bottom image.  Melt ponds extend up to at least 800 m, purple arrows.  The acceleration in 2015 if it continues will deliver a much higher flux further reducing volume and driving retreat.  We have seen this pattern of  thinning, acceleration and retreat on many glaciers typically driven by greater surface melt and frontal/basal melt, depending on flotation. The retreat here is similar to that of Mittie Glacier also on Ellesmere Island.

Trinity (T) and Wykeham (W) Glacier in 2002 Landsat image.  Red arrow indicates 1999 margin, yellow arrow 2016 margin, yellow dots the actual ice front. 

Trinity (T) and Wykeham (W) Glacier in 2004 Landsat image.  Red arrow indicates 1999 margin, yellow arrow 2016 margin, yellow dots the actual ice front. 

Trinity (T) and Wykeham (W) Glacier in 2016 Landsat image.  Red arrow indicates 1999 margin, yellow arrow 2016 margin, yellow dots the actual ice front and purple arrows melt ponds.